. 2017 Oct 5;550(7674):133-136.
doi: 10.1038/nature24040. Epub 2017 Sep 27.

PAK signalling drives acquired drug resistance to MAPK inhibitors in BRAF-mutant melanomas

Affiliations

PAK signalling drives acquired drug resistance to MAPK inhibitors in BRAF-mutant melanomas

Hezhe Lu et al. Nature. .

Erratum in

  • Author Correction: PAK signalling drives acquired drug resistance to MAPK inhibitors in BRAF-mutant melanomas.
    Lu H, Liu S, Zhang G, Wu B, Zhu Y, Frederick DT, Hu Y, Zhong W, Randell S, Sadek N, Zhang W, Chen G, Cheng C, Zeng J, Wu LW, Zhang J, Liu X, Xu W, Krepler C, Sproesser K, Xiao M, Miao B, Liu J, Song CD, Liu JY, Karakousis GC, Schuchter LM, Lu Y, Mills G, Cong Y, Chernoff J, Guo J, Boland GM, Sullivan RJ, Wei Z, Field J, Amaravadi RK, Flaherty KT, Herlyn M, Xu X, Guo W. Lu H, et al. Nature. 2019 Jan;565(7738):E4. doi: 10.1038/s41586-018-0814-7. Nature. 2019. PMID: 30532003

Abstract

Targeted BRAF inhibition (BRAFi) and combined BRAF and MEK inhibition (BRAFi and MEKi) therapies have markedly improved the clinical outcomes of patients with metastatic melanoma. Unfortunately, the efficacy of these treatments is often countered by the acquisition of drug resistance. Here we investigated the molecular mechanisms that underlie acquired resistance to BRAFi and to the combined therapy. Consistent with previous studies, we show that resistance to BRAFi is mediated by ERK pathway reactivation. Resistance to the combined therapy, however, is mediated by mechanisms independent of reactivation of ERK in many resistant cell lines and clinical samples. p21-activated kinases (PAKs) become activated in cells with acquired drug resistance and have a pivotal role in mediating resistance. Our screening, using a reverse-phase protein array, revealed distinct mechanisms by which PAKs mediate resistance to BRAFi and the combined therapy. In BRAFi-resistant cells, PAKs phosphorylate CRAF and MEK to reactivate ERK. In cells that are resistant to the combined therapy, PAKs regulate JNK and β-catenin phosphorylation and mTOR pathway activation, and inhibit apoptosis, thereby bypassing ERK. Together, our results provide insights into the molecular mechanisms underlying acquired drug resistance to current targeted therapies, and may help to direct novel drug development efforts to overcome acquired drug resistance.


Conflict of interest statement

The authors declare no conflict of interests.

Figures
Extended Data Figure 1
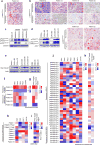
Extended Data Figure 1. ERK and PAK activity in BRAFi and BRAFi+MEKi resistance melanoma. Related to Figure 1
a and b. IHC staining of p-ERKT202/Y204 in paired pre- and post-treatment tumor biopsy specimens procured from patients who relapsed on BRAFi (a) or BRAFi+MEKi (b). Note that some of the strongly positive-stained cells are macrophages rather than tumor cells. Scale bar, 50 µm. The tissues were stained with Nova Red. c. Western blotting analysis showed the levels of p-ERKT202/Y204 and p-PAK1S199/204/PAK2S192/197 in WM3939 PDX-CR tumor samples. Tumors from mice treated with vehicle control, or with BRAFi+MEKi were shown. WM9-CR was used for comparison. d. Western blotting of PAK phosphorylation in matching parental, BR and CR cells. e. Western blotting using a polyclonal antibody that recognizes both Cdc42 and Rac1 in matching parental, BR and CR cells. Cdc42 and Rac1 could not be separated by SDS-PAGE due to their similar molecular weights. f, h and j. Heatmaps of expression levels of PAKs, RAC1 and CDC42 in paired pre- and post-treatment tumor biopsy specimens procured from patients with metastatic melanoma who progressed on MAPK inhibitors. Data were analyzed using LIMMA package in R. The fold change of expression levels in paired post-treatment tumor biopsy specimen over pre-treatment tumor biopsy specimen was shown in the heatmap. Color scale, log2 transformed expression for each gene was normalized to the mean value of all samples. g, i and k. Heatmaps of the enrichment scores of two PAK signaling-related gene sets in paired pre- and post-treatment tumor biopsy specimens procured from patients with metastatic melanoma who relapsed on MAPK inhibitors. The value for each entry is the difference of enrichment score from post-treatment over pre-treatment specimens. Gene expression microarray or RNA-seq data were downloaded from EGAD00001001306, GSE65184, GSE65185 and GSE61992.
Extended Data Figure 2
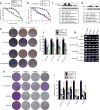
Extended Data Figure 2. CR cells resistant to the combination of PLX4720 and PD0325901 exhibit cross-resistance to other combinations of BRAF and MEK inhibitors, and are sensitive to PAK inhibitor PF-3758309. Related to Figure 2
a. Paired parental and CR cells were treated with the combination of three different sets of BRAF and MEK inhibitors, separately, for 4 days and then fixed and stained with Giemsa. b. Quantification of cell survival (n=3 biologically independent samples). c and d, Relative survival of matching parental, BR and CR cells treated with increasing concentrations of PF-3758309 (n=3 or 4 biologically independent samples, as indicated in the figure). All IC50 values were list in Supplementary Table 4. Two-sided Student’s t-test was used for statistical analyses of the IC50 values. e–h. 7 BR (e) and 6 CR cell lines (f) were treated with DMSO, 1µM or 3µM PF3758309 for 72 hr, and then fixed and stained with Giemsa. The data were quantified in (g) for BR and (h) CR cells (n=3 biologically independent samples). Cell density was measured by Image J. The values after background subtraction were normalized to parental cells treated with DMSO. Two-sided Student’s t-test was used for statistical analyses (b, c, d, g and h); Data are plotted as mean ± SEM.
Extended Data Figure 3
Extended Data Figure 3. Inhibition of PAKs by PF3758309 decreased the viability of drug resistant melanoma cells. Related to Figure 2
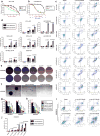
a and b. Relative survival of BR and CR cells treated with increasing concentrations of the PF-3758309 (“PF”), PLX4720 (“PLX”), and PD0325901 (“PD”) for 48 hr. Cell viability was analyzed by MTT assay. The data were normalized to cells treated with DMSO (n=4 biologically independent samples). c. FACS analysis of BR cells and CR cells treated with PF3758309. All the cells were labeled with propidium iodide and PSVue 643, and then analyzed by BD LSRII. d. Quantification of cell apoptosis. The percentage of apoptosis cells after PF3758309 treatment was compared with the cells treated with DMSO (n=3 or 4 biologically independent samples as indicated in the figure). e. Giemsa staining of the PDX-BR cells WM3936 and WM3903 that were treated with DMSO, or different concentrations of PF3758309 for 3 days. The staining was quantified in (g) (n=3 biologically independent samples). f. Anchorage independent growth assay of WM3936 cells. A total of 2000 cells were seeded in medium with soft agar in six-well plates. Scale bar, 200µm. The number of colonies in each field was quantified in (h) (n=6 biologically independent samples). i. WM3936 cells were treated with DMSO or different concentrations of PF3758309 for 3 days. All cells were labeled with propidium iodide and PSVue 643, and then analyzed by BD LSRII. j. Quantification of cell apoptosis. The percentage of apoptosis cells after PF3758309 treatment was compared with the cells treated with DMSO (n=5 biologically independent samples). Two-sided Student’s t-test (a, b, d, g, h and j) was used for statistical analyses. Data are plotted as mean ± SEM.
Extended Data Figure 4
Extended Data Figure 4. Cell cycle analysis of BR and CR cells treated with PF3758309. Related to Figure 2
a. Immunofluorescence staining of Ki67 (red) in indicated cells, which were treated with DMSO or 1µM PF3758309. The nuclei were stained with DAPI (blue). b. Quantification of cells with Ki67 staining (n>70 cells/ per assay, 3 independent experiments). c. Flow cytometric analysis (10000 cells were analyzed per assay). Cells were fixed, stained with PI, and then analyzed by a FACscan flow cytometer and ModFit LT (Verity Software) d. Histograms of PI staining (n=3 biologically independent samples). Two-sided Student’s t-test (b and d) was used for statistical analyses. Data are plotted as mean ± SEM.
Extended Data Figure 5
Extended Data Figure 5. Inhibition of PAKs by siRNA, kinase-dead dominant-negative PAK1K299R mutant or PAK inhibitor IPA-3 decreased the viability of drug resistant melanoma cells. Related to Figure 2
a and b. Relative survival of BR or CR cells transfected with PAK1K299R or PAK1PID, or siRNA against PAK1 and PAK2. Cells were then cultured with PLX4720 or PLX4720+PD0325901 at different concentrations for 48 hr. Cell viability was analyzed by MTT assays (n=4 biologically independent samples). Two-sided Student’s t-test (for IC50 values) was used for statistical analysis. c and d. PAK1 and actin levels in cells were analyzed by Western blotting. e. BR and CR cells were treated with DMSO, 10µM or 20µM IPA-3 for 72 hr, and then processed for Giemsa staining. f. Quantification of the staining in (e) (n=3 biologically independent samples). g. RT-PCR analysis of the expression of PAK4 in indicated cells. h. Giemsa staining of indicated cells. i. Quantification of the staining in (h) (n=3 biologically independent samples). Two-sided Student’s t-test (a, b, f and i) was used for statistical analysis. Data are plotted as mean ± SEM.
Extended Data Figure 6
Extended Data Figure 6. Combined inhibition of MAPK and PAK pathways significantly inhibited BR and CR tumor proliferation in mice and improved survival. Related to Figure 2
a and b. Tumor growth curves. Mice were injected with 1205Lu-BR (n=9 mice per group) or WM9-BR (n=9 mice per group) (a), WM9-CR (n=5 mice per group) or A2058-CR cells (control n=8, other n=9 mice per group) (b), and proceed for MAPK or PAK inhibition for indicated days. c. Survival curves of the mice bearing 1205Lu-BR and WM9-CR xenografts. (n=5 mice per group). All groups were compared with the PLX or PLX+PD group; no multiple comparisons. Two-way ANOVA (a and b) and log-rank test (c) was used for statistical analyses. Individual tumor volume data points can be found in the Source Data. Data are plotted as mean ± SEM. For mouse survival, the function survdiff from the survival R package was used.
Extended Data Figure 7
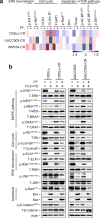
Extended Data Figure 7. RPPA and immunoblotting analyses of signaling proteins in melanoma cells treated with MAPK inhibitor or PAK inhibitor. Related to Figure 3 and 4
a. 8 BR cell lines and 3 PDX-BR cell lines were treated with DMSO or PF3758309 for 48 hr. Protein lysates from these cells were then analyzed by RPPA. Data were analyzed using LIMMA package in R. The levels of identified proteins (that displayed significant changes in at least 4 BR cell lines after PF3758309 treatment versus DMSO, P <0.01) were shown in the heat map. Color scale, log2 transformed expression for each protein was normalized to the mean value of all samples. b. 1205Lu-CR, UACC903-CR and WM164-CR cells were treated with DMSO or PF3758309 for 48 hr. Cell lysates were analyzed by RPPA. Data were analyzed using LIMMA package in R. The levels of identified proteins (that displayed significant changes in at least 2 CR cell lines after PF3758309 treatment versus DMSO, P <0.01) were shown in the heatmap. Color scale, log2 transformed expression (Red, high; Blue, low) for each protein was normalized to the mean value of all samples. c. 1205Lu and UACC903 parental and CR cells were treated as indicated (Figure 4b). Protein levels were analyzed in three independent assays, and the staining was measured by Image J. (n=2 for p-ELK1S383 and p-BadS112, n=3 for all other proteins). To minimize variations caused by different exposure time in each independent assay, the staining was normalized to the mean of all the samples from its group before statistical analyses. Two-sided Student’s t-test. Data are plotted as mean ± SEM. d. 1205Lu cells stably expressing PAK1107F/423E or vector control were treated with 1µM PLX4720 and 100nM PD0325901 for 48 hr. The levels of MAPK pathway-related proteins, cell cycle-related proteins and apoptosis-related proteins were analyzed by Western blotting.
Extended Data Figure 8
Extended Data Figure 8. Inhibition of JNK, S6K or β-catenin inhibited BR and CR cell viability. Related to Figure 4
a. Giemsa staining of 1205Lu and UACC903 parental, BR and CR cells that were treated with either DMSO, the ERK inhibitor SCH772984 (3 µM), the JNK inhibitor SP600125 (3 µM) or the S6K inhibitor PF-4708671 (3 µM) for 3 days. b. Quantification of cell survival (n=3 biologically independent samples). Cell density was quantified with Image J. The values were normalized to those of parental cells treated with 1µM respective inhibitor. c. Giemsa staining of indicated cells that were infected with Luciferase shRNA, JNK1 shRNA, JNK1/2 shRNA and two different β-catenin shRNA. The staining was quantified in (d) (n=3 biologically independent samples). e. RT-PCR analysis of the expression of JNK1 and β-catenin in indicated cells. f. Schematic diagrams showing the molecular mechanisms by which PAKs mediate acquired drug resistance of BRAFV600E melanoma cells to BRAFi (the left panel) and BRAFi+MEKi (the right panel). For data presented in this figure, two-sided Student’s t-test (b and d) was used for statistical analyses. Data are plotted as mean ± SEM.
Figure 1
Figure 1. Activation of PAK signaling in BRAFV600E melanoma cells with acquired drug resistance
a and b. Levels of ERK and phospho-ERK in paired parental and BR (a) and CR cells (b). c. IHC staining of paired pre- and post-BRAFi/MEKi tumor biopsies with anti-p-ERK antibody. Scale bar, 50µm. d and e. Immunoblotting analysis of phosphorylated CRAF and PAKs in paired parental and BR (d) and CR (e) cell lines. f. qRT-PCR analysis of PAK1, PAK2, RAC1 and CDC42 in paired pre- and post-treatment tumor biopsies derived from melanoma patients.
Figure 2
Figure 2. Inhibition of PAK activity overcomes acquired drug resistance
a, Relative survival of 1205Lu BR and CR cells treated with increasing concentrations of PF-3758309, PLX4720, and PD0325901. b and c, Relative survival of indicated cells transfected with PAK1K299R or PAK1PID, or siRNA against PAK1 and PAK2 (b) or PAK1107F/423E (c). Cells were cultured with PLX4720 or PLX4720+PD0325901 and analyzed by MTT. Data were normalized to control cells treated with DMSO (n=4 biologically independent samples). d. Tumor growth curves of WM4008-1 xenograft with indicated treatments (n=5 mice). For statistics, two-sided Student’s t-test (IC50 values in a–c) and two-way ANOVA (d) were used. Data are plotted as mean ± SEM. Tumor volume data points can be found in the Source Data.
Figure 3
Figure 3. PAKs mediate the re-activation of ERK signaling in BR melanoma cells
a and b. Immunoblotting analysis of indicated signaling proteins in parental and BR cells (a) or BR cells treated with PF-3758309 (b). c. p-ERK IHC staining of 1205Lu-BR xenograft tumors treated with indicated inhibitors. Scale bar, 50µm. d. Heat map analysis of indicated proteins in BR cells treated with PF-3758309. e. Heat map analysis of indicated proteins in 1205Lu cells expressing PAK1107F/423E in the absence and presence of PLX4720. f. Immunoblotting analysis of indicated signaling proteins in cells stably expressing PAK1107F/423E treated with PLX4720.
Figure 4
Figure 4. Signaling pathways in CR melanoma cells with PAK inhibition
a. Heat map analysis of indicated proteins in CR cells treated with PF-3758309. b. Immunoblotting analysis of 1205Lu and UACC903 parental and CR cells under indicated treatments. The levels of MAPK pathway-related proteins, cell cycle-related proteins and apoptosis-related proteins were analyzed.

Similar articles

Cited by

  • A Comprehensive Review on MAPK: A Promising Therapeutic Target in Cancer.
    Braicu C, Buse M, Busuioc C, Drula R, Gulei D, Raduly L, Rusu A, Irimie A, Atanasov AG, Slaby O, Ionescu C, Berindan-Neagoe I. Braicu C, et al. Cancers (Basel). 2019 Oct 22;11(10):1618. doi: 10.3390/cancers11101618. Cancers (Basel). 2019. PMID: 31652660 Free PMC article. Review.
  • Design, Synthesis, In Vitro and In Vivo Characterization of CDC42 GTPase Interaction Inhibitors for the Treatment of Cancer.
    Brindani N, Vuong LM, Acquistapace IM, La Serra MA, Ortega JA, Veronesi M, Bertozzi SM, Summa M, Girotto S, Bertorelli R, Armirotti A, Ganesan AK, De Vivo M. Brindani N, et al. J Med Chem. 2023 Apr 27;66(8):5981-6001. doi: 10.1021/acs.jmedchem.3c00276. Epub 2023 Apr 7. J Med Chem. 2023. PMID: 37026468 Free PMC article.
  • Myosin II Reactivation and Cytoskeletal Remodeling as a Hallmark and a Vulnerability in Melanoma Therapy Resistance.
    Orgaz JL, Crosas-Molist E, Sadok A, Perdrix-Rosell A, Maiques O, Rodriguez-Hernandez I, Monger J, Mele S, Georgouli M, Bridgeman V, Karagiannis P, Lee R, Pandya P, Boehme L, Wallberg F, Tape C, Karagiannis SN, Malanchi I, Sanz-Moreno V. Orgaz JL, et al. Cancer Cell. 2020 Jan 13;37(1):85-103.e9. doi: 10.1016/j.ccell.2019.12.003. Cancer Cell. 2020. PMID: 31935375 Free PMC article.
  • Targeting TBK1 to overcome resistance to cancer immunotherapy.
    Sun Y, Revach OY, Anderson S, Kessler EA, Wolfe CH, Jenney A, Mills CE, Robitschek EJ, Davis TGR, Kim S, Fu A, Ma X, Gwee J, Tiwari P, Du PP, Sindurakar P, Tian J, Mehta A, Schneider AM, Yizhak K, Sade-Feldman M, LaSalle T, Sharova T, Xie H, Liu S, Michaud WA, Saad-Beretta R, Yates KB, Iracheta-Vellve A, Spetz JKE, Qin X, Sarosiek KA, Zhang G, Kim JW, Su MY, Cicerchia AM, Rasmussen MQ, Klempner SJ, Juric D, Pai SI, Miller DM, Giobbie-Hurder A, Chen JH, Pelka K, Frederick DT, Stinson S, Ivanova E, Aref AR, Paweletz CP, Barbie DA, Sen DR, Fisher DE, Corcoran RB, Hacohen N, Sorger PK, Flaherty KT, Boland GM, Manguso RT, Jenkins RW. Sun Y, et al. Nature. 2023 Mar;615(7950):158-167. doi: 10.1038/s41586-023-05704-6. Epub 2023 Jan 12. Nature. 2023. PMID: 36634707 Free PMC article.
  • Recognition of physiological phosphorylation sites by p21-activated kinase 4.
    Chetty AK, Sexton JA, Ha BH, Turk BE, Boggon TJ. Chetty AK, et al. J Struct Biol. 2020 Sep 1;211(3):107553. doi: 10.1016/j.jsb.2020.107553. Epub 2020 Jun 23. J Struct Biol. 2020. PMID: 32585314 Free PMC article.

References

    1. Chapman PB, et al. Improved survival with vemurafenib in melanoma with BRAF V600E mutation. N. Engl. J. Med. 2011;364:2507–2516. - PMC - PubMed
    1. Shi H, et al. Acquired resistance and clonal evolution in melanoma during BRAF inhibitor therapy. Cancer Discov. 2014;4:80–93. - PMC - PubMed
    1. Boussemart L, et al. eIF4F is a nexus of resistance to anti-BRAF and anti-MEK cancer therapies. Nature. 2014;513:105–109. - PubMed
    1. Larkin J, et al. Combined vemurafenib and cobimetinib in BRAF-mutated melanoma. N. Engl. J. Med. 2014;371:1867–1876. - PubMed
    1. Long GV, et al. Increased MAPK reactivation in early resistance to dabrafenib/trametinib combination therapy of BRAF-mutant metastatic melanoma. Nat. Commun. 2014;5:5694. - PubMed

Publication types

MeSH terms

Substances