. 2017 Sep 27;15(9):e2002439.
doi: 10.1371/journal.pbio.2002439. eCollection 2017 Sep.

Dynamic patterning by the Drosophila pair-rule network reconciles long-germ and short-germ segmentation

Affiliations

Dynamic patterning by the Drosophila pair-rule network reconciles long-germ and short-germ segmentation

Erik Clark. PLoS Biol. .

Abstract

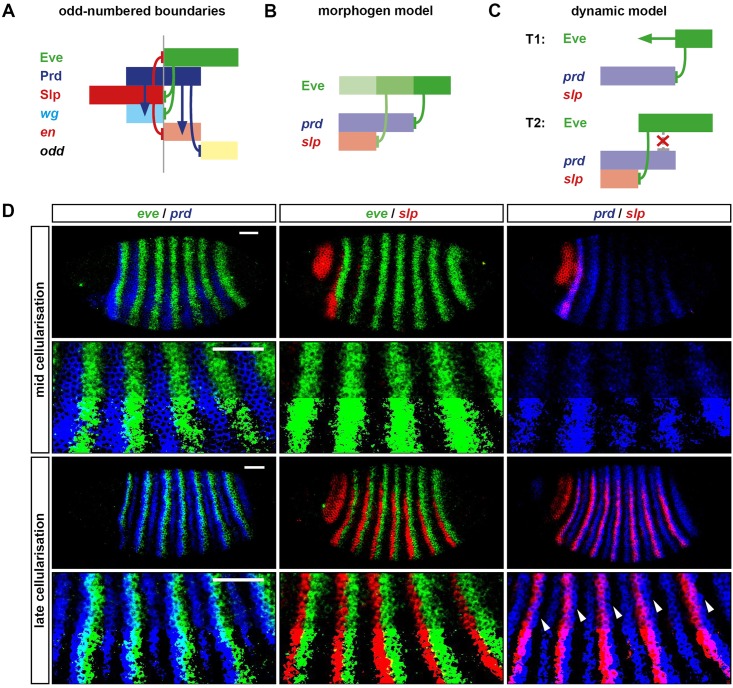
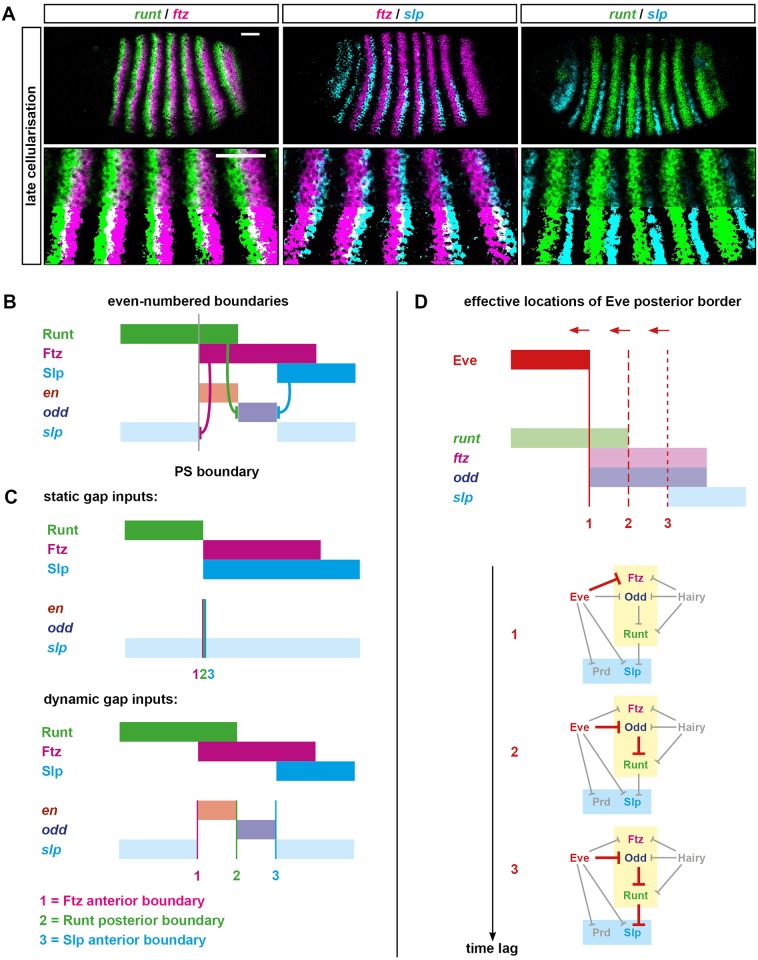
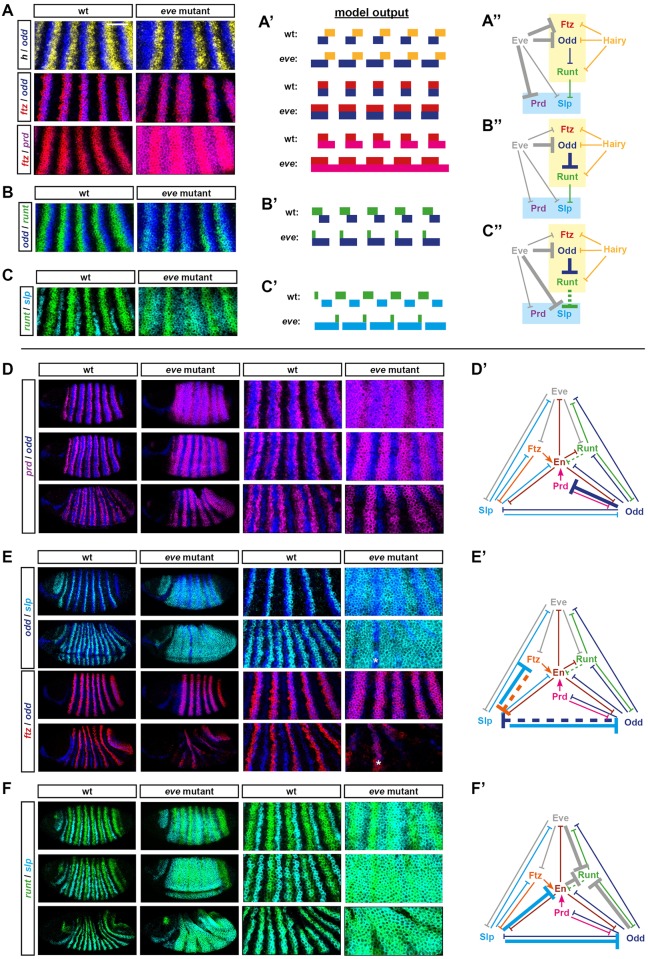
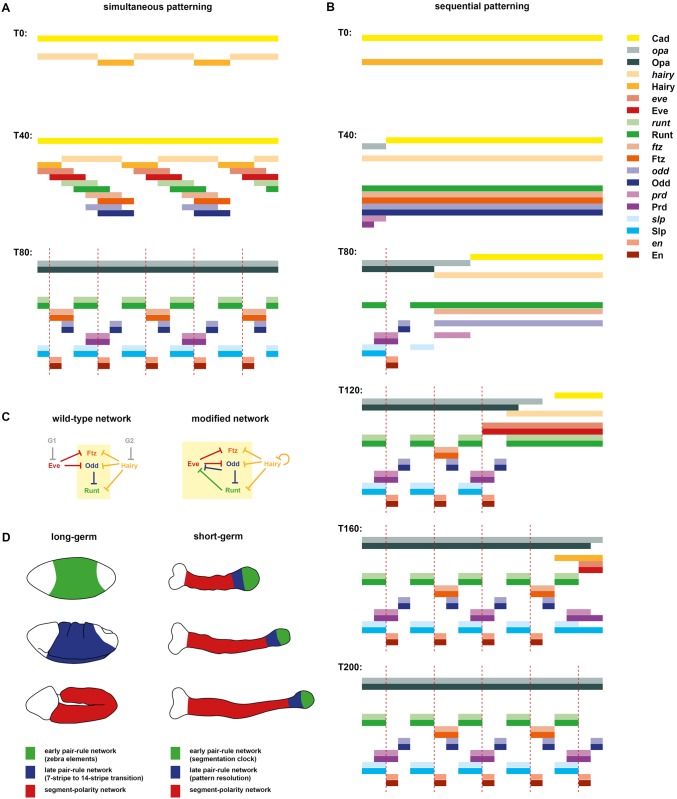
Drosophila segmentation is a well-established paradigm for developmental pattern formation. However, the later stages of segment patterning, regulated by the "pair-rule" genes, are still not well understood at the system level. Building on established genetic interactions, I construct a logical model of the Drosophila pair-rule system that takes into account the demonstrated stage-specific architecture of the pair-rule gene network. Simulation of this model can accurately recapitulate the observed spatiotemporal expression of the pair-rule genes, but only when the system is provided with dynamic "gap" inputs. This result suggests that dynamic shifts of pair-rule stripes are essential for segment patterning in the trunk and provides a functional role for observed posterior-to-anterior gap domain shifts that occur during cellularisation. The model also suggests revised patterning mechanisms for the parasegment boundaries and explains the aetiology of the even-skipped null mutant phenotype. Strikingly, a slightly modified version of the model is able to pattern segments in either simultaneous or sequential modes, depending only on initial conditions. This suggests that fundamentally similar mechanisms may underlie segmentation in short-germ and long-germ arthropods.


Conflict of interest statement

The author has declared that no competing interests exist.

Figures

Fig 1
Fig 1. Structure and patterning function of the pair-rule gene regulatory network.
(A) Cross-regulatory interactions between pair-rule genes during cellularisation (left) and gastrulation (right). Hammerhead arrows represent repression; pointed arrows represent activation. The zebra elements of ftz, odd, and runt (yellow box) turn on earlier than those of prd and slp (blue box). ftz, odd, and runt are also regulated by gap inputs through their stripe-specific elements (noted by grey dotted lines), but pair-rule inputs are the dominant influence on their patterns by mid-cellularisation (see S1 Text). The repression of En by Runt in the late network is dotted because, while the odd-numbered en stripes are sensitive to Runt, the even-numbered stripes are regulated differently [68]. Note that the regulation of runt in the late network reflects the regulatory logic of the “7-stripe” element rather than that of the “6-stripe” element [32,69]. (B) The template for polarised parasegment boundaries is formed by a repeating pattern of En, Odd, and Slp stripes. Top: whole mount double FISH images (anterior left, dorsal top) showing that en, odd, and slp are expressed in abutting, mutually exclusive domains. Middle: enlarged views of the stripes. Bottom: schematic of the overall pattern (anterior left). The grey vertical lines indicate the span of an initial pair-rule repeat relative to the final output pattern. Parasegment boundaries (dotted red lines) will form at the interface between En and Slp domains. Scale bars = 100μm. (C) Schematics indicating the number of distinct states that can be specified by static domains of Hairy and Eve expression. Top: Hairy and Eve are both Boolean variables. There are only 4 possible expression states (1: Hairy on, Eve off; 2: Hairy on, Eve on; 3: Hairy off, Eve on; 4: Hairy off, Eve off). Bottom: Hairy is still Boolean, but Eve is now a multilevel variable. Different shades of red represent different levels of Eve activity: low (lightest), medium, or high (darkest). There are now 8 different possible combined expression states of Hairy and Eve. Grey vertical lines are as in (B). (D) Rich positional information can be conveyed by a dynamic signal. Top: Boolean Eve stripes are depicted travelling from posterior to anterior over time (darker red represents a more recent time point). Middle: The Eve profile over time is recorded in binary digits. Bottom: The Eve signal can be decoded into 6 distinct expression domains, aligned with those in (B). Grey lines are as in (B). Abbreviations: en, engrailed; FISH, fluorescent in situ hybridization; ftz, fushi tarazu; odd, odd-skipped; prd, paired; slp, sloppy-paired.
Fig 2
Fig 2. Simulation output from a Boolean model of the pair-rule network.
Pair-rule gene expression patterns generated by simulating a Boolean model of the pair-rule network, assuming static “gap” inputs (A), dynamic “gap” inputs (B), or dynamic “gap” inputs and no Eve expression (C). Original simulations are shown in S9–S11 Movies. In each panel, the horizontal axis represents the anteroposterior (AP) axis (anterior left), while the vertical axis represents the different gene products that might be expressed in a given “cell” (column). Pale colours represent active transcription; dark colours represent active protein (see colour key at top right). Grey vertical lines indicate the span of an idealised double-segment repeat of 8 “cells”. The same 7 time points (T20–T56) are shown for each simulation. Cad turns off between the first (T20) and second (T26) panels (dashed lines), derepressing prd and slp. Opa turns on between the third (T32) and fourth (T38) panels (dashed lines), causing a switch from the early to the late network logic. Parasegment boundaries (black vertical lines at T56, located between abutting domains of Slp and En) are only produced by the simulation with dynamic gap inputs (B). Abbreviations: Cad, Caudal; Opa, Odd-paired; prd, paired; slp, sloppy-paired.
Fig 3
Fig 3. The “dynamic” simulation accurately recapitulates the spatiotemporal expression of the pair-rule genes.
Left: false-coloured double FISH images for selected combinations of pair-rule gene transcripts at 4 different stages. Each panel shows a lateral view of stripes 2–6 (anterior left, dorsal top). Scale bars = 50 μm (rightmost panels use a slightly lower magnification due to tissue rearrangements). Additional expression combinations are shown in S1 Fig, while uncropped views of the embryos are shown in S2 Fig. Right: simulated transcriptional output for these pairs of genes at 4 different time points (see Fig 2B). The earliest time point of the simulated expression (T20) is representative of the leftmost panels of real expression (mid-cellularisation), and so on. The simulation output is generally very similar to the real expression patterns, with 2 main differences related to the discrete nature of the simulations. (1) Real gene expression domains fade over time rather than turning off instantaneously (e.g., compare hairy in A′–A″ to the simulated hairy expression at T32/T44/T56). (2) Qualitative expression pattern changes may occur gradually between late cellularisation and early gastrulation (e.g., eve expression in B–B″/C–C″ or odd expression in C–C″/E–E″) rather than instantaneously, as between T32 and T44. (A) hairy and eve pair-rule stripes partially overlap during cellularisation. At gastrulation, hairy expression fades away, while the eve stripes narrow from the posterior and then also fade. (B) eve and ftz pair-rule stripes are at first expressed in complementary patterns. Starting from late cellularisation, they both narrow from the posterior (eve more than ftz). eve expression later fades away, while ftz persists. (C) eve and odd pair-rule stripes are at first expressed in complementary patterns before both narrowing. odd secondary stripes emerge at the posterior of the narrowing eve domains, which then fade away, leaving segmental stripes of odd. (D) runt and ftz pair-rule stripes partially overlap throughout cellularisation. At gastrulation, runt secondary stripes emerge to the posterior of the narrowing ftz stripes. Later, the runt primary stripes refine from the posterior, and the overlaps with ftz are lost. (E) The ftz and odd stripes are fairly congruent during cellularisation. At gastrulation, both narrow from the posterior, and the odd secondary stripes intercalate between them. Over the course of patterning, their anterior boundaries also become offset from one another. (F) The slp primary stripes emerge later than the runt primary stripes and are offset slightly from their posterior boundaries. (The simulated slp domains are wider than the real slp domains.) At gastrulation, secondary stripes of both genes emerge between the primary stripes (the widths of the simulated slp stripes are now appropriate). The expression patterns become largely congruent, except at the posteriors of the runt primary stripes. These differences resolve later, when the runt primary stripes narrow. (G) The slp primary stripes emerge later than the ftz primary stripes and partially overlap with them. At gastrulation, the secondary slp stripes emerge just anterior to the ftz domains, which narrow from the posterior, losing the overlaps with the slp primary stripes. (H) As for (G), the slp primary stripes partially overlap the odd primary stripes, and these overlaps are later lost by the odd stripes narrowing from the posterior. The secondary stripes of odd and slp intercalate between the primary stripes and abut one another. Abbreviations: eve, even-skipped; FISH, fluorescent in situ hybridization; ftz, fushi tarazu; odd, odd-skipped; slp, sloppy-paired.
Fig 4
Fig 4. Dynamic patterning of the primary pair-rule genes.
(A) Regulatory schematic showing the predicted phasing of the primary pair-rule stripes during cellularisation, assuming static, partially overlapping domains of Hairy and Eve. Pale colours represent transcript domains; intense colours represent protein domains; hammerhead arrows represent repressive interactions; grey vertical lines indicate the span of a double-segment pattern repeat. Cross-regulatory interactions are from the early network (compare Fig 1A, left). For simulation output, see S1 Movie. (B) Regulatory schematic showing the predicted phasing of the pair-rule stripes during cellularisation, assuming dynamic, partially overlapping domains of Hairy and Eve. hairy and eve domains shift anteriorly over time, resulting in offsets between transcript and protein domains. Colours, etc., as for (A). For simulation output, see S2 Movie. (C) Comparisons between real and predicted phasings of the primary pair-rule stripes. Double FISH images show lateral views of stripes 2–6 (anterior left, dorsal top) in mid-cellularisation stage embryos. In the bottom half of each image, the 2 channels have been thresholded, making regions of overlap easier to see. Scale = 50 μm. Diagrams to the right of each image show the stripe phasings predicted by static (top) or shifting (bottom) gap inputs, respectively (compare A and B). For panels (A) and (B), the 2 models predict the same relative pattern. In all other panels, the models predict different relative patterns. (D) Simultaneous visualisation of eve transcript (magenta) and Eve protein (green) in embryos at 4 different stages. Rightmost panels show a ventrolateral view; all other panels show lateral views. Upper panels show whole embryo views; lower panels show enlarged views of stripes 2–6. In stripes 3 onwards, the protein domains lag behind the transcript domains until late gastrulation, indicating that the anterior boundaries of the eve stripes shift anteriorly until early gastrulation. In stripe 2, the anterior boundary stabilises significantly earlier. Scale = 50 μm. Abbreviations: eve, even-skipped; FISH, fluorescent in situ hybridization.
Fig 5
Fig 5. Dynamic patterning of the odd-numbered parasegment boundaries.
(A) Regulatory schematic of gene expression at the odd-numbered parasegment boundaries. Domains of Slp, Prd, and Eve expression (dark colours) pattern segment-polarity stripes of wg, en, and odd (pale colours). Anterior left. Hammerhead arrows represent repressive interactions; pointed arrows represent activatory interactions; grey vertical line represents a prospective parasegment boundary. See S4 Fig for relevant in situ data. (B) Static, “morphogen gradient” model for the patterning of the prd and slp posterior borders by Eve. The anterior margin of the Eve stripe is graded, with higher levels of Eve protein (darker green) present more posteriorly. High Eve (dark green) is required to repress prd, but only medium Eve (medium green) is required to repress slp. Based on Fujioka et al. (1995) [30]. (C) Dynamic model for the patterning of the prd and slp posterior borders by Eve. prd is activated earlier (T1, mid-cellularisation) than slp (T2, late cellularisation). In between these time points, the anterior border of the Eve domain shifts anteriorly. The posterior border of the prd domain is patterned by Eve at T1, but the posterior border of the slp domain is patterned by Eve at T2, resulting in a more anterior location. prd is no longer repressed by Eve at T2, resulting in stable, overlapping expression of Eve and prd. (D) Double FISH images showing the relative phasing of eve (green), prd (blue), and slp (red) expression domains at mid-cellularisation and late cellularisation. Enlarged views of stripes 2–6 are shown below the whole embryo lateral views (anterior left, dorsal top). In the bottom half of each image, the 2 channels have been thresholded, making regions of overlap easier to see. At mid-cellularisation, slp is not expressed and the posterior borders of the prd stripes abut the anterior borders of the eve stripes. At late cellularisation, the posterior borders of the prd stripes overlap the anterior borders of eve stripes (note the regions that appear cyan), the posterior borders of the slp stripes sharply abut the anterior borders of the eve stripes, and the posterior borders of the slp stripes are offset anteriorly from the posterior borders of the prd stripes (arrowheads). These expression patterns are more consistent with the dynamic model (C) than the static morphogen model (B). Scale bars = 50 μm. Abbreviations: en, engrailed; eve, even-skipped; FISH, fluorescent in situ hybridization; odd, odd-skipped; prd, paired; slp, sloppy-paired; wg, wingless.
Fig 6
Fig 6. Dynamic patterning of the even-numbered parasegment boundaries.
(A) Double FISH images showing the relative expression patterns of runt, ftz, and slp at late cellularisation. Enlarged views of stripes 2–6 are shown below whole embryo lateral views (anterior left, dorsal top). In the bottom half of each enlarged image, the 2 channels have been thresholded, making regions of overlap easier to see. Scale bars = 50 μm. (B) Regulatory schematic showing the patterning of the even-numbered parasegment boundaries. At gastrulation, Runt, Ftz, and Slp are expressed in partially overlapping domains similar to their transcript expression at late cellularisation (see A). These overlapping domains provide a template for the segment-polarity stripes of en, odd, and slp: the anterior borders of the Ftz stripes define the posterior borders of the slp secondary stripes, the posterior borders of the Runt stripes define the anterior borders of the odd primary stripes, and the Slp anterior borders define the posterior borders of the odd primary stripes. The even-numbered en stripes are activated by Ftz but repressed by Odd and Slp and so are restricted to the region of overlap between Runt and Ftz, in which both odd and slp are repressed [32]. Anterior left. Hammerhead arrows represent repressive interactions; grey vertical line represents a prospective parasegment boundary. (C) Schematic explaining why the even-numbered parasegment boundaries require dynamic gap inputs in order to be patterned. Given static inputs (top panel, compare Fig 2A), the Ftz anterior boundary (1, pink vertical line), the Runt posterior boundary (2, green vertical line), and the Slp anterior boundary (3, blue vertical line) all coincide, resulting only in broad slp expression. Given dynamic inputs (bottom panel, compare Fig 2B), the 3 boundaries are each located at different anteroposterior (AP) positions (as in B), resulting in the segment-polarity pattern: slp, en, odd, slp. (D) Schematic explaining the origin of the offset boundaries of ftz, runt, and slp. Top: diagram of the relative expression of Eve, runt, ftz, odd, and slp at late cellularisation (compare A, and see T32 in Fig 2B). The solid red vertical line indicates the current position of the Eve posterior border, which coincides with the ftz anterior border (1). Dotted red vertical lines indicate previous positions of the dynamic Eve posterior border, coinciding with the runt posterior border (2) or the slp anterior border (3). Bottom: the regulatory chains responsible for patterning each of the 3 expression boundaries are highlighted in red on the early pair-rule network. All 3 boundaries trace back to Eve, but more posterior boundaries correspond to longer regulatory chains and so incur a longer time lag to resolve, given a change in Eve expression. The 3 different genes (ftz, runt, and slp) are effectively patterned by increasingly earlier incarnations of the Eve stripes, and therefore the existence of spatial offsets between boundaries 1, 2, and 3 relies on the Eve posterior border shifting anteriorly over time. Abbreviations: en, engrailed; FISH, fluorescent in situ hybridization; ftz, fushi tarazu; odd, odd-skipped; slp, sloppy-paired.
Fig 7
Fig 7. Aetiology of the eve mutant phenotype.
(A–C) “Early” effects. (A–C) Double FISH images of pair-rule gene expression in cellularisation stage wild-type and eve mutant embryos. Enlarged views of stripes 2–6 are shown (anterior left, dorsal top). Scale = 50 μm. For whole embryo views and single channel views, see S5 Fig. (A′–C′) Predicted transcriptional output of these genes from “wild-type” and “eve mutant” simulations (compare T32 in Fig 2B and 2C). (A″–C″) Regulatory interactions relevant to the aberrant expression patterns in eve mutants are highlighted on the early pair-rule network (bold arrows). Eve and its regulatory effects, which are absent from the mutant embryos, are shown in grey. (A) Eve normally represses ftz, odd, and prd. In eve mutant embryos, all 3 genes are ectopically expressed: the ftz and odd stripes expand anteriorly, and prd is expressed ubiquitously rather than in stripes. These expression changes are recapitulated by the simulation. (B) Eve normally indirectly regulates runt expression by repressing its repressor, Odd. In eve mutant embryos, odd expression expands anteriorly (see A), resulting in a down-regulation of the runt stripes, except at their anterior margins (S5 Fig). This effect is recapitulated in a discrete manner by the simulation. (C) Eve normally regulates slp in 2 ways: (1) by repressing it directly, and (2) by repressing it indirectly via indirectly maintaining the expression of its repressor, Runt (see B), via direct repression of odd (see A). In eve mutant embryos, slp is expressed fairly ubiquitously rather than in narrow stripes. This expansion is evident in the simulated expression, but see legend of S5 Fig for discussion of differences between the real and simulated patterns. (D–F) “Late” effects. Double FISH images of pair-rule gene expression in wild-type and eve mutant embryos over the course of gastrulation. For each set of images, each row compares a wild-type and a mutant embryo of roughly equal age (age increases from top to bottom). Both whole embryo views (anterior left, dorsal top) and enlarged views of stripes 2–6 are shown. For single channel views, see S5 Fig. (D′–F′) Regulatory interactions that explain the observed pattern maturation are highlighted on the late network (bold arrows). (D) Odd represses prd in the late network, and so prd expression is lost from cells in which odd and prd expression initially overlap. In wild-type embryos, the odd primary stripes overlap the centres of the prd pair-rule stripes, which therefore split in two. In eve mutant embryos, broad odd stripes are overlain on initially aperiodic prd expression, which therefore resolves into a pair-rule pattern. (E) There is mutual repression between Slp and Ftz/Odd in the late network (E′). (Note that the repression from Slp appears to be stronger than the reciprocal repression from Ftz and Odd.) In wild-type embryos, Slp causes the primary stripes of both odd and ftz to narrow from the posterior (where they overlap the slp primary stripes). In eve mutant embryos, Slp is broadly expressed, causing general repression of odd and ftz. Note that expression of both odd and ftz persists in stripe 3 (asterisks), in which there is a corresponding gap in the slp expression domain. (F) In the late network, slp and runt are regulated similarly, and Slp represses all of the repressors of runt (i.e., eve, odd, and en). Consequently, runt and slp take on almost identical expression patterns. In wild-type embryos, the 2 genes become expressed in coincident segmental stripes. In eve mutant embryos, early broad expression of slp allows runt to also become ubiquitously expressed. Note that the slp domain later resolves into a pair-rule pattern (perhaps due to repression from residual Ftz protein). Abbreviations: en, engrailed; eve, even-skipped; FISH, fluorescent in situ hybridization; ftz, fushi tarazu; odd, odd-skipped; prd, paired; slp, sloppy-paired.
Fig 8
Fig 8. A slightly modified pair-rule network can pattern segments in both simultaneous and sequential modes.
(A,B) Simulation output for the modified network. Each panel shows the system state at a specific time point between T0 and T200 (see S12 and S13 Movies for complete output). In each panel, the horizontal axis represents a region of the anteroposterior (AP) axis (anterior left) and the vertical axis represents the different gene products that might be expressed in a given “cell” (individual columns C1 to C20). Pale colours represent active transcription; dark colours represent protein activity (see colour key at top right). Dotted red lines indicate parasegment boundaries. (A) The system is initialised with uniform expression of Cad and a periodic phase gradient of Hairy expression (protein or transcript “age” increases from posterior to anterior, and the pattern repeats every 8 cells—see S2 Text for details). Given these starting conditions, the dynamical behaviour of the system is almost identical to the unmodified network (compare Fig 2B or S10 Movie). Note, however, that hairy transcript is always out of phase with Hairy protein. (B) The system is initialised with uniform expression of Hairy but a decay gradient of Cad (protein disappears from anterior to posterior over time). Given these altered starting conditions, the system behaves differently and patterning takes longer, but the same stable segmental pattern eventually emerges. Note that in this simulation, the primary pair-rule genes continuously oscillate within cells that do not express Opa, and segmental stripes emerge progressively from anterior to posterior as Opa turns on along the AP axis. (C) Comparison of the original (left) and modified (right) early networks. For simplicity, the secondary pair-rule genes are not shown. See text for details. (D) Proposed regulatory homology between phases of segmentation gene expression in long-germ embryos (left) and short-germ embryos (right). In Drosophila, the quintessential long-germ insect, there are 3 main phases of segment patterning during embryogenesis. During cellularisation (top), most pair-rule genes are regulated via zebra elements and become expressed in periodic patterns throughout the trunk of the embryo (green region). During gastrulation (middle), segmental patterns of pair-rule genes and segment-polarity genes emerge throughout the trunk (blue region) fairly simultaneously. Finally, during germ band extension (bottom), the segment-polarity network maintains the segment pattern via intercellular signalling throughout the trunk (red region). In short-germ embryos, for example, those of the red flour beetle Tribolium castaneum, segment patterning occurs continuously throughout germ band extension. Three germ bands of increasing age are depicted: the trunk elongates from the posterior as embryogenesis proceeds. Throughout the whole process, primary pair-rule genes exhibit oscillatory expression in the posterior segment addition zone (green regions). Pair-rule stripes then resolve (and may undergo frequency doubling) in the anterior segment addition zone (blue region). Finally, segment-polarity genes are expressed in segmental stripes starting just anterior to the segment addition zone (red regions). This phase of expression is thought to be regulated by a conserved signalling network [105,106]. Abbreviations: Cad, Caudal; Opa, Odd-paired.

Similar articles

Cited by

References

    1. Akam M. The molecular basis for metameric pattern in the Drosophila embryo. Development. 1987;101:1–22. - PubMed
    1. Nasiadka A, Dietrich BH, Krause HM. Anterior—posterior patterning in the Drosophila embryo. Adv Dev Biol Biochem. 2002;12:155–204.
    1. Nüsslein-Volhard C, Wieschaus E. Mutations affecting segment number and polarity in Drosophila. Nature. 1980;287:795–801. - PubMed
    1. Wieschaus E, Nüsslein-Volhard C. The Heidelberg Screen for Pattern Mutants of Drosophila : A Personal Account. Annu Rev Cell Dev Biol. 2016;32:1–46. doi: 10.1146/annurev-cellbio-113015-023138 - DOI - PubMed
    1. Arnosti DN. Analysis and function of transcriptional regulatory elements: insights from Drosophila. Annu Rev Entomol. 2003;48:579–602. doi: 10.1146/annurev.ento.48.091801.112749 - DOI - PubMed

Substances