. 2017 Sep 26;20(13):3223-3235.
doi: 10.1016/j.celrep.2017.09.007.

Controlling Depth of Cellular Quiescence by an Rb-E2F Network Switch

Affiliations

Controlling Depth of Cellular Quiescence by an Rb-E2F Network Switch

Jungeun Sarah Kwon et al. Cell Rep. .

Abstract

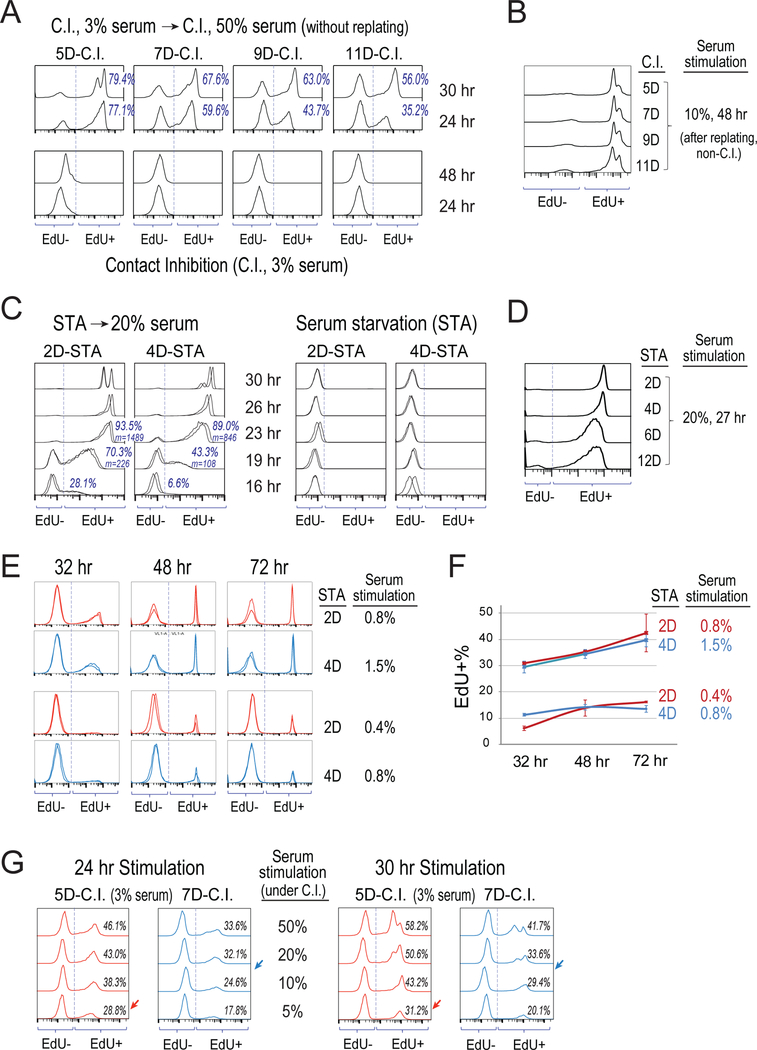
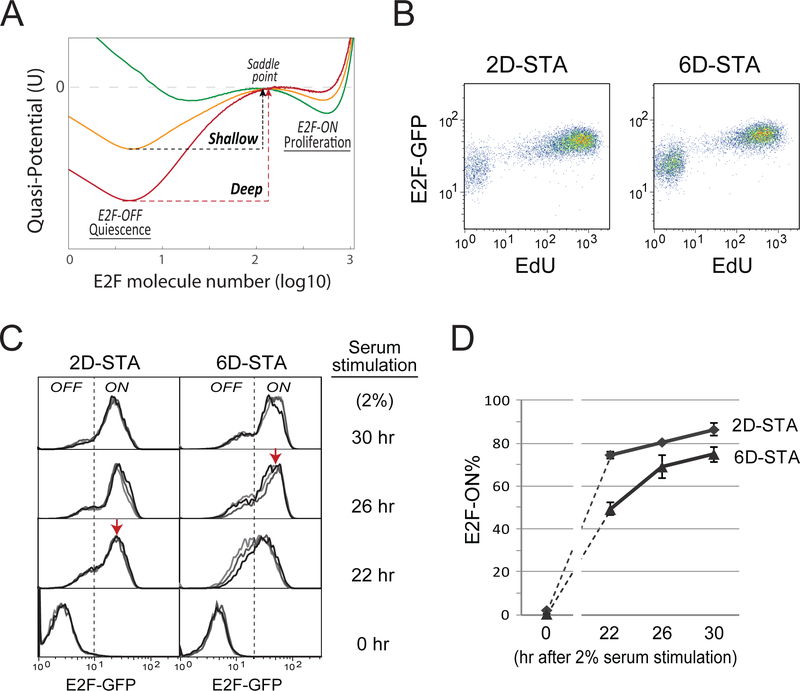
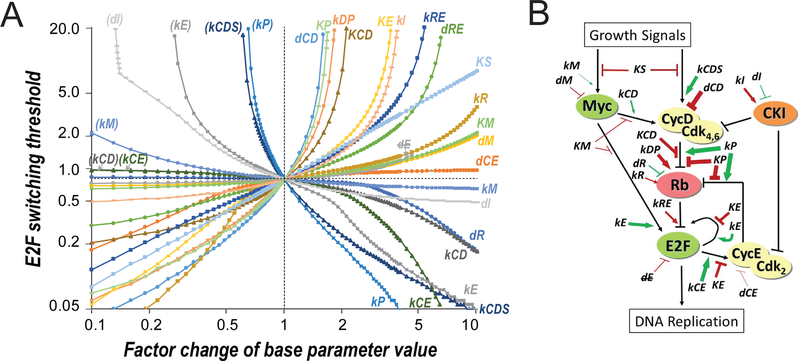
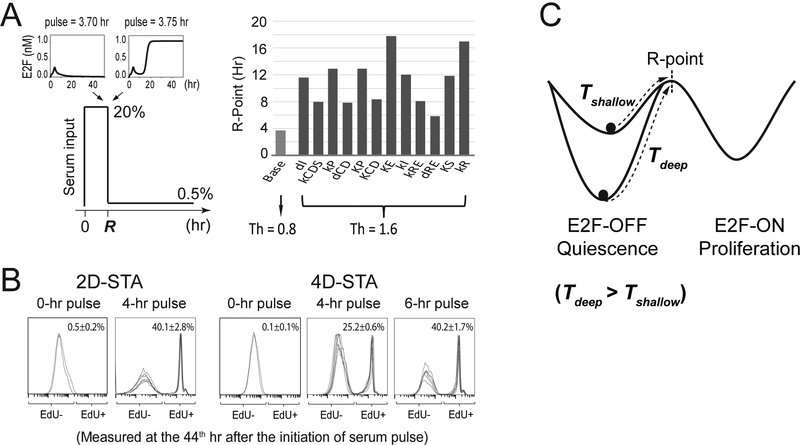
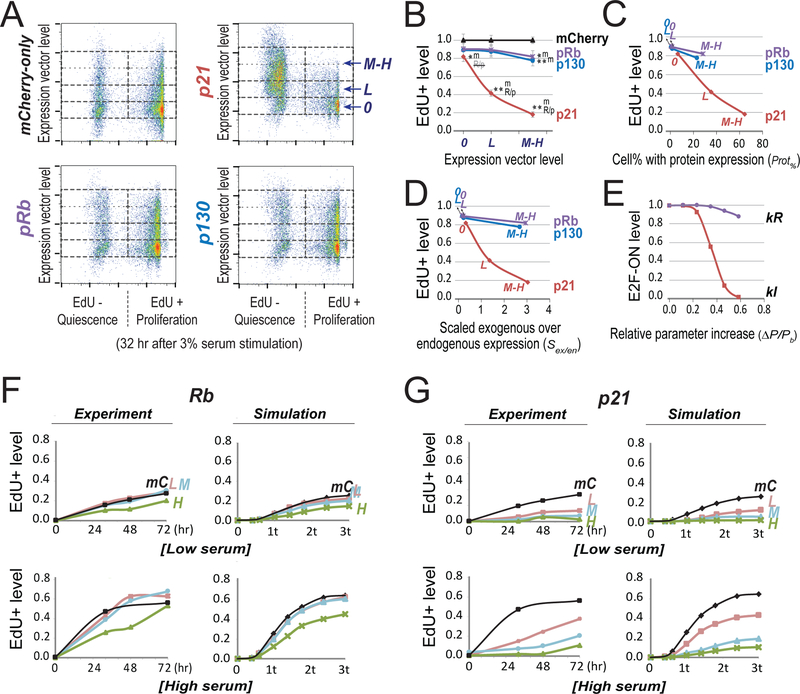
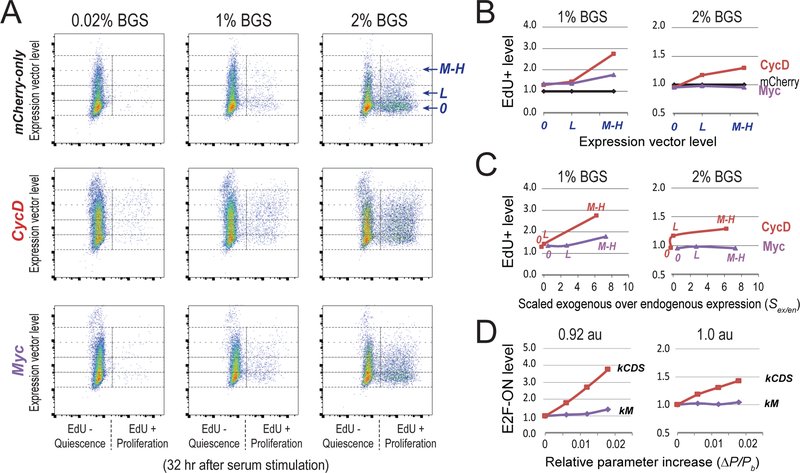
Quiescence is a non-proliferative cellular state that is critical to tissue repair and regeneration. Although often described as the G0 phase, quiescence is not a single homogeneous state. As cells remain quiescent for longer durations, they move progressively deeper and display a reduced sensitivity to growth signals. Deep quiescent cells, unlike senescent cells, can still re-enter the cell cycle under physiological conditions. Mechanisms controlling quiescence depth are poorly understood, representing a currently underappreciated layer of complexity in growth control. Here, we show that the activation threshold of a Retinoblastoma (Rb)-E2F network switch controls quiescence depth. Particularly, deeper quiescent cells feature a higher E2F-switching threshold and exhibit a delayed traverse through the restriction point (R-point). We further show that different components of the Rb-E2F network can be experimentally perturbed, following computer model predictions, to coarse- or fine-tune the E2F-switching threshold and drive cells into varying quiescence depths.

Keywords: Rb-E2F pathway; activation threshold; bistable switch; cell cycle entry; cell growth; cell proliferation; cellular quiescence; model simulation; quiescence depth; quiescence heterogeneity.


Figures

Figure 1.
Figure 1.. Measure dynamic features of deep vs. shallow quiescence.
(A-G) S-phase entry following serum stimulation of quiescent cells. Cells were induced to quiescence by contact inhibition (seeded at 3× normal confluency in 3% serum) for 5–11 days (A,B,G) or serum starvation (cultured in 0.02% serum) for 2–12 days (C-F). At time 0, cells were stimulated with higher concentrations of serum as indicated or remained non-stimulated (C.I. control in A, and STA control in C), and with EdU added to the culture medium. Cells were harvested at indicated time points afterwards and measured for their incorporated EdU intensity by flow cytometry. Each histogram represents the distribution of EdU intensity (x-axis) from approximately 10,000 cells, with y-axis = cell number with the height of the (higher) mode normalized to 100%. For serum stimulation of C.I. cells, cells were either stimulated directly while remained at the C.I. condition (A,G) or first replated at a non-C.I. condition prior to serum stimulation (B), as indicated. (A,C) Percentage of EdU+ cells are shown; m = mean EdU intensity of EdU+ cells. Results from duplicate EdU assays are shown in C for each condition. (E,F) Cell division was restricted by low dose of nocodazole at the time of assay (see Methods). Percentages (mean ± s.e.m.) of EdU+ cells calculated in E (duplicates) are shown in F.
Figure 2.
Figure 2.. Rb-E2F bistable switch underlies quiescence depth.
(A) E2F quasi-potential landscape and quiescence depth. For each landscape curve, potential values (y-axis) corresponding to given E2F molecule numbers (x-axis) were calculated based on stochastic simulations of the Rb-E2F bistable switch model (see Methods). The three quasipotential curves correspond to three different kI parameter values (kI = 0.15, 0.17, and 0.21 for green, orange, and red curves, respectively; serum concentration = 0.65). The E2F-OFF and E2F-ON states correspond to the E2F molecule numbers at the left and right potential troughs in each curve. Potential barrier for E2F activation ΔP = psaddlepE2F (psaddle and PE2FOFF: the potential peak and trough corresponding to the saddle point and E2F-OFF state, respectively). Deep and shallow quiescent states have relatively higher and lower ΔP. (B) Single-cell correlation between the OFF/ON state of the Rb-E2F switch and cell quiescence/proliferation. REF/E23 cells containing a stably integrated E2F-GFP reporter were serum starved for 2 or 6 days and subsequently stimulated with 20% serum. EdU was added to culture medium at the start of serum stimulation and cells were harvested for EdU assay 26 hours later. Each dot shows the E2F-GFP reporter activity (y-axis) and the incorporated EdU level (x-axis) of a single cell. To recover the GFP signal quenched by the Click-iT EdU reaction, the E2F-GFP activity was measured indirectly using a fluorescein-conjugated GFP antibody (see Methods). (C,D) E2Factivity time courses. (C) Quiescent cells obtained by serum starvation for 2 or 6 days were stimulated with 2% serum. Cells were harvested at indicated time points after serum stimulation and measured for E2F-GFP reporter levels (triplicates). Each histogram represents the E2F-GFP distribution from approximately 10,000 cells (y-axis, the same as Figure 1). Dotted vertical lines indicate the separation between E2F-OFF and E2F-ON cells, which slightly shifted to the right in 6D- vs. 2D-STA cells due to increased auto fluorescence in cells under longer-term serum starvation. Red arrows indicate the fully-ON level of the E2F-GFP reporter. (D) Percentage (mean ± s.e.m.) of E2F-ON cells, calculated from corresponding E2F distributions in C. The dash lines between 0 and 22 hr data points are for the guide of eyes.
Figure 3.
Figure 3.. In silico modulators of the E2F switching threshold.
(A) Parameter-sensitivity curves. X-axis = factor change of parameter value. Y-axis = E2F switching threshold (% serum). Both axes are in logarithmic scale. Parameters in parenthesis = repeated parameter labels of those in the lower right quadrant. dE indicates that dE was not considered as a sensitive parameter as increasing its value diminished the separation of E2F-ON and -OFF states (to < 10% of that in the base model) before affecting the E2F switching threshold significantly (i.e., with a factor change > 2.5). Parameter changes resulting in a higher E2F switching threshold (top half) also caused delayed E2F activation upon serum stimulation (see Figures S1A and S1B). (B) Modulators of the E2F switching threshold. Modulators (sensitive parameters) are labelled at their effective positions in the Rb-E2F pathway network. Green and red = increasing the parameter value decreased and increased the E2F switching threshold, respectively. Arrow and bar = increasing the parameter value positively and negatively affected the strength of the pointed node/link, respectively. Thickness of arrow/bar = parameter sensitivity when increasing the parameter value, as determined in the right half of A.
Figure 4.
Figure 4.. Deep quiescent cells exhibit delayed passing of the R-point.
(A) Simulated traverse time of the R-point. (Left) Model simulation scheme to determine the time to traverse the R-point (R), which corresponds to the shortest duration of a given serum stimulation (20%) required to activate and sustain the ON-state of the Rb-E2F bistable switch. When the serum duration is shorter than R (upper left inset), the final E2F level will return to the OFF state after the serum input is reduced to a basal level (0.5%); otherwise, the final E2F level will reach and remain at the ON state, even after the serum input is reduced to the same basal level (upper right inset). (Right) Simulated R traverse time (according to the scheme on the left) in the base model (E2F switching threshold Th = 0.8) and with parameter “mutations” that doubled the E2F switching threshold (Th = 1.6). The order of parameters is the same as shown in the top half of Figure 3A. Parameter mutations resulting in Rb-E2F deactivation threshold > 0.5% are not shown. See also Figures S1C and S1D (for deterministic simulation) and Table S3 (for stochastic simulation). (B) Experimentally measured quiescence exit after short serum pulses. Quiescent cells obtained by serum starvation for 2 or 4 days were stimulated with strong serum pulses (20%, at indicated durations), followed by incubation at a basal serum level (0.3%). Cells were harvested at the 44th hour after serum stimulation and measured for EdU incorporation (six replicates in 4- or 6-hr pulse groups and duplicates in 0-hr pulse control groups). Each histogram represents the distribution of EdU intensity from approximately 10,000 cells (y-axis, the same as Figure 1). Cell division was restricted by low dose of nocodazole at the time of assay (see Methods). (C) Time to traverse the R-point is dependent on quiescence depth. Following a given serum stimulation, the time to reach the R-point from deep quiescence (Tdeep) is longer than that from shallow quiescence (Tshallow).
Figure 5.
Figure 5.. Experimentally create deep quiescence by increasing E2F switching threshold with Cdk inhibitor p21 and Rb family proteins.
(A) Quiescence exit affected by ectopic expression of p21, pRb and p130. Quiescent cells (2D-STA) containing transfected expression vectors were switched to media containing 3% BGS and EdU, and harvested 32 hours later for EdU incorporation assay. Cell division was restricted by low dose of nocodazole at the time of assay (see Methods). Y-axis = levels of the introduced expression vector in individual cells (indicated by the fluorescence intensity associated with the co-transfected mCherry vector; see also Figure S2). 0, L, and M-H = cell bins of non-transfected, with low and medium-high level of introduced expression vector, respectively. X-axis = EdU-incorporation intensity. (B) Quiescence-exit (EdU+) cell proportion (y-axis) as a function of expression vector level (x-axis). The EdU+ proportion was calculated from six replicate experiments as in A (with the average EdU+% at each expression vector level normalized to that of the mCherry-only control, see Table S4). Single and double star signs (* and **) indicate statistical significance (p < 0.01 and p < 0.001, respectively) in one-sided t-test comparing the data point by the star sign and the text-indicated data point (m, mCherry; R/p, pRb/p130). R/p, the difference from R/p is not statistically significant. Error bar, standard error of the mean. (C,D) Introduced expression vector levels (0, L, M-H) were converted to cell percentages with positive ectopic protein expression (C) and estimated exogenous protein levels (normalized by endogenous expression, D), respectively, as measured by immunoflow cytometry (see Figure S3 for detail). High ectopic p21 expression in quiescence did not cause irreversible arrest (see Figure S4). (E) Simulated quiescence exit affected by parameter changes. X-axis = relative parameter increase (Δ P/Pb = (P-Pb)/Pb, with P = parameter value and Pb = base value). Y-axis = proportion of cells that were able to turn ON the Rb-E2F switch given a parameter change, calculated from 2,000 stochastic simulations. The cell proportion corresponding to the base parameter was normalized to 1.0. Serum input = 1.2 au (au = activation unit; 1 au = 0.78, the E2F switching threshold in the base model). kR and kI, synthesis rate constants of Rb and p21, respectively. (F,G) Time course of quiescence-exit profiles. (Experiment) The EdU+ cell proportions with exogenously expressed pRb (F) or p21 (G) were measured at indicated time points upon serum stimulation of quiescent cells (2D-STA). Low and high serum = 0.8% and 3.0%, respectively. Cell division was restricted by low dose of nocodazole at the time of assay (see Methods). L, M, H: the same as in A; mC = mCherry-only control. (Simulation) E2F-ON cell proportions were calculated at indicated time points (t = model-time unit of 50 hours) upon serum input (low and high serum = 0.96 and 1.01 au, respectively). Each data point reflects the result of 2,000 stochastic simulations. L, M, H for Rb (F): kR = 0.182, 0.184, 0.19, respectively. L, M, H for p21 (G): kI = 0.158, 0.167, 0.171, respectively. mC: kR = 0.18, kI = 0.15.
Figure 6.
Figure 6.. Experimentally create shallow quiescence by decreasing E2F switching threshold with CycD and Myc.
(A) Quiescence exit affected by ectopic expression of CycD and Myc. Quiescent cells (2D-STA) containing transfected expression vectors were switched to fresh media containing serum at the indicated concentrations and EdU, and harvested 24 hours later for EdU incorporation assay. Y-axis = levels of the introduced expression vector in individual cells (as in Figure 5A). 0, L, and M-H = cell bins of non-transfected, with low and medium-high level of introduced expression vector, respectively. X-axis = EdU-incorporation intensity. (B) Quiescence-exit (EdU+) cell proportion (y-axis) as a function of expression vector level (x-axis). The EdU+ proportion was calculated from A for each expression vector level, and normalized to that of the mCherry-only control. (C) Expression vector levels in B were converted to estimated exogenous protein levels (normalized by endogenous expression) as measured by immunoflow cytometry (see Figure S5 for detail). Labels of 0, L, M-H in each curve correspond to the levels of introduced expression vectors. (D) Model simulated quiescence exit affected by parameter changes. X-axis = relative parameter increase, Y-axis = simulated proportion of cells that were able to turn ON the Rb-E2F switch given a parameter change, as in Figure 5E. The cell proportion corresponding to the base parameter was normalized to 1.0. Serum input = 0.92 and 1.0 au (for 1% and 2% BGS), respectively. kCDS and kM, synthesis rate constants of CycD and Myc, respectively.

Similar articles

Cited by

References

    1. Adelman RC, Stein G, Roth GS, and Englander D (1972). Age-dependent regulation of mammalian DNA synthesis and cell proliferation In vivo. Mechanisms of Ageing and Development 1, 49–59.
    1. Aguda BD (2015). Cell Cycle Control: The Restriction Point. eLS 1, 5.
    1. Alcorta DA, Xiong Y, Phelps D, Hannon G, Beach D, and Barrett JC (1996). Involvement of the cyclin-dependent kinase inhibitor p16 (INK4a) in replicative senescence of normal human fibroblasts. Proc Natl Acad Sci U S A 93, 13742–13747. - PMC - PubMed
    1. Ao P (2004). Potential in stochastic differential equations: novel construction. J Phys a-Math Gen 37, L25–L30.
    1. Attwooll C, Lazzerini Denchi E, and Helin K (2004). The E2F family: specific functions and overlapping interests. EMBO J 23, 4709–4716. - PMC - PubMed

Substances

LinkOut - more resources