. 2017 Nov 21;37(6):BSR20171039.
doi: 10.1042/BSR20171039. Print 2017 Dec 22.

Dysregulation of POPDC1 promotes breast cancer cell migration and proliferation

Affiliations

Dysregulation of POPDC1 promotes breast cancer cell migration and proliferation

Johanna Ndamwena Amunjela et al. Biosci Rep. .

Abstract

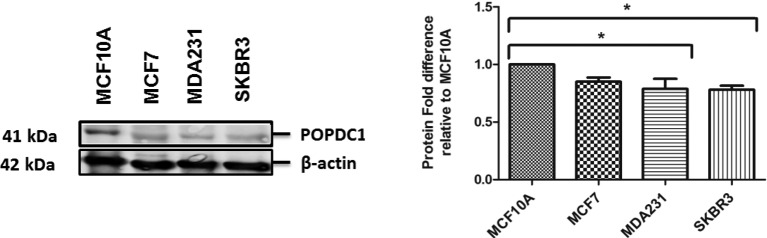
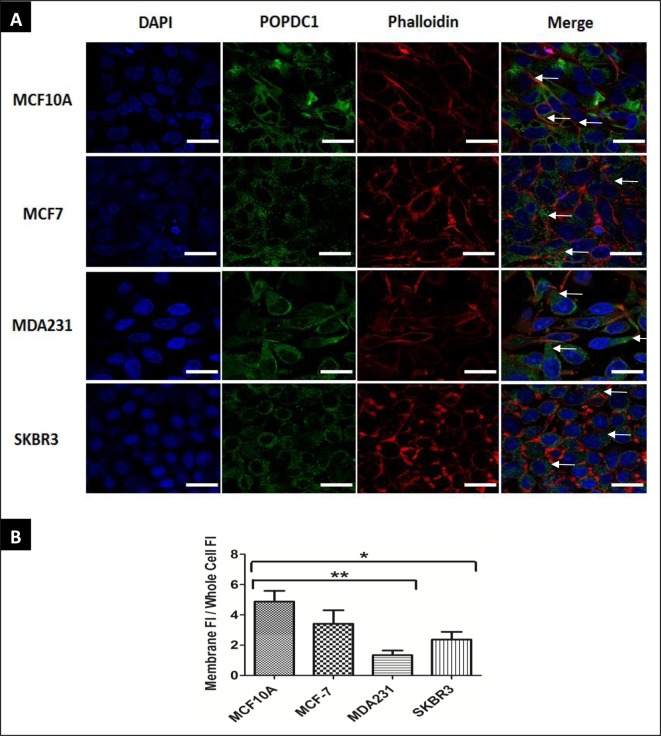
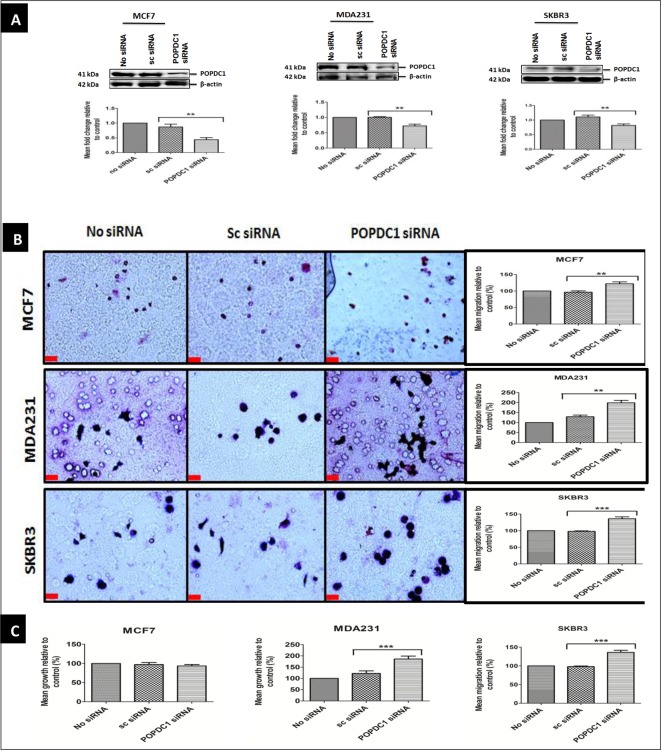
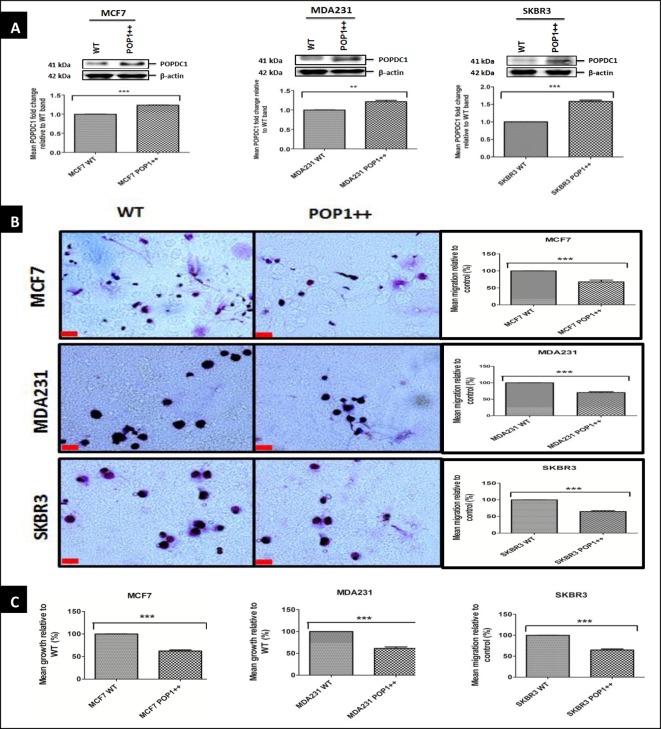
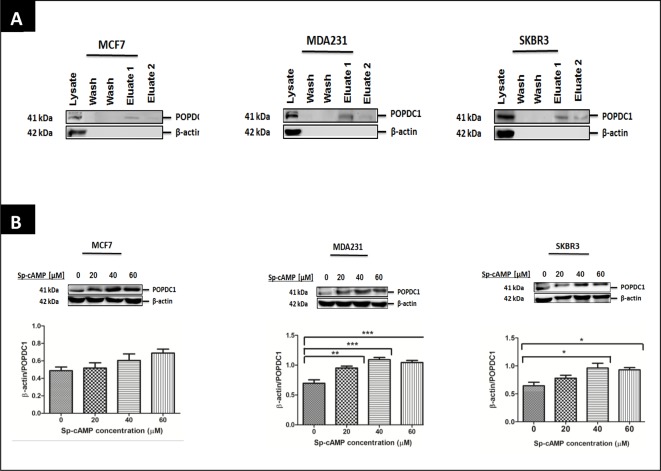
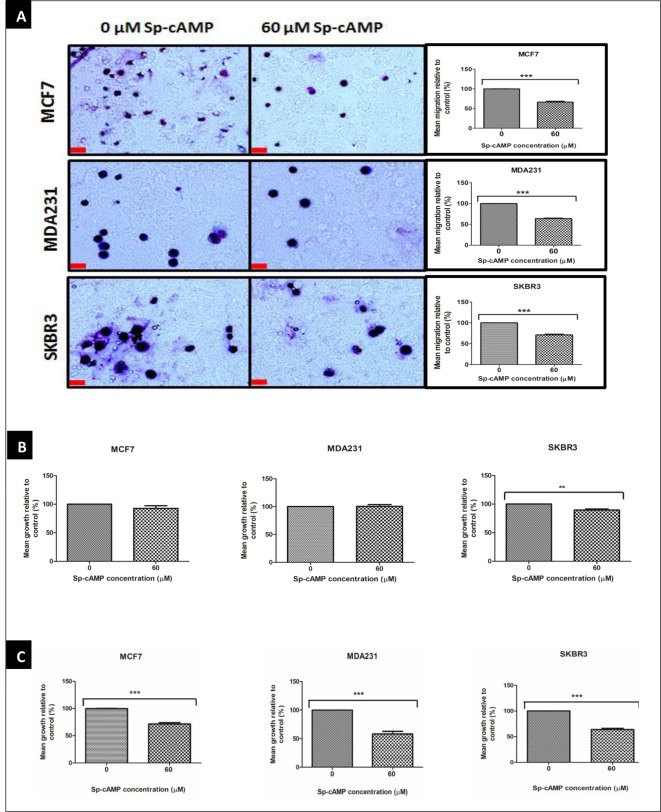
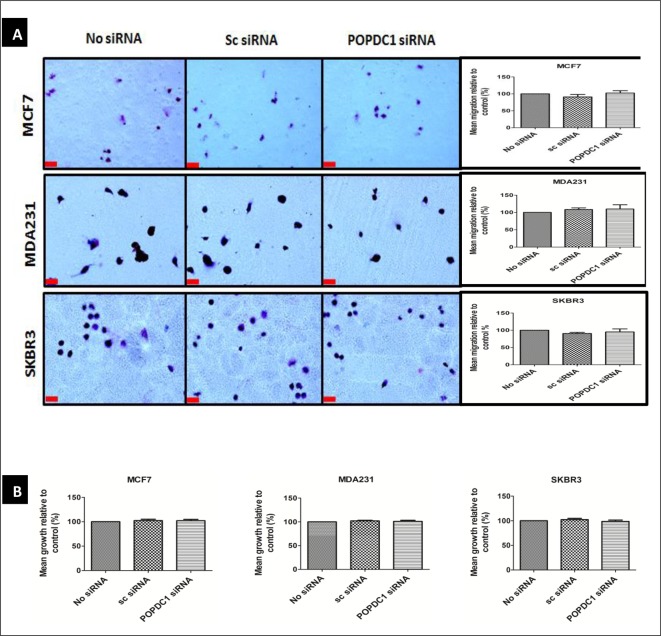
Breast cancer subtypes such as triple-negative that lack the expression of oestrogen receptor (ER), progesterone receptor (PR) and human epidermal growth factor 2 receptor (HER2), remain poorly clinically managed due to a lack of therapeutic targets. This necessitates identification and validation of novel targets. Suppression of Popeye domain-containing protein 1 (POPDC1) is known to promote tumorigenesis and correlate to poor clinical outcomes in various cancers, and also promotes cardiac and skeletal muscle pathologies. It remains to be established whether POPDC1 is dysregulated in breast cancer, and whether overcoming the dysregulation of POPDC1 could present a potential therapeutic strategy to inhibit breast tumorigenesis. We assessed the potential of POPDC1 as a novel target for inhibiting breast cancer cell migration and proliferation. POPDC1 was significantly suppressed with reduced cell membrane localization in breast cancer cells. Furthermore, functional suppression of POPDC1 promoted breast cancer cell migration and proliferation, which were inhibited by POPDC1 overexpression. Finally, cAMP interacts with POPDC1 and up-regulates its expression in breast cancer cells. These findings suggest that POPDC1 plays a role in breast tumorigenesis and represents a potential therapeutic target or biomarker in breast cancer medicine.

Keywords: POPDC1; breast cancer; cAMP; cell migration; cell proliferation.


Conflict of interest statement

The authors declare that there are no competing interests associated with the manuscript.

Figures

Figure 1
Figure 1. POPDC1 is suppressed in breast cancer cells
Western blot analysis of POPDC1 expression in breast cell lines. POPDC1 is expressed at lower levels in malignant MDA231 and SKBR3 cells in comparison with non-malignant MCF10A breast cells (n=3). Graph represents densitometric quantification of protein bands. Protein bands were normalized by calculating the POPDC1/β-actin ratio. Normalized ratios for each cell line were expressed as a ratio relative to MCF10A to show protein fold differences for each cell line relative to the MCF10A cells. Comparisons of protein fold ratios were conducted using ANOVA with Dunnett’s post hoc test; *P≤0.05.
Figure 2
Figure 2. POPDC1 membrane localization is reduced in cancer cells
(A) Cell membrane expression of POPDC1 is reduced in breast cancer cell lines. Immunocytochemical analysis of cell membrane expression of POPDC1 in breast cancer cells. Cells were counterstained with CF-555 Phalloidin (red) for visualization of filamentous actin on the cytoskeleton and nuclear probe DAPI (blue). In MCF10A non-malignant cells, regions of high POPDC1 (green) localization on the plasma membrane (white arrows) are observed. Plasma membrane expression of POPDC1 is reduced in MDA231 and SKBR3 cells (white arrows indicate POPDC1 located in other cellular locations in these images); scale bars = 20 µm. (B) Quantitative analysis of the membrane expression of POPDC1 in different cell lines. Membrane POPDC1 fluorescence intensity per μm2 was measured for individual cells along with fluorescence intensity per μm2 across the whole cell. This was then converted to a ratio of fluorescence intensity in the membrane/fluorescence intensity across the entire cell. Membrane expression of POPDC1 is significantly reduced in MDA231 and SKBR3 cells compared with non-malignant MCF10A cells (n=4). Comparisons were conducted using ANOVA with Dunnett’s; *P≤0.05, **P≤0.01.Data are presented as mean ratio ± SEM.
Figure 3
Figure 3. Suppression of POPDC1 promotes cell migration and proliferation in breast cancer cells
(A) Western blot analysis of POPDC1 expression following transfection with POPDC1 siRNA confirmed POPDC1 suppression in MCF7 (n=3), MDA231 (n=3) and SKBR3 (n=3) cells. Graphs below image panels represent densitometric quantification of protein bands. Protein bands were normalized by calculating the POPDC1/β-actin ratio. Normalized ratios were subsequently expressed as a ratio relative to control bands (no siRNA) to determine protein fold changes. (B) Suppression of POPDC1 with POPDC1 siRNA significantly promoted cell migration in MCF7 (n=5), MDA231 cells (n=5) and SKBR3 cells (n=5). Boyden chamber assay was performed over a 3-h incubation period to allow cell migration across the polycarbonate membrane; scale bars = 250 μm. (C) Suppression of POPDC1 with POPDC1 siRNA significantly promoted cell proliferation in MDA231 cells (n=5) and SKBR3 cells (n=5), but not in MCF7 cells (n=4). Cells were transfected for 36 h prior to overnight starvation in serum-free medium and subsequent incubation in 10% AlamarBlue® dye for 4 h. Comparisons of protein fold change ratios, mean % migration and mean % proliferation were conducted using ANOVA with Dunnett’s post hoc test. Mean values presented ± SEM; **P≤0.01, ***P≤0.001.
Figure 4
Figure 4. Overexpression of POPDC1 suppresses breast cancer cell migration and proliferation
(A) Western blot analysis of POPDC1 expression in wild-type cells and cell lines stably transfected with POPDC1; MCF7 POP1++, MDA231 POP1++ and SKBR3 POP1++. Stably transfected cell lines expressed significantly higher levels of POPDC1 MCF7 (n=4), MDA231 (n=4) and SKBR3 (n=4). Graphs below Western blot band panels represent densitometric quantification of protein bands. Protein bands were normalized by calculating the POPDC1/β-actin ratio. Fold differences in protein expression were calculated by expressing normalized band values of POPDC1 overexpressing cell lines as a ratio to normalized band values of wild-type cell lines. (B) Overexpression of POPDC1 significantly suppressed cell migration in MCF7 cells (n=4), MDA231 (n=5) and SKBR3 cells (n=5). Boyden chamber assay was performed over a 3-h incubation period to allow cell migration across the polycarbonate membrane; scale bars = 250 μm. (C) Overexpression of POPDC1 significantly suppressed cell proliferation in MCF7 cells (n=4), MDA231 cells (n=5) and SKBR3 cells (n=5). Cells were starved in serum-free medium overnight prior to incubation in 10% AlamarBlue® dye for 4 h. Comparisons of protein fold change ratios, mean % migration and mean % proliferation were conducted using an unpaired t-test. Mean values presented ± SEM; **P≤0.01, ***P≤0.001.
Figure 5
Figure 5. cAMP interacts with POPDC1 and up-regulates its expression in breast cancer cells
(A) Western blot analyses of cAMP agarose pull-down assays in MCF7, MDA231 and SKBR3 cells. POPDC1 was detected at high levels in the first eluted fraction (eluate 1) and at very low levels in the second eluted fraction (eluate 2) in MCF7 (n=3), MDA231 (n=3) and SKBR3 (n=3) cells confirming protein interaction between POPDC1 and cAMP. β-Actin, the negative control, was detected in the unbound protein fraction but not in the eluted fractions, confirming specificity of the assay. (B) Western blot analysis of the effects of 20, 40 and 60 µM Sp-8-Br-cAMPS on the expression of POPDC1 and CREB following 1 h treatment duration in MCF7 (n=3), MDA231 (n=3) and SKBR3 (n=3) cells. Graphs below Western blot band panels represent densitometric quantification of POPDC1 bands as a ratio to corresponding β-actin bands. Comparisons of normalized β-actin/POPDC1 ratios were conducted using ANOVA with Dunnett’s post hoc test. Mean values presented ± SEM; *P≤0.05, **P≤0.01, ***P≤0.001.
Figure 6
Figure 6. Sp-8-Br-cAMPS inhibits cell migration and proliferation in breast cancer cell lines
(A) Boyden chamber assay analysis of the effects of 60 µM Sp-8-Br-cAMPS on breast cancer cell migration in MCF7 (n=4), MDA231 (n=4) and SKBR3 (n=4) cells. Boyden chamber assay was performed over a 3-h incubation period to allow cell migration across the polycarbonate membrane; scale bars = 250 μm. (B) Alamar Blue assay analysis of the effects of 60 µM Sp-8-Br-cAMPS on MCF7 (n=4), MDA231 (n=4) and SKBR3 (n=4) cell proliferation. Cells were starved in serum-free medium overnight prior to drug treatment. (C) Alamar Blue assay analysis of the effects of a two-phase treatment with 60 µM Sp-8-Br-cAMPS on MCF7 (n=5), MDA231 (n=5) and SKBR3 (n=5) cell proliferation. Cells were starved in serum-free medium overnight prior to drug treatment. Cells were subsequently treated with 60 µM Sp-8-Br-cAMPS for 1 h prior to treatment replacement with a fresh 60 µM Sp-8-Br-cAMPS solution and a further 24-h incubation. Alamar Blue assays were performed by incubating cells in 10% AlamarBlue® dye (diluted in serum-free medium) for 4 h. Mean % migration and mean % proliferation values were compared using an unpaired t-test. Mean values presented ± SEM; **P≤0.01, ***P≤0.001.
Figure 7
Figure 7. Suppression of POPDC1 is overcome by SP-8-Br-cAMPS and rescues inhibited cell migration and proliferation in breast cancer cells
(A) Boyden chamber assay analysis of the effects of 60 µM Sp-8-Br-cAMPS on MCF7 (n=4), MDA231 (n=4) and SKBR3 (n=4) breast cancer cell migration following POPDC1 suppression with siRNA. Boyden chamber assay was performed over a 3-h incubation period to allow cell migration across the polycarbonate membrane; scale bars = 250 μm. (B) Alamar Blue assay analysis of the effects a two-phase 60 µM Sp-8-Br-cAMPS treatment on the proliferation of MCF7 (n=5), MDA231 (n=5) and SKBR3 (n=5) cells following POPDC1 suppression with siRNA. Cells were transfected for 36 h and starved overnight prior to drug treatment. Cells were treated with 60 µM Sp-8-Br-cAMPS treatment for 1 h prior to treatment replacement with a fresh 60 µM Sp-8-Br-cAMPS treatment solution and 24-h incubation. Alamar Blue assay was performed by incubating cells in 10% AlamarBlue® dye for 4 h. Mean % migration and mean % proliferation values were compared using an unpaired t-test. Mean values presented ± SEM.

Similar articles

Cited by

References

    1. Globocan W. Estimated cancer incidence, mortality and prevalence worldwide in 2012. 2014-01-09)[2014-07-01], http://globocan.iarc.fr/Pages/fact_sheets_population.Aspx.
    1. Ferrer-Soler L., Vazquez-Martin A., Brunet J., Menendez J.A., De Llorens R. and Colomer R. (2007) An update of the mechanisms of resistance to EGFR-tyrosine kinase inhibitors in breast cancer: Gefitinib (iressa™)-induced changes in the expression and nucleo-cytoplasmic trafficking of HER-ligands (review). Int. J. Mol. Med. 20, 3. - PubMed
    1. Normanno N., Luca A.D., Maiello M.R., Campiglio M., Napolitano M., Mancino M. et al. (2006) The MEK/MAPK pathway is involved in the resistance of breast cancer cells to the EGFR tyrosine kinase inhibitor gefitinib. J. Cell. Physiol. 207, 420–427 - PubMed
    1. Mirzoeva O.K., Das D., Heiser L.M., Bhattacharya S., Siwak D., Gendelman R. et al. (2009) Basal subtype and MAPK/ERK kinase (MEK)-phosphoinositide 3-kinase feedback signaling determine susceptibility of breast cancer cells to MEK inhibition. Cancer Res. 69, 565–572 - PMC - PubMed
    1. Li C., Iida M., Dunn E.F., Ghia A.J. and Wheeler D.L. (2009) Nuclear EGFR contributes to acquired resistance to cetuximab. Oncogene 28, 3801–3813 - PMC - PubMed