. 2017 Nov 6;216(11):3817-3829.
doi: 10.1083/jcb.201609072. Epub 2017 Sep 27.

A novel intracellular pool of LFA-1 is critical for asymmetric CD8+ T cell activation and differentiation

Affiliations

A novel intracellular pool of LFA-1 is critical for asymmetric CD8+ T cell activation and differentiation

Tara Capece et al. J Cell Biol. .

Abstract

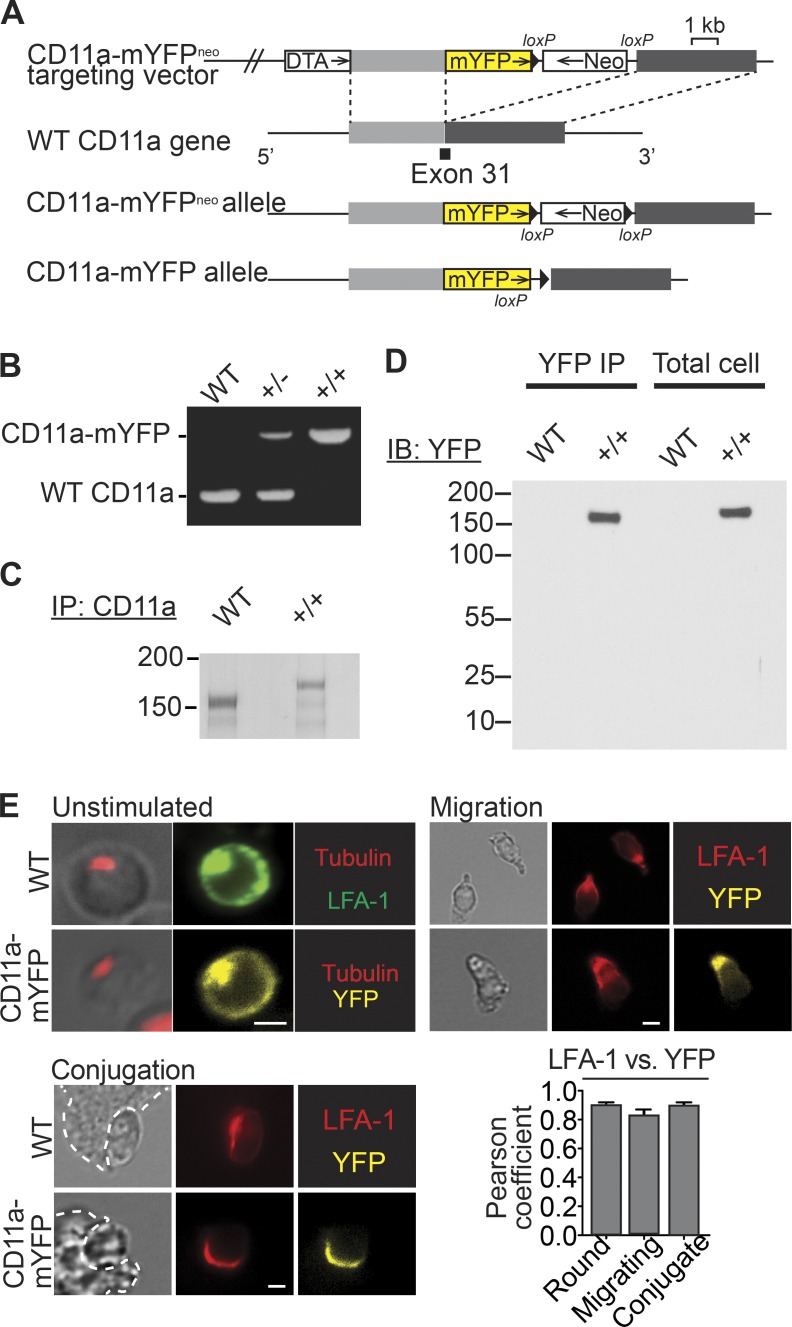
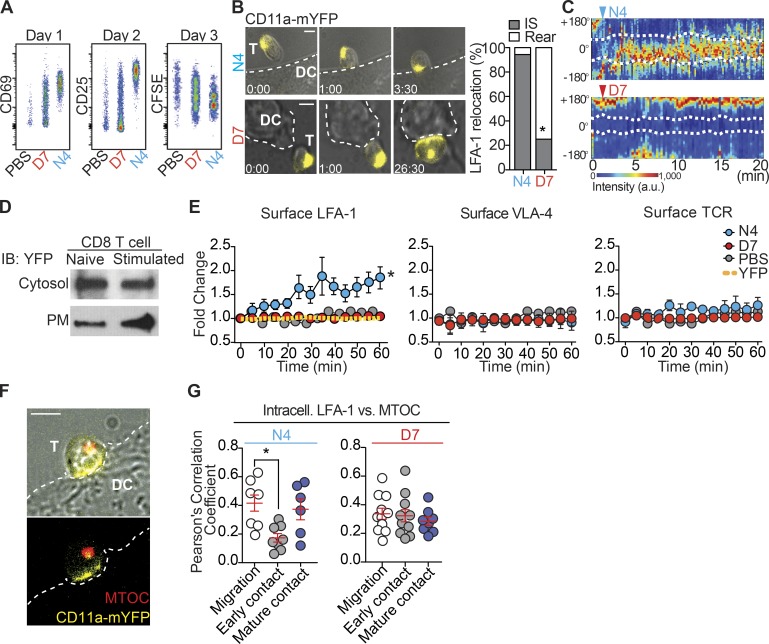
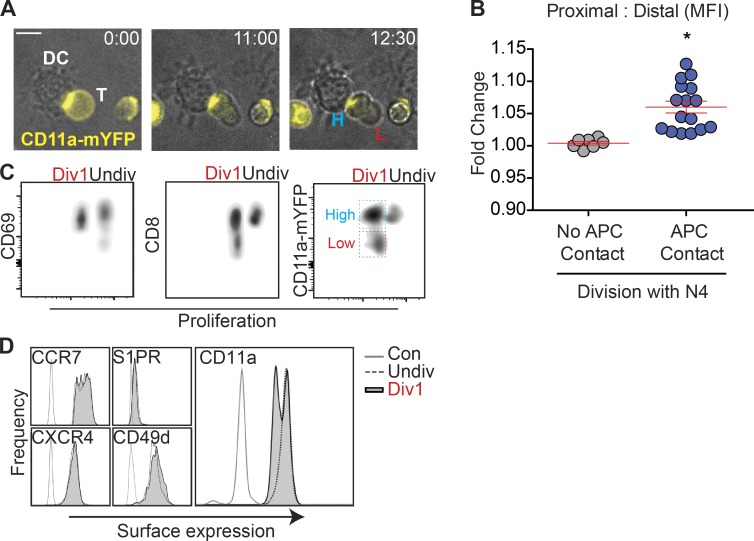
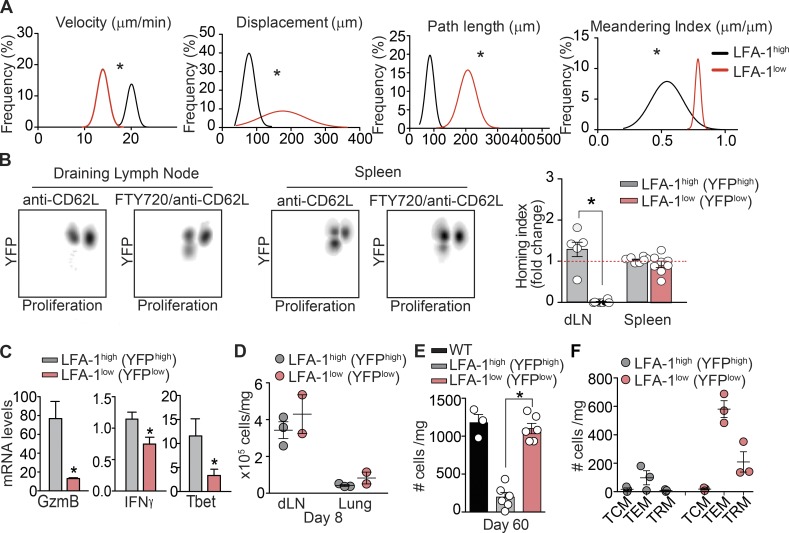
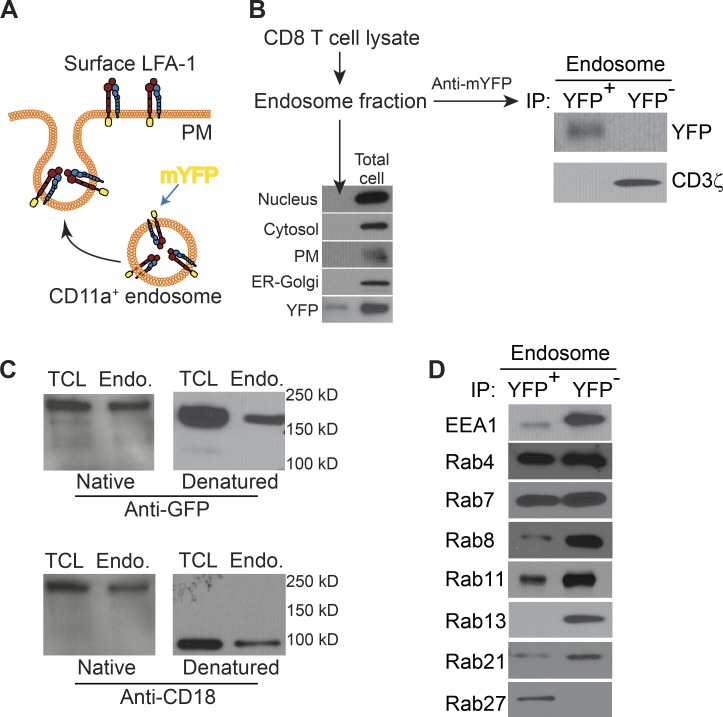
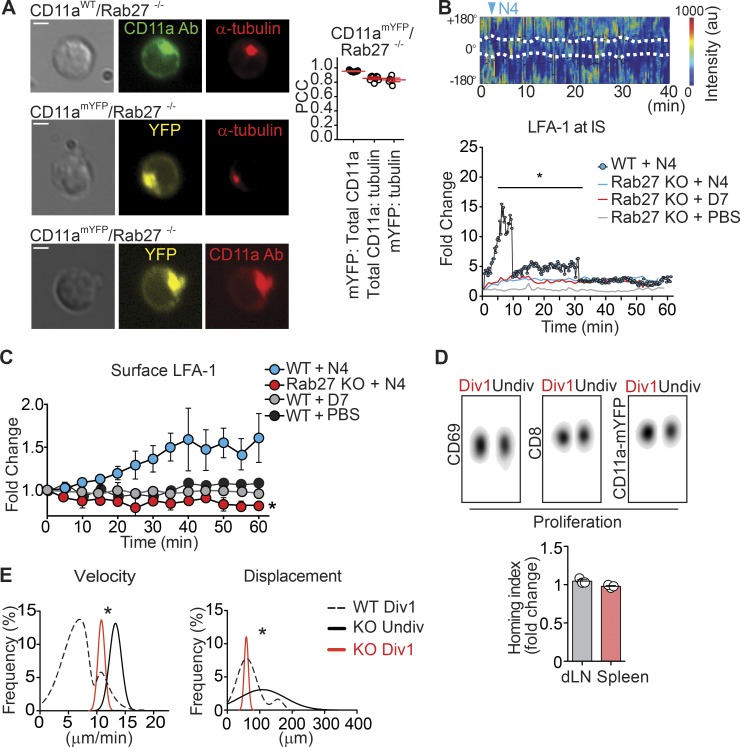
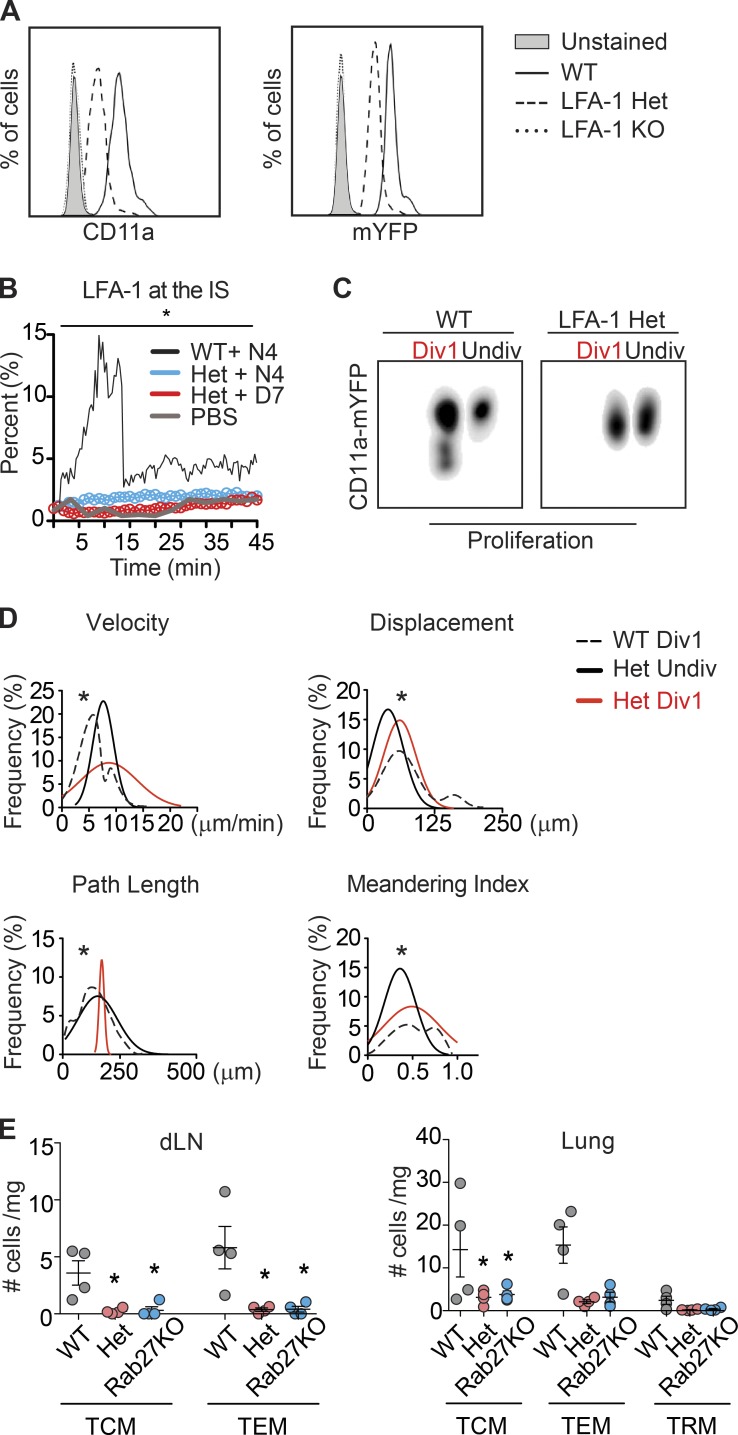
The integrin lymphocyte function-associated antigen 1 (LFA-1; CD11a/CD18) is a key T cell adhesion receptor that mediates stable interactions with antigen-presenting cell (APC), as well as chemokine-mediated migration. Using our newly generated CD11a-mYFP knock-in mice, we discovered that naive CD8+ T cells reserve a significant intracellular pool of LFA-1 in the uropod during migration. Intracellular LFA-1 quickly translocated to the cell surface with antigenic stimulus. Importantly, the redistribution of intracellular LFA-1 at the contact with APC was maintained during cell division and led to an unequal inheritance of LFA-1 in divided T cells. The daughter CD8+ T cells with disparate LFA-1 expression showed different patterns of migration on ICAM-1, APC interactions, and tissue retention, as well as altered effector functions. In addition, we identified Rab27 as an important regulator of the intracellular LFA-1 translocation. Collectively, our data demonstrate that an intracellular pool of LFA-1 in naive CD8+ T cells plays a key role in T cell activation and differentiation.


Figures

Figure 1.
Figure 1.
Naive CD8+ T cells possess an intracellular pool of LFA-1. (A) Schematic of CD11a-mYFP mouse generation. The mYFP sequence was knocked into the C terminus of the mouse integrin CD11a subunit. (B) CD11a PCR depicting the increased size of CD11a corresponding with the mYFP tag. (C) Corresponding size increase was also detected in a silver stain at the protein level. mAb M17/4 was used for immunoprecipitation of CD11a. (D) Western blot analysis of YFP expression in YFP immunoprecipitate (IP) and total cell lysate from splenocytes of CD11a-mYFP mice showing the intact YFP conjugation to CD11a. No evidence of proteolytic cleavage of YFP was detected. (E) Representative images of permeabilized naive CD8+ T cells stained with CD11a (LFA-1) or α-tubulin antibodies on noncoated glass surface (unstimulated/round), after 30 min of migration on ICAM-1 and CCL21 coating (migration) or after 60 min of conjugation with N4-pulsed BMDCs (conjugation) showing the intracellular pool of LFA-1. Bars, 2 µm. Graph shows colocalization of YFP signal versus anti–CD11a antibody (LFA-1) signal in naive CD11a-mYFP CD8+ T cells. Pearson coefficient was generated as YFP (CD11a-mYFP)/red (anti-CD11a). Note that the YFP signal and the anti–CD11a antibody (LFA-1) signal are highly colocalized in naive CD11a-mYFP CD8+ T cells. Data are presented as mean ± SEM; n = 4 mice/group (10–20 cells per mouse). Note that there are equivalent levels of total LFA-1 (intracellular staining and surface LFA-1) detected in both saponin and Triton X-100 permeabilized samples (Fig. S2 C).
Figure 2.
Figure 2.
Redistribution of intracellular LFA-1 during T cell activation. (A) Representative flow cytometry analysis of T cell activation (CD69 and CD25) and proliferation (CFSE dilution) after stimulation of naive T cells with cognate ligand (N4) or altered peptide ligand (D7)–loaded irradiated splenocytes; n = 4 mice. (B) Representative images from real-time T cell contacts with APCs loaded with N4 or D7 peptide on plates coated with ICAM-1 and CCL21. Bars, 5 µm. In the graph, each bar represents the percentage of total cells scored after 45 min of co-culture. The gray portion of each bar is the fraction of cells exhibiting dominant YFP signal at the immunological synapse (IS) region, and the white portion is the fraction of the cells that showed YFP signal at the posterior region. Data represent mean ± SEM; n = 3 mice/group (30–42 cells per mouse). *, P < 0.05. (C) Representative fluorescence intensity of CD11a-mYFP cell surface from B. YFP fluorescence intensity is shown in a pseudocolor scale (from low [black] to high [red]). +/− 180°, rear of cell; 0°, leading edge; white lines depict the T cell–APC interface; arrowheads indicate the beginning of the T cell–APC contact. (D) Representative Western blot analysis of YFP expression in cell cytosol and plasma membrane (PM) fractions from naive CD11a-mYFP CD8+ cells or cells stimulated with CD3/CD28 antibodies for 30 min. Note that CD11a-mYFP protein level was increased in PM after T cell activation. n = 3 mice. (E) Flow cytometry analysis of surface LFA-1, VLA-4, and TCR levels after indicated times of naive CD11a-mYFP/OT-I CD8+ T cell and peptide-pulsed or PBS-treated BMDC co-culture. YFP+ T cells were fixed at indicated times and stained for surface expression. Total LFA-1 levels measured by mYFP intensity (yellow line). Data normalized to PBS control. Data are expressed as mean ± SEM of six separate experiments. *, P < 0.001. (F) Representative image of naive CD11a-mYFP CD8+ T cells stained with ER Tracker (MTOC; red) during N4-loaded APC interaction on the ICAM-1+CCL21–coated surface. Note that CD11a-mYFP and the MTOC are not colocalized during the LFA-1 redistribution. Bar, 5 µm. (G) The MTOC and CD11a-mYFP are colocalized during migration and mature APC contact, but not during early LFA-1 translocation to the APC contact (“early contact”) when stimulated by N4. The Pearson’s correlation coefficient was generated as YFP (LFA-1)/red (MTOC). Circles represent individual cells from three independent experiments with mean shown as a line. Data represent mean ± SEM. *, P < 0.01.
Figure 3.
Figure 3.
Intracellular LFA-1 redistribution leads to unequal partitioning during division. (A) Representative image of real-time cell division on ICAM-1–coated plates 30 h after co-culture of naive CD11a-mYFP/OT-I CD8+ T cells (yellow) with N4-pulsed BMDCs. H, LFA-1high; L, LFA-1low. Bar, 5 µm. (B) Quantification of relative LFA-1 expression levels (mYFP intensity) of daughter T cells with and without APC contact during division. Data were analyzed based on real time imaging under N4-conditions. Each circle represents the ratio of total YFP intensity in each daughter cell by proximity to APC (proximity vs. distal). For divisions occurring outside of APC contact (no APC contact), proximity was assigned arbitrarily and both proximal and distal cells from the same parent cell showed similar YFP intensity (fold change = 1). Circles represent individual cells from five independent experiments with mean shown as a red line. Data represent mean ± SEM; n = 5. *, P < 0.0003. (C) Naive CD11a-mYFP/OT-I CD8+ T cells (1–3 × 10⁶) were labeled with Cell Proliferation Dye eFluor670 and i.v. transferred 24 h before infection with influenza virus x31-OVA. 56 h after infection, transferred cells were sorted and identified as the first division (Div1) and undivided (Undiv) cells based on proliferation dye dilution. Cell surface CD8 and CD11a-mYFP showed asymmetric expression on the first-divide cells (Div 1), but not the cell activation marker (CD69). Results are representative of 10 independent experiments (one mouse per experiment). (D) Flow cytometry analysis of cell surface receptors of the first division (Div1) and undivided (Undiv) CD8+ T cells generated from OT-I mice 56 h after infection with influenza virus x31-OVA (as described in C). Transferred cells were sorted on proliferation dye expression and stained for cell surface receptors, Con, isotype control. Results are representative of three independent experiments (one mouse per experiment).
Figure 4.
Figure 4.
Unequal LFA-1 expression leads to disparate migration and differentiation of first-division CD8+ T cells. (A) Frequency distribution of migration indices measured from sorted first-division LFA-1high (YFPhigh) versus LFA-1low (YFPlow) CD8+ T cells migrating on ICAM-1+CCL21–coated plates were significantly different. Data collected from four independent experiments (one mouse per experiment; 44–72 cells per mouse) were fit to nonlinear regression, and multimodality was assessed with the Kolmogorov–Smirnov test. Asterisk indicates significance between LFA-1high versus LFA-1low (*, P < 0.01). (B) Flow cytometry analysis and homing index of first-division LFA-1high versus LFA-1low CD8+ T cells generated in vivo in x31-OVA–infected mice treated with 100 µg anti-CD62L i.v. ± 1 µg/g FTY720 i.p. 44 hpi. Lymph node and spleen were harvested at 56 hpi, and single-cell suspension was recorded on a flow cytometer (left). The homing index (right) of Div1 YFPhigh or Div1 YFPlow cells was calculated as the ratio between anti-CD62L–treated mice and (anti-CD62L + FTY720)–treated mice. Circles represent individual mice from three independent experiments (one or two mice per experiment) with mean shown as a line. Data represent mean ± SEM. *, P < 0.0001. (C) mRNA levels of indicated genes from sorted first-division LFA-1high versus LFA-1low CD8+ T cells from x31-OVA–infected mice 56 hpi. Data represent mean ± SEM; n = 3 mice per group. *, P < 0.05. (D and E) First-division LFA-1high and LFA-1low CD8+ T cells were harvested at 56 hpi from influenza-infected mice and sorted based on YFP expression. Equal numbers (2 × 10³) of sorted first-division LFA-1high versus LFA-1low CD8+ T cells were injected into WT recipients, and mice were then inoculated with X31-OVA. The number of CD11a-mYFP+ CD8+ T cells found in the draining lymph node and lung 8 dpi (D; n = 3 mice per group) or 60 dpi (E) is shown. Data represent mean ± SEM; n = 3–6 mice per group. *, P < 0.001) as measured by flow cytometry. (F) Number of tissue-resident memory (TRM; CD103+ [integrin αE], CD62Llow [L-selectin], CD44high), central memory (TCM; CD62L+, CD44high), and effector memory (TEM; CD62Lneg, CD44high) CD11a-mYFP+ CD8+ T cells found in the lung 60 dpi. Data represent mean ± SEM; n = 3 mice/group. *, P < 0.001.
Figure 5.
Figure 5.
Intracellular LFA-1 contained in Rab27 endosomes. (A) Schematic depicting the mYFP tag on the exterior of LFA-1+ endosomes. (B) Purity of endosomal fraction isolated from naive CD11a-mYFP/CD8+ T cell homogenate was confirmed by the absence of lamin B (nucleus marker), HSP90 (cytosol maker), NaKATPase (plasma membrane [PM] marker), and SERCA1/2/3 (ER–Golgi marker) signals and the presence of CD11a-mYFP signal in Western blot analysis (left). LFA-1+ endosome and LFA-1 endosome were further separated by immunoprecipitation (IP) with a monoclonal GFP/YFP (E36) antibody and tested for the presence of CD3ζ (right). Results are representative of three independent experiments. (C) Total cell lysate (TCL) and LFA-1+ endosome lysate (Endo) were isolated under native conditions (native) and tested for the presence of intact LFA-1 heterodimer, and compared with endosomes and TCL isolated under denaturing conditions (denatured) for the presence of CD11a-mYFP (180 kD) and CD18 (∼95 kD). Results are representative of three independent experiments. (D) LFA-1+ and LFA-1 endosomes were tested for indicated Rab protein expression. Results are representative of six independent experiments.
Figure 6.
Figure 6.
Rab27-mediated intracellular LFA-1 redistribution mediates differential behavior of first-division cells. (A) Representative images showing both surface and intracellular staining (permeabilized with 0.05% saponin) of LFA-1 (green: anti-CD11a, clone M17/4) and α-tubulin (red: clone 11H10). Bars, 2 µm. Pearson’s correlation coefficients from naive CD11a-mYFP/OT-I/Rab27 KO CD8+ T cells (right). Each dot represents mean PCC from one mouse (30–45 cells/mouse). (B) Representative mYFP fluorescence intensity from the CD11a-mYFP/OT-I/Rab27 KO CD8+ T cell surface (top). YFP fluorescence intensity is shown in a pseudocolor scale (from low [black] to high [red]). +/− 180°, rear of cell; 0°, leading edge; white lines depict the T cell–APC interface; arrowheads indicate the beginning of the T cell–APC contact. Quantification of relative fluorescence intensity of mYFP from CD11a-mYFP/OTI (WT) versus CD11a-mYFP/Rab27KO/OT-I (Rab27 KO) cells at the contact site (bottom). Data are expressed as mean of total 35–55 cells. *, P < 0.001. (C) Flow cytometry measuring LFA-1 surface levels (anti–LFA-1 antibody) on T cells from OT-I (WT) or OT-I/Rab27 KO after indicated times of T and N4-, D7-, or PBS-loaded APC contacts. Data are expressed as mean ± SEM of three separate experiments (8–10 mice/group). *, P < 0.0001. (D, top) Representative flow cytometry of CD11a-mYFP/OT-I/Rab27 KO CD8+ T cell division in x31-OVA infected mice 56 hpi (n = 9). (D, bottom) The homing index of Div1 Rab27 KO was calculated as the ratio between CD62L-treated mice and (CD62L + FTY720)–treated mice. Circles represent individual mice from three independent experiments (one mouse per experiment) with mean shown as a line. (E) Frequency distribution of migration velocity and displacement measured from WT-OTI (WT Div1) and OT-I/Rab27 KO (KO Div1) first-division or undivided OT-I/Rab27 KO (KO Undiv) CD8+ T cells migrating on ICAM-1+CCL21–coated plates. Data collected from three independent experiments (one mouse per experiment; 40–65 cells/mouse) were fit to nonlinear regression, and multimodality was assessed with the Kolmogorov–Smirnov test. Asterisk indicates significance between WT Div1 and KO Div1 (*, P < 0.01).
Figure 7.
Figure 7.
CD11a heterozygous knockout T cells fail to induce asymmetric LFA-1 expression and disparate migration patterns in first-division CD8+ T cells. (A) Representative flow cytometry of surface (CD11a Ab) and total (mYFP) LFA-1 expression levels from CD11a-mYFP/OT-I Het and WT OT-I naive CD8+ T cells; n = 3 mice. (B) Quantification of relative fluorescence intensity of mYFP from CD11a-mYFP/OTI (WT) versus CD11a-mYFP/OT-I Het CD8+ T cells at the contact site with Ag-bearing APCs (N4 or D7). Data are expressed as mean of total 25–40 cells. (C) Representative flow cytometry analysis of asymmetric expression of CD11a-mYFP in WT (CD11a-mYFP/OT-I) versus LFA-1 Het (CD11a+/−-mYFP/OT-I) CD8+ T cell division from x31-OVA–infected mice 56 hpi; n = 6 mice. (D) Frequency distribution of migration indices measured from CD11a-mYFP (WT Div1) and CD11a-mYFP+/− (Het Div1) first-division or CD11a-mYFP+/− (Het Undiv) undivided CD8+ T cells. Data collected from three independent experiments (one mouse per experiment; 45–60 cells/mouse) were fit to nonlinear regression and multimodality was assessed with the Kolmogorov–Smirnov test. Asterisk indicates significance between WT Div1 and Het Div1 (*, P < 0.01). (E) Number of tissue-resident memory (TRM; CD103+ [integrin αE], CD62Llow [L-selectin], CD44high), central memory (TCM; CD62L+, CD44high), and effector memory (TEM; CD62Lneg, CD44high) CD11a-mYFP+ CD8+ T cells found in the draining lymph node and lung 60 dpi (CD11a+/−-mYFP/OT-I T cells: Het, CD11a-mYFP/OT-I/Rab27 KO T cells: Rab27KO). Data represent mean ± SEM; n = 4 mice/group. *, P < 0.05.

Similar articles

Cited by

References

    1. Arsenio J., Kakaradov B., Metz P.J., Kim S.H., Yeo G.W., and Chang J.T.. 2014. Early specification of CD8+ T lymphocyte fates during adaptive immunity revealed by single-cell gene-expression analyses. Nat. Immunol. 15:365–372. 10.1038/ni.2842 - DOI - PMC - PubMed
    1. Arsenio J., Metz P.J., and Chang J.T.. 2015. Asymmetric Cell Division in T Lymphocyte Fate Diversification. Trends Immunol. 36:670–683. 10.1016/j.it.2015.09.004 - DOI - PMC - PubMed
    1. Baker C.M., Comrie W.A., Hyun Y.M., Chung H.L., Fedorchuk C.A., Lim K., Brakebusch C., McGrath J.L., Waugh R.E., Meier-Schellersheim M., and Kim M.. 2012. Opposing roles for RhoH GTPase during T-cell migration and activation. Proc. Natl. Acad. Sci. USA. 109:10474–10479. 10.1073/pnas.1114214109 - DOI - PMC - PubMed
    1. Berlin-Rufenach C., Otto F., Mathies M., Westermann J., Owen M.J., Hamann A., and Hogg N.. 1999. Lymphocyte migration in lymphocyte function-associated antigen (LFA)-1-deficient mice. J. Exp. Med. 189:1467–1478. 10.1084/jem.189.9.1467 - DOI - PMC - PubMed
    1. Bose T.O., Pham Q.M., Jellison E.R., Mouries J., Ballantyne C.M., and Lefrançois L.. 2013. CD11a regulates effector CD8 T cell differentiation and central memory development in response to infection with Listeria monocytogenes. Infect. Immun. 81:1140–1151. 10.1128/IAI.00749-12 - DOI - PMC - PubMed

Publication types

MeSH terms