Review
. 2017 Oct 1;97(4):1619-1747.
doi: 10.1152/physrev.00007.2017.

Hippocampal GABAergic Inhibitory Interneurons

Affiliations
Review

Hippocampal GABAergic Inhibitory Interneurons

Kenneth A Pelkey et al. Physiol Rev. .

Abstract

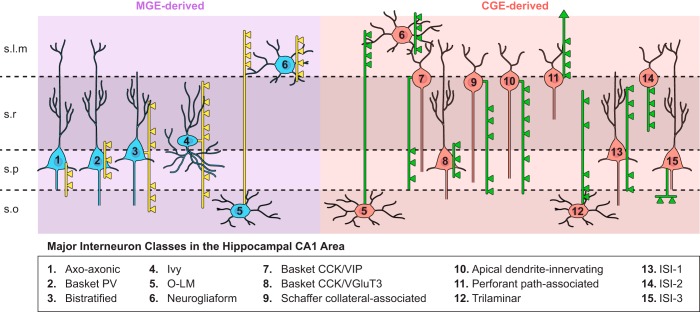
In the hippocampus GABAergic local circuit inhibitory interneurons represent only ~10-15% of the total neuronal population; however, their remarkable anatomical and physiological diversity allows them to regulate virtually all aspects of cellular and circuit function. Here we provide an overview of the current state of the field of interneuron research, focusing largely on the hippocampus. We discuss recent advances related to the various cell types, including their development and maturation, expression of subtype-specific voltage- and ligand-gated channels, and their roles in network oscillations. We also discuss recent technological advances and approaches that have permitted high-resolution, subtype-specific examination of their roles in numerous neural circuit disorders and the emerging therapeutic strategies to ameliorate such pathophysiological conditions. The ultimate goal of this review is not only to provide a touchstone for the current state of the field, but to help pave the way for future research by highlighting where gaps in our knowledge exist and how a complete appreciation of their roles will aid in future therapeutic strategies.


Figures

FIGURE 1.
FIGURE 1.
Schematic representation of hippocampal interneuron subtypes highlighted in this review. Interneuron subtypes are parsed according to origin within the medial ganglionic eminence (MGE) or caudal ganglionic eminence (CGE). Cells with dual origins are represented in both cohorts. Somato-dendritic profiles are represented in uniform color (blue for MGE, red for CGE). Thinner axon trajectories are illustrated in yellow (MGE-derived cells) and green (CGE-derived cells) with boutons (triangles) illustrating the dominantly targeted domains of CA1 pyramidal cells innervated by each interneuron subtype.
FIGURE 2.
FIGURE 2.
Perisomatic targeting interneurons. A: morphological reconstruction of a representative axo-axonic cell (AAC). Inset shows that the dye-filled AAC is immunopositive for parvalbumin (PV). B: immunohistochemistry and electron microscopy images illustrating that the cartridges and axon terminals of a dye filled AAC (green) target ankyrin G-positive (yellow) axon initial segments (AISs) of principal cells. C: morphological reconstruction of a representative PVBC with inset confirming PV immunoreactivity within a dendritic segment of the dye filled PVBC. D: immunohistochemistry and electron microscopy images illustrating that PVBC terminals (green) target principal cell somas and avoid ankyrin G-positive AISs. E: morphological reconstruction of a representative CCKBC with inset showing CB1R immunolabeling within a segment of dye filled axon. F: superresolution STORM imaging illustrates intense CB1R immunolabeling of dye-filled CCKBC terminals. Also shown is an electron micrograph highlighting CB1R expression in perisomatic targeting GABAergic terminals. [Reconstructions with inset immunohistochemistry presented in A, C, and E are modified with permission from Nissen et al. (838) and Journal of Neuroscience. Images B and D are modified with permission from Gulyás et al. (443) and Journal of Neuroscience. STORM images in F were kindly provided by Dr. Katona while the electron micrograph was modified with permission from Dudok et al. (289) and Nature Neuroscience.]
FIGURE 3.
FIGURE 3.
Dendrite targeting interneurons and interneuron selective interneurons (ISIs). A: morphological reconstruction of a representative bistratified cell (BiC). At right, the reconstructed cell is illustrated to be immunopositive for SST and NPY while a different BiC highlights PV expression in this interneuron subtype. B: morphological reconstruction of a representative SCA with top inset showing that the cell is CCK immunopositive. Also shown at right (bottom) are STORM images illustrating strong CB1R immunolabeling within terminals of a separate dendrite targeting CCK interneuron. [Bottom right panel modified with permission from Dudok et al. (289).] C: morphological reconstruction of a representative O-LM with insets illustrating SST and mGluR1α immunoreactivity in the soma and along a dendritic segment, respectively. D–F: morphological reconstructions of representative NGFC (D), IvC (E), and ISI3 (F) cells along with single cell RT-PCR profiles probing for mRNA expression of the indicated markers. [A modified with permission from Klausberger et al. (583) and Nature Neuroscience. B modified with permission from Lee et al. (654) and Journal of Neuroscience. C modified with permission from Katona et al. (561) and Neuron. D–F modified with permission from Tricoire et al. (1137) and Journal of Neuroscience.]
FIGURE 4.
FIGURE 4.
Subpallial embryonic origins, and genetic programs directing genesis/migration/circuit integration of cortical interneurons. A, left panel: schematic illustrating pathways of migration for cortical and striatal interneurons from the GEs. Right panel: diagram of embryonic brain with the subdivisions of the ventral telencephalon in the coronal plane. The three regions where striatal, neocortical, and hippocampal interneurons originate are the medial ganglionic eminence (MGE) (including the dorsal MGE-dMGE), the caudal ganglionic eminence (CGE), and the preoptic area (POA). The lateral ganglionic eminence (LGE) largely gives rise to basal forebrain neurons and striatal medium spiny neurons. Note that the vast majority of cortical interneurons are derived from MGE and CGE. B: genetic programs controlling neurogenesis, cell commitment, tangential, and radial migration as well as maturation of cortical interneurons. The subdivision of the neuroepithelium can be identified by combinatorial expression patterns of transcription factors involved at different stages of cortical interneuron development. Some of these factors participate broadly in interneuron development such as Dlx and CoupTF gene families. Some transcription factors are unique to specific domains and/or stages of differentiation. Nkx2.1 defines the MGE and activates a cascade of genes including Lhx6, Sox6, and Satb1. Nkx6.2 and Gli1 are enriched in the dMGE. Prox1 and Sp8 are expressed in CGE-derived cortical interneurons at all stages of their development. Note that it is unclear whether Sox6 and SatB1 are necessary for the development of nNOS expressing Ivy cells. [Adapted with permission from Kessaris et al. (577) with permission from Current Opinions in Neurobiology and from Wonders and Anderson (1213) with permission from Nature Reviews Neuroscience.]
FIGURE 5.
FIGURE 5.
The ganglionic eminence origins for hippocampal interneurons often deviate from the rules underlying neocortical interneuron embryogenesis. In cortex, all PV- and SST-containing (as well as a minor population of NPY-positive/nNOS-positive) interneurons are derived from the MGE, while the remaining populations (including VIP, CCK, and NPY-containing interneurons) are derived from the CGE. While these rules are true for many hippocampal interneuron subpopulations, 5HTR3AR-positive SST-containing interneurons are derived from the CGE. Furthermore, all NGFCs destined to reside in cortex have their origins in the CGE, whereas in hippocampus NPY-positive/nNOS-containing NGFC have their origins in the MGE and NPY-positive, nNOS-negative NGFC arise from CGE origins.
FIGURE 6.
FIGURE 6.
PCs influence the radial migration of interneurons in the cortex. A: MGE- and CGE-derived interneurons are biased in their distributions between deep and superficial lamina, respectively. In the hippocampus, lamination depth is relative to the direction of the apical dendrite (i.e., s.o. is deep and s.l.m. is superficial). In the cortex, the distribution of interneurons correlates with that of pyramidal cell subtypes: intratelencephalic (IT) type are found primarily in superficial layers while pyramidal tract (PT) type are found only in deep layers. B: MGE- and CGE-derived interneurons born on the same day are initially unsorted among the cortical layers and only achieve their stereotyped laminar distributions over the course of the first postnatal week. C, i: knockout of the transcription factor Fezf2 results in the loss of PT-type projection neurons in deep cortical layers, which are replaced by IT type. In these mice, SST+ and PV+ interneurons accumulate to a greater degree in superficial than deep layers. ii: Layer 5 PT-type projection neurons receive greater PVBC inhibition than layer 2/3 IT type. Overexpression of Fezf2 in layer 2/3 results in the conversion of IT type cells to PT type with concomitant increase in PVBC inhibition. PV puncta density was compared between layer 2/3 IT, layer 2/3-induced PT (iPT), and layer 5 PT-type projection neurons. CRYM is a marker for PT type cells. D, i, top: in layer 5 pyramidal cells CXCL12 is localized to the cell bodies but not AIS or dendrites. Bottom: CXCR7, the receptor for CXCL12, is localized to the soma and axon terminals of PVBCs, which target layer 5 pyramidal cells. Pyramidal cells are labeled with GFP. plkBa is a marker for the AIS. ii: Interneurons expressing dsRed were transplanted from the MGE of control or CXCR7 knockout mice at embryonic day 13.5 (E13.5) into the cortex of CXCL12-GFP mice at postnatal day 1 (P1). Interneurons lacking CXCR7 accumulated in the superficial layers, rather than being attracted to CXCL12 in the deep layers. Bracket indicates the location of layer 5 cell bodies expressing GFP from the CXCL12 gene locus. [B from Miyoshi and Fishell (795) with permission from Cerebral Cortex. Ci from Lodato et al. (687) and Cii from Ye et al. (1249) modified with permission from Neuron. Di from Wu et al. (1221) modified with permission from Cerebral Cortex. Dii from Vogt et al. (1176) with permission from Neuron.]
FIGURE 7.
FIGURE 7.
Interneurons contribute to the generation of early network activity in the hippocampus and cortex. A, top: spontaneous GDPs recorded intracellularly in hippocampal CA3 pyramidal cells occur rhythmically and are sensitive to the GABAA antagonist bicuculline (Bic). Bottom: expansion of individual GDP examples. B: early network activity in the cortex recorded with calcium imaging of a large population of cells. Left: cortical GDPs (cGDPs) occur rhythmically, engage ~30% of imaged cells, and are sensitive to bicuculline. Calcium signals from three representative cells are shown below the population histograms. Right: early cortical network oscillations (eCNOs) are also observed but are not sensitive to bicuculline. C: optogenetic inhibition of MGE- or CGE-derived interneurons with archearhodopsin (green box) in hippocampal CA1 at postnatal day 5. Inhibiting MGE- but not CGE-derived interneurons greatly reduces the frequency of spontaneous GDPs recorded in pyramidal cells. Traces from multiple overlaid trials are shown. D, i: example of a hub cell in hippocampal CA3 that is highly interconnected with neighboring cells and is capable of triggering a GDP when stimulated to fire action potentials. Axon depicted in red. ii: A subset of hub cells generated early during embryonic development project a long-range axon out of the fimbria (indicated by arrow), and thus may coordinate early network activity across different brain regions. In mature animals these interneurons target the septum. [A from Ben-Ari et al. (91) with permission from Journal of Physiology. B from Allene et al. (25) modified with permission from Journal of Neuroscience. C from Wester and McBain (1198) modified with permission from Journal of Neuroscience. D from Bonifazi et al. (114) modified with permission from Science.]
FIGURE 8.
FIGURE 8.
PCs and interneurons form subtype specific microcircuits in both the hippocampus and cortex. A: paired whole cell recordings in hippocampal CA1 between a PVBC (black) and a neighboring deep PC (green) and superficial PC (blue). The probability of observing a connection from a PVBC to either a deep or superficial PC is the same; however, deep PCs demonstrate larger amplitude inhibitory currents. This finding is consistent along the entire axis of the hippocampus (septal to temporal poles). B: in prefrontal cortex, PVBCs connect to PT-type pyramidal cells with greater probability than neighboring IT type. C: in somatosensory cortex, SST+ Martinotti cells mediate disynaptic inhibition between neighboring recurrently connected PT type PCs. D: in medial entorhinal cortex, CCKBCs selectively target PCs that project to the contralateral entorhinal cortex but not neighboring PCs that project to the dentate gyrus of the hippocampus. E, left: in CA1 hippocampus, PVBCs evoke larger amplitude inhibitory currents in PCs that project to the amygdala (AMG) vs. the media prefrontal cortex (mPFC). Right: PCs projecting to the mPFC are more likely to provide synaptic input to neighboring PVBCs than PCs projecting to the AMG or medial entorhinal cortex (MEC). [A and E from Lee et al. (656) modified with permission from Neuron. B from Lee et al. (650) modified with permission from Neuron. C from Silberberg and Markram (1015) modified with permission from Neuron. D from Varga et al. (1162) modified with permission from Nature Neuroscience.]
FIGURE 9.
FIGURE 9.
Multiparametric analysis of MGE-derived hippocampal interneurons. A–K: neurolucida reconstructions of GFP-containing interneurons recorded in slices from P15–P30 Nkx2–1Cre:RCE pups (dendrites and soma in black; axon in red). Scale bar: 100 μm. The dashed lines indicate the approximate boundaries of s.o., s.p., s.r., and s.l.m. Under each camera lucida drawing is the molecular profile obtained from single-cell PCR analysis for the recorded cell with filled boxes indicating transcripts detected. Also shown are the electrophysiological responses of the cells to the indicated square wave current pulses (bottom) from a resting potential near −60 mV. Depolarizing current pulses and corresponding responses are for near-threshold and 2x-threshold stimulation (scale bars shown in K are for all traces). Phase plots of the APs arising from 2x-threshold stimulation are shown at right, with the first AP phase plot colored red and subsequent APs progressing from warm to cool colors ending in violet. L: histogram summarizing the frequency of occurrence for 16 transcripts probed by scPCR among the MGE cohort of recorded cells. GAD65, GAD67 glutamic acid dehydrogenase; nNOS, neuronal nitric oxide synthase; CR, calretinin; PV, parvalbumin; SOM, somatostatin; NPY, neuropeptide Y; VIP, vasoactive intestinal peptide; CCK, cholecystokinin; VGlut3, vesicular glutamate transporter type 3; enk, preproencephalin; Lhx6, LIM/homeoboxprotein 6; Npas1, Npas3 neuronal PAS domain 1 and 3; COUPTFII, chicken ovalbumin upstream promoter transcription factor II. [From Tricoire et al. (1138) with permission from Society for Neuroscience.]
FIGURE 10.
FIGURE 10.
Voltage-gated potassium and sodium currents in PVBCS. A, top left: a train of action potentials evoked by a 1-s depolarizing current pulse in a fast spiking basket cell in current-clamp configuration. Bottom left: voltage-gated K+ currents evoked in a nucleated patch isolated from a FSBC (holding potential −90 mV and test potentials delivered between −80 and 70 mV in 10-mV increments). Right: current subtraction analysis reveals three kinetically and pharmacologically distinct K+ current components in nucleated patches from FSBC. Top: a fast delayed rectifier K+ current component, [isolated by IcontrolI0.5 mM 4-AP (top trace) or IcontrolI1mM TEA (bottom trace)]. Middle: a slow delayed rectifier K+ current component (isolated by I0.5mM 4-API0.5mM 4-AP + 20mM TEA or I1mM TEAI20mM TEA). Bottom: an A-type K+ current component (isolated in the presence of I20 mM TEA). Currents were evoked by test pulses to 70 mV (from a holding potential of −90 mV). B: voltage-gated Na+ channel spatial distribution profiling in FSBCs. Channel density measured in the outside-out patch configuration is plotted against distance, with negative values indicating dendritic location (red) and positive values indicating axonal location (blue). Note the absence of an appreciable Na+ conductance in the dendrites and a stepwise increase of Na+ channel density from the soma to the proximal axon, followed by a gradual increase to the distal axon. [A from Martina et al. (756) with permission from Society for Neuroscience. B from Hu et al. (502) with permission from Science.]
FIGURE 11.
FIGURE 11.
Ih and IM in O-LM interneurons. A: whole cell voltage-clamp recordings from CA1 O-LM interneurons showing a family of Ih traces elicited by hyperpolarizing test pulses (Vh = −35 mV) in the range −50 to −120 mV in control (left panel) and after addition of extracellular Cs+ (5 mM, middle panel). The Cs+-sensitive current was obtained by digital subtraction (right panel). Bottom traces: similar results were obtained using the Ih antagonist ZD7288 (100 μM). B: time course of ZD7288 block: Ih was activated with repetitive steps to −120 mV (Vh = −40 mV). ZD7288 blocks the time-dependent inward current leaving only the leak and capacitive artifact (inset: i, control; ii, ZD7288; and i-ii, subtracted). Bottom right: under current-clamp recording conditions, ZD7288 induces a hyperpolarization of the cell, concomitant with a block of the sag and the rebound depolarization (arrow) elicited by hyperpolarizing current steps (insets: i, control; and ii, in the presence of ZD7288) (Vh = −60 mV). C: IM in SO interneurons can be identified using the antagonists, linopirdine, XE-991, and retigabine. Under whole cell voltage-clamp conditions, steps from −30 to −50 mV at 15-s intervals activate the time-dependent current IM (traces 1, 3, and 5). Addition of linopirdine, XE-991, and retigabine removes the time-dependent component. Traces enumerated in each condition are the average of three traces. Control traces (gray) are overlaid for comparison with drug conditions (black). Bottom panels: isolated IM amplitudes and changes in holding current (Ihold) in the presence of linopirdine, XE-991, and retigabine conditions. GFP-positive s.o. interneurons, anatomically identified O-LM cells, and unidentified s.o. interneurons are indicated by black symbols, gray symbols, and open symbols, respectively. [A and B from Maccaferri and McBain (718) with permission from Journal of Physiology. C from Lawrence et al. (645) with permission from the Society for Neuroscience.]
FIGURE 12.
FIGURE 12.
Unsupervised cluster analyses of hippocampal GABAergic interneurons based on developmental, electrophysiological, and molecular properties. A: Ward’s clustering applied to a sample of 142 recorded MGE- and CGE-derived interneurons. In this dendrogram, the x-axis represents individual cells, and the y-axis represents the average Euclidean within-cluster linkage distance. B: histogram summarizing the frequency of occurrence of each of the 16 transcripts probed by single cell PCR within each cluster obtained with the K-means clustering (K 6). See A for cluster color code. [Data from Tricoire et al. (1138) with permission the Society for Neuroscience.]
FIGURE 13.
FIGURE 13.
The three modes of GABA release from PV-containing, CCK-containing and NGFC interneurons. A and B: superimposed IPSCs (black) evoked by single presynaptic action potentials (red) in a PV-containing interneuron-granule cell (GC) pair (A) and a CCK interneuron-granule cell pair (B). Insets: histograms of IPSC latency. A and B, bottom panels: superimposed IPSCs (black) evoked by trains of 10 action potentials (red) in a PV interneuron-granule cell pair (left) show a predominant synchronous mode of inhibitory output. In contrast, repetitive transmission in a CCK interneuron-granule cell pair (right) shows a large asynchronous component of transmission as the train proceeds. Green: average IPSCs. Insets: presynaptic action potentials aligned to the stimulus onset at expanded time scale (scale bars: 2 ms, 50 mV). C: GABAA IPSCs evoked by NGFCs (top right panel) are comparatively slower than those observed at FSBC synapses. Top: 10 consecutive IPSCs (gray) and their average (black) in a layer 2/3 PC after single action potentials in a layer 1 NGFC (top). Middle traces show equivalent IPSCs evoked by a layer 2 FSBC for comparison. Bottom right panel: comparison of the kinetics of postsynaptic responses evoked by NGFCs (black squares) and FSBCs (gray circles). Each point represents an individual connection. D: modulation of GABA responses evoked by NGFCs by GABA uptake. Fast IPSCs evoked from FSBC are not sensitive to the GABA uptake inhibitor NO711. In contrast, GABAA,slow IPSCs arising from NGFCs are markedly prolonged in the presence of NO711, demonstrating a differential sensitivity of the two modes of transmission to inhibition of GABA uptake. [A and B from Hefft and Jonas (477) with permission from Nature Neuroscience. C and D from Szabadics et al. (1074).]
FIGURE 14.
FIGURE 14.
MGE and CGE-dependent expression of synaptic AMPAR-preferring glutamate receptors. A and B, top panels: interneurons that were targeted for recording using hippocampal slices derived from Nkx2–1-cre:RCE GFP and Htr3a-GFP reporter mouse lines, respectively (Scale bars, 100 μm). Middle panels: representative current-voltage relationships of Schaffer collateral-evoked AMPAR-mediated EPSCs in MGE- vs. CGE-derived CA1 interneurons. MGE-derived interneurons typically possess GluA2-lacking CP-AMPARs that possess strong inward rectification (left bottom panels). CGE-derived interneurons typically expressed GluA2-containing CI-AMPARs which possess near linear rectification properties. Individual dots in bottom panels represent data from a single recording; numbers in parentheses represent the number of cells recorded. [Data from Matta et al. (763).]
FIGURE 15.
FIGURE 15.
MGE and CGE-dependent expression of synaptic NMDAR-preferring glutamate receptors and the cell type developmental expression of synaptic GluN2 receptors. A, left: MGE-derived interneurons typically possess small NMDAR-mediated EPSCs that have rapid kinetics. Schaffer collateral evoked synaptic traces show AMPAR-mediated inward currents and NMDAR-mediated outward currents (Vh = −70 and +40 mV, respectively). A, middle: in contrast, CGE-derived interneurons typically possess large and kinetically slow evoked NMDAR-mediated currents. Right panel: AMPA/NMDAR amplitude ratios to be ~0.25 for MGE-derived interneurons and close to unity for CGE-derived interneurons. B: synaptic NMDARs at Schaffer collateral synapses onto CA1 MGE-derived interneurons undergo a developmental switch in NMDAR subunit expression. Left column: MGE-derived interneurons transition from GluN2B containing NMDARs to GluN2A-containing in juvenile receptors as evidenced by a loss of ifenprodil sensitivity and decrease in the time constant of decay. Middle panels: in contrast, CGE-derived interneurons possess GluN2B-containing receptors that persist through both neonate and juvenile states. Right panels, top: summary plot for the NMDAR EPSC decay kinetic weighted time constant (τw) for both neonate and juvenile MGE- and CGE-derived identified interneurons. Bottom panels: summary graph of the developmental regulation of ifenprodil sensitivity expressed as the ratio of the NMDAR EPSC peak amplitude measured in the presence of ifenprodil divided by the control NMDA EPSC peak amplitude. [Data taken from Matta et al. (763).]
FIGURE 16.
FIGURE 16.
Target-cell-dependent inhibitory transmission. A, left: image of three biocytin-filled neurons in layer 5 somatosensory cortex. The pyramidal neuron on the left innervated another pyramidal neuron and a bipolar interneuron, both on the right. A, right: single-trial responses (30 Hz) to the same action potential train (evoked in the presynaptic left pyramidal cell) for the simultaneously recorded postsynaptic interneuron and pyramidal cell targets. Note the strong frequency facilitation and depression of synaptic events in the interneuron and pyramidal postsynaptic targets, respectively. B: data from a triple-patch recording in layer2/3 somatosensory cortex, revealing differential short-term plasticity in two classes of interneurons innervated by a single pyramidal neuron. Three action potentials evoked at 10 Hz in the presynaptic pyramidal cell (top trace), evoked short-term facilitation of unitary EPSPs evoked in the bitufted cell (middle trace, P-B connection), whereas the amplitude of EPSPs evoked simultaneously in the multipolar cell decreased (bottom trace, P-M connection). C: presynaptic Ca2+ transients at divergent release sites of the same axon exhibit target-cell dependence. A single layer 2/3 pyramidal cell loaded with Ca2+ indicator (upper fluorescence image) displays a large degree of heterogeneity in single action potential-evoked Ca2+ transients (bottom traces) at various boutons (circles) along a single axon collateral. [A from Markram et al. (749). B from Reyes et al. (940) with permission from Nature Neuroscience. C from Koester and Sakmann (591) with permission from Journal of Physiology.]
FIGURE 17.
FIGURE 17.
Schematic illustrating the major GABAAR-mediated functional connectivity among hippocampal interneurons. This schematic summarizes the known GABAAR-mediated cross-talk, as assessed by paired electrophysiological recordings in identified CA1/CA3 hippocampal interneuron subtypes. It must be noted that anatomical studies have demonstrated additional putative interactions between interneuron subtypes that have not been included in this summary. s.o., Stratum oriens; s.p., stratum pyramidale; s.r., stratum radiatum; s.l.m., stratum lacunosum moleculare.
FIGURE 18.
FIGURE 18.
Selectivity of postsynaptic GABABR-mediated responses at perisomatic vs. dendritic targeting PV- and CCK-containing interneuron subtypes. A and B: trains of stimuli elicit robust GABABR-mediated postsynaptic IPSCs (traces at bottom of cell reconstructions) in PV- and CCK-BC subtypes (see insets for post hoc immunocytochemistry and membrane voltage responses including action potential firing patterns in response to hyperpolarizing and depolarizing current steps) with minimal or no response at their dendrite targeting (DTI) counterparts. Based on axonal arborization, the PV and CCK DTIs in these examples correspond to bistratified (BiC) and Schaffer-collateral associated cells, respectively (SCA). C: schematic summarizing this selectivity as described in these studies. PC, pyramidal cell. [PV cell reconstructions and traces from Booker et al. (116) with permission from Journal of Neuroscience. CCK cell reconstructions and traces from Booker et al. (115) with permission from Cerebral Cortex.]
FIGURE 19.
FIGURE 19.
The differential impact of inhibitory inputs arriving at distal vs. proximal dendritic locations. A: schematic showing the two different experimental protocols, with application of the GABAA agonist muscimol either to the soma and proximal apical dendritic trunk, or to the more distal apical trunk close to the location of a patch pipette. A steady-state excitatory conductance (Erev = 0 mV) is simulated by dynamic clamp over a 1-s period, and the steady-state firing rate is derived from the final 400 ms of this. B: input-output (IO) functions at different levels of ambient muscimol for dendritic (Bi) and somatic (Bii) applications. Muscimol is applied by a continual series of low pressure puffs, and the concentration is varied by changing the frequency of pressure puffs. Note that in the configuration where muscimol is applied to the distal dendritic compartment, the maximal attainable firing frequency is unchanged in contrast to when muscimol is applied to the somatic/proximal dendritic compartment. [Data from Pouille et al. (924) with permission from Physiological Reports.]
FIGURE 20.
FIGURE 20.
Common motifs of inhibition within cortical and hippocampal circuits. A, left: feedforward (a) and feedback (b) inhibitory control of principal (PC) cell circuits are the most common circuits within hippocampus and cortex. In feedforward inhibitory circuits, a common afferent (PCI) makes monosynaptic connections to both PCII and inhibitory interneurons. The inhibitory interneuron then makes a monosynaptic inhibitory connection onto PCII. Thus the same principal cell (PCI) drives monosynaptic excitation and disynaptic inhibition onto a common PC (B and D). In feedback inhibitory circuits, the output of PCII makes a monosynaptic excitatory input onto interneurons which then return monosynaptic inhibition onto the same cell or population of cells. A, right: some interneuron subpopulations make only inhibitory connections with other interneurons. In this configuration afferent excitatory drive onto these types of interneurons drives disinhibition of principal cells by an inhibition of inhibitory input. B–D: a schematic representation of feedforward inhibitory control of the temporal window for excitation. Inset shows a hypothetical electrophysiological recording from PCII (inset). Monosynaptic excitation of the principal cells (red trace) results in a prolonged excitatory synaptic event that has a long temporal window in which to exceed threshold. The concomitant activation of the disynaptic inhibitory input (IPSP) summates with the EPSP and narrows the temporal window (black trace) for the EPSP to exceed threshold. C: under current-clamp conditions, stimulation of this feedforward inhibitory circuit triggers an early EPSP and a later IPSP, both of which are blocked by the AMPAR antagonist NBQX confirming that the EPSP-IPSP sequence is being driven by glutamatergic afferents. D: voltage traces for current-clamp recordings from CA1 PCs upon stimulation of two Schaffer collateral pathways under control (left) and in the presence of a GABAA receptor antagonist, illustrating that inhibitory input enforces a narrow temporal window for coincidence detection, which is lost in the absence of inhibitory control. [C and D from Pouille and Scanziani (922) with permission from Science.]
FIGURE 21.
FIGURE 21.
Entrainment of oscillations in CA1. CA1 pyramidal cells are important for generating theta oscillations in CA1, although fast-spiking PV basket cells play an important role in entraining CA1 network oscillations at theta frequencies. Slow gamma oscillations are driven by inputs from CA3 and, as such, show peak amplitude in stratum radiatum. The slow CA3 gamma oscillation recruits CA1 fast-spiking PV basket cells, which in turn drive slow gamma rhythms in CA1 pyramidal cells and other interneurons. Fast gamma oscillations are driven by inputs arriving from the medial entorhinal cortex and appear to drive an as yet unidentified group of interneurons that, in turn, entrain the local network to this faster rhythm. Remarkably, sharp wave-ripples can be driven by a single fast-spiking PV basket cell.
FIGURE 22.
FIGURE 22.
Firing of different interneurons during network oscillations. A: reconstruction of a CA1 PVBC recorded juxtacellularly in vivo from an awake rat. B: firing rate of CA1 PV basket cells during different network oscillations. C: reconstruction of a CA1 ivy cell recorded juxtacellularly in vivo from an awake rat. D: firing rate of CA1 ivy cells during different network oscillations. Example traces showing spiking activity of PV basket cell (E) and ivy cell (F) during sharp wave-ripple oscillations. G: preferred firing phase of CA1 interneurons during the theta cycle. Projecting interneurons are not shown, but most tend to fire around the trough of the theta cycle (537). H: preferred firing phase of CA1 interneurons during the gamma cycle. O-LM cells do not significantly phase-lock to the gamma cycle. Note that while all cell types shown have a phase preference, the depth of gamma modulation varies significantly between cell types, with the firing rate of bistratified cells being most strongly modulated by gamma (1141). [A–F adapted from Lapray et al. (635) with permission from Nature Neuroscience.]
FIGURE 23.
FIGURE 23.
Firing of CA3 CCK-positive interneurons during network oscillations. The advent of optogenetic tools and interneuron-specific Cre driver lines has led to a wealth of data on how different interneuron “subtypes” can influence behavior. However, these data, taken from juxtacellular recordings of CCK-expressing CA3 interneurons, show that cells expressing the same neuropeptides or Ca2+-binding proteins can behave very differently during rhythmic activity. A: firing pattern of a CCK-expressing basket cell relative to theta oscillations in CA1. Note that the cell tended to fire at the peak of the theta oscillation. B: juxtacellular recordings from other CCK-expressing interneurons in CA3 show that different cell types display remarkably divergent behaviors during both theta and sharp wave-ripple oscillations. [Adapted from Lasztoczi et al. (638) with permission from the Society for Neuroscience.]
FIGURE 24.
FIGURE 24.
Parvalbumin-containing interneurons in schizophrenia. One of the most consistent findings from postmortem studies of patients with psychiatric disease is a reduced density of PV interneurons in cases of schizophrenia and, to lesser extent, bipolar disorder. PV-expressing neurons from human prefrontal cortex (A) and hippocampal region CA1 (controls) (B). PV cell density is significantly reduced in prefrontal cortex (C) and hippocampus in human psychiatric disease (D). Deleting the NMDAR subunit NR1 from GAD67-expressing interneurons (including PV interneurons) early in development causes a resistance to MK801-induced hyperlocomotion (E) and a reduction in prepulse inhibition (PPI) (F), implying that reduced NMDAR function in these cells is a cause of schizophrenia-like behaviors. However, deleting NR1 from the same neurons in adulthood fails to cause the same behavioral phenotypes (G), and PV interneuron-specific deletions of NR1 fail to cause deficits in PPI (blue: controls, red: KOs) (H). Mice with PV interneuron-specific deletions of NR1 show lower levels of hyperlocomotion than controls when dosed with MK801 at both 0.2 mg/kg (I) and 0.5 mg/kg (J), but this appears to be due to these animals displaying a greater sensitivity to MK801 and spending a large amount of time in a cataleptic state. These data suggest that NMDAR hypofunction in PV-containing interneurons is not an underlying factor in schizophrenia-like behavioral deficits, but that loss of functional NMDAR in PV-containing interneurons may actually be a risk factor instead of a cause of schizophrenia, by making neural circuits more susceptible to impaired NMDAR function in other types of neuron. [A and C adapted from Beasley et al. (77), with permission from Biological Psychiatry. B and D adapted from Zhang and Reynolds (1272), with permission from Schizophrenia Research. E– G from Belforte et al. (82), with permission from Nature Neuroscience. H–K from Bygrave et al. (155), with permission from Translational Psychiatry.]
FIGURE 25.
FIGURE 25.
PV interneurons become more excitable via neuregulin1/ErbB4 signaling during epileptogenesis. A: in situ hybridization shows increased expression of neuregulin1 (NRG1) in the hours after seizure kindling or exposure to pilocarpine in rats. B and C: increased NRG1 expression is associated with increased activation of its receptor, ErbB4, measured through increased levels of phosphorylated ErbB4 (p-ErbB4). D: intracerebroventricular infusion of NRG1 delayed kindling-induced epileptogenesis. E: inhibiting ErbB4 activity with the tyrosine kinase inhibitor PD158780 exacerbated the effects of kindling. F: representative traces. G and H: deleting ErbB4 from PV interneurons is sufficient to increase susceptibility to kindling. I: the incidence of spontaneous seizures in kindled mice. J: example traces. K: NRG1 increases firing rate of PV interneurons in both cortex and hippocampus, while neutralizing endogenous NRG1 with the Ecto-ErbB4 peptide reduces the firing rate. L: example traces. M: application of NRG1 enhances initiation of action potentials in PV interneurons. N: neutralizing endogenous NRG with Ecto-ErbB4 increases K+ currents in PV interneurons, and this increase is completely blocked by the Kv1.1-specific blocker DTx-K. These data together show that NRG1 increases the excitability of PV interneurons through inhibition of Kv1.1 potassium channels, providing a homeostatic response to increase inhibition in the network during epileptogenesis. [A–J adapted from Tan et al. (1087). K–N adapted from Li et al. (674). Figures used with permission from Nature Neuroscience.]

References

    1. Abbeduto L, McDuffie A, Thurman AJ. The fragile X syndrome-autism comorbidity: what do we really know? Front Genet : 355, 2014. doi: 10.3389/fgene.2014.00355. - DOI - PMC - PubMed
    1. Abe P, Molnár Z, Tzeng YS, Lai DM, Arnold SJ, Stumm R. Intermediate Progenitors Facilitate Intracortical Progression of Thalamocortical Axons and Interneurons through CXCL12 Chemokine Signaling. J Neurosci : 13053–13063, 2015. doi: 10.1523/JNEUROSCI.1488-15.2015. - DOI - PMC - PubMed
    1. Aber KM, Nori P, MacDonald SM, Bibat G, Jarrar MH, Kaufmann WE. Methyl-CpG-binding protein 2 is localized in the postsynaptic compartment: an immunochemical study of subcellular fractions. Neuroscience : 77–80, 2003. doi: 10.1016/S0306-4522(02)00586-9. - DOI - PubMed
    1. Ackman JB, Crair MC. Role of emergent neural activity in visual map development. Curr Opin Neurobiol : 166–175, 2014. doi: 10.1016/j.conb.2013.11.011. - DOI - PMC - PubMed
    1. Acsády L, Arabadzisz D, Freund TF. Correlated morphological and neurochemical features identify different subsets of vasoactive intestinal polypeptide-immunoreactive interneurons in rat hippocampus. Neuroscience : 299–315, 1996. doi: 10.1016/0306-4522(95)00610-9. - DOI - PubMed

Publication types

MeSH terms