. 2017 Nov 15;28(24):3554-3561.
doi: 10.1091/mbc.E17-03-0198. Epub 2017 Sep 27.

Retromer stops beta-arrestin 1-mediated signaling from internalized cannabinoid 2 receptors

Affiliations

Retromer stops beta-arrestin 1-mediated signaling from internalized cannabinoid 2 receptors

Carlos Nogueras-Ortiz et al. Mol Biol Cell. .

Abstract

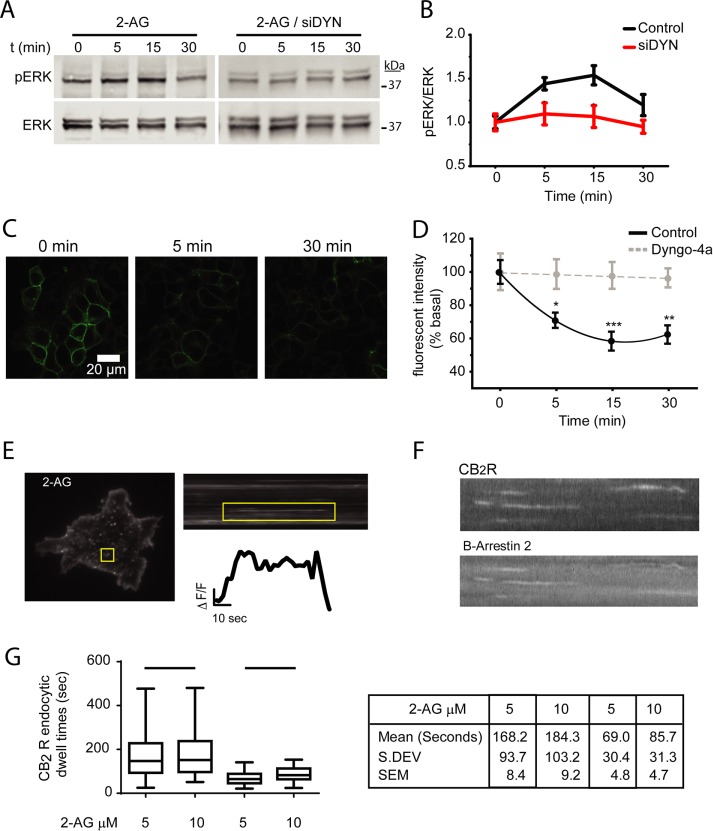
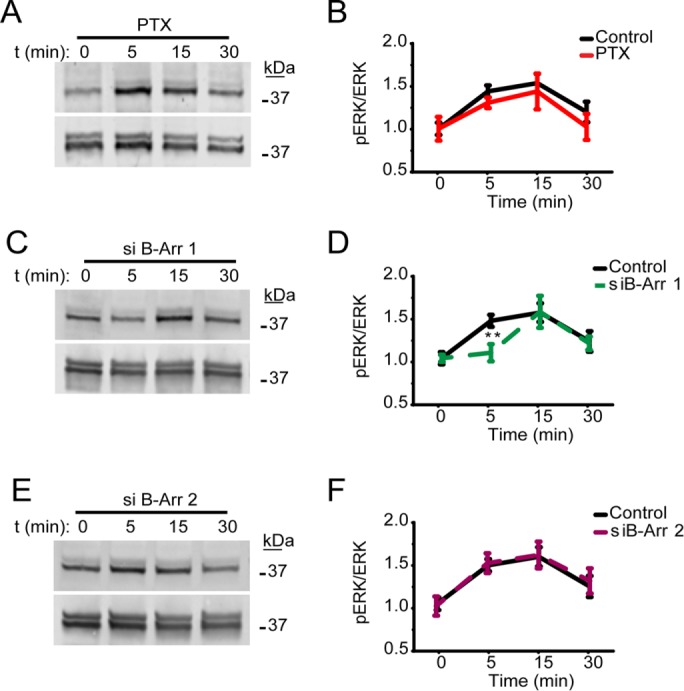
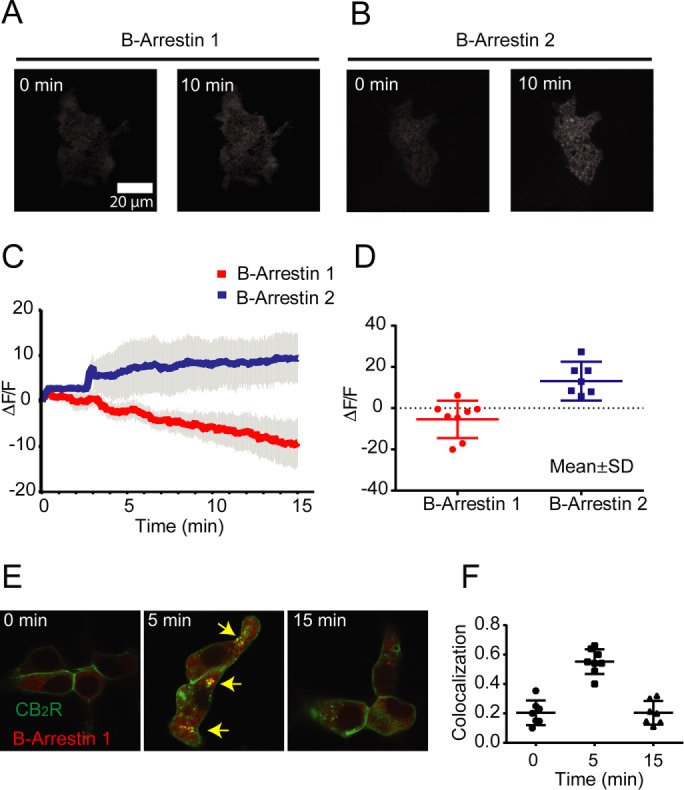
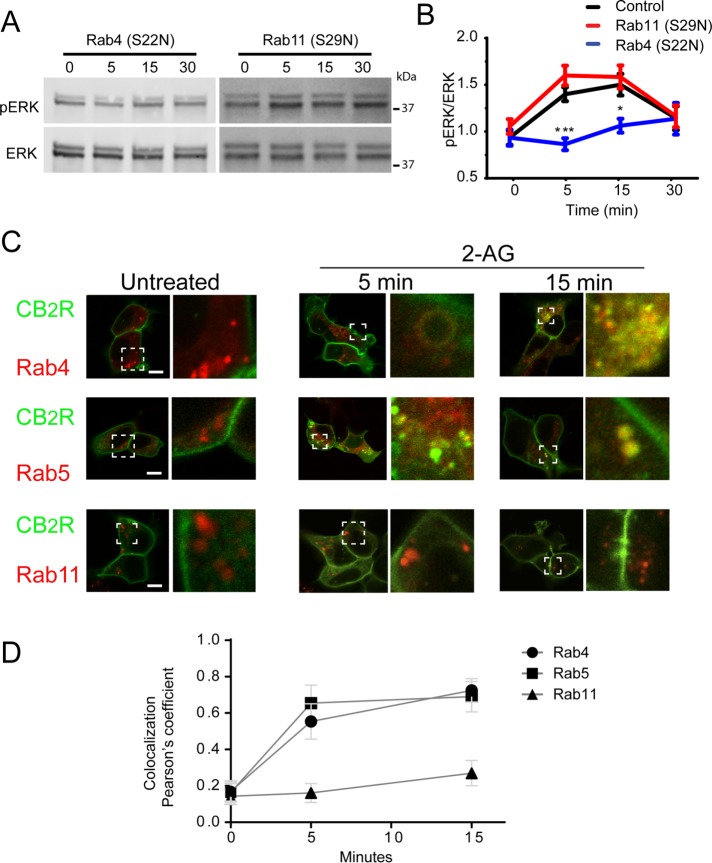
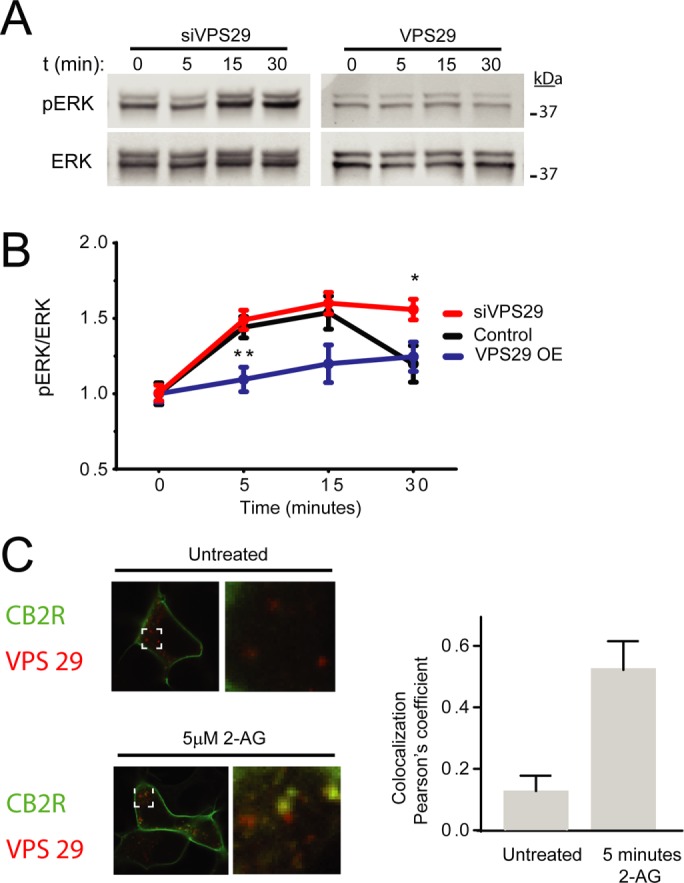
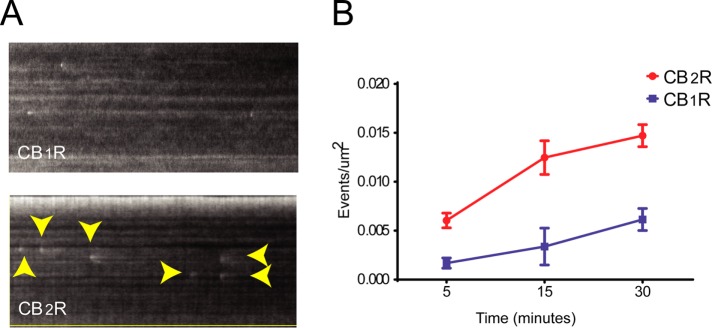
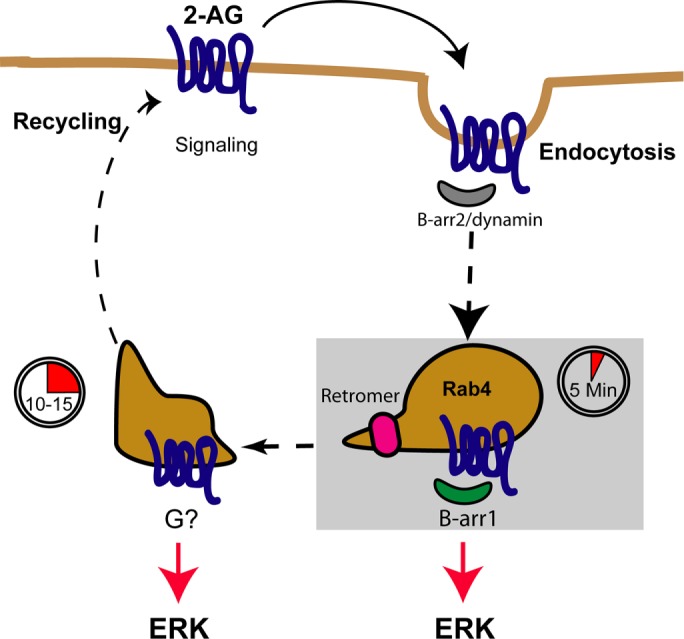
G protein-coupled receptors mediate their complex functions through activation of signaling cascades from receptors localized at the cell surface and endosomal compartments. These signaling pathways are modulated by heterotrimeric G proteins and the scaffold proteins beta-arrestin 1 and 2. However, in contrast to the events occurring at the cell surface, our knowledge of the mechanisms controlling signaling from receptors localized at intracellular compartments is still very limited. Here we sought to investigate the intracellular signaling from cannabinoid 2 receptor (CB2R). First, we show that receptor internalization is required for agonist-induced phosphorylation of extracellular signal-regulated protein kinases 1 and 2 (ERK1/2). Then we demonstrate that ERK1/2 activation is mediated by beta-arrestin 1 from receptors localized exclusively at Rab4/5 compartments. Finally, we identify the retromer complex as a gatekeeper, terminating beta-arrestin 1-mediated ERK phosphorylation. These findings extend our understanding of the events controlling signaling from endocytosed receptors and identify the retromer as a modulator of beta-arrestin-mediated signaling from CB2R.


Figures

FIGURE 1:
FIGURE 1:
Internalization is required for ERK1/2 activation. (A) Time course showing ERK1/2 phosphorylation in HEK293 cells stably expressing human SEP-CB2R exposed to 10 µM 2-AG and in cells transfected with dynamin2 siRNA. Cell lysates were analyzed using Western blots with phospho-ERK1/2 (top panel) and total ERK1/2 (bottom panel). (B) Multiple experiments were quantified and normalized to total ERK1/2 levels. Data represents the mean ± SEM at each point (n = 9–10 independent experiments). (C) HEK293 cells expressing human SEP-CB2Rs were exposed to 10 µM 2-AG and sequential confocal images were acquired. (D) Total fluorescence time-course analysis indicates there is a ligand-induced decrease in fluorescence associated with receptor internalization. The dynamin inhibitor Dyngo 4a prevented internalization (n > 5 independent experiments). (E) Total internal reflection image showing HEK293 cells expressing SEP-CB2Rs in the presence of 10 µM 2-AG. Individual endocytic events appear as bright dots (yellow box). Kymographs were obtained from sequential images and individual endocytic events were easily identifiable (yellow rectangle). (F) Fluorescence intensity measurements from individual endocytic events depicting event formation, maturation, and removal from the cell surface. (G) Analysis of multiple endocytic dwell times from SEB-CB1R and SEP-CB2R elicited by 2-AG at the indicated concentrations. Results are depicted as box-and-whiskers plots representing maximum and minimum data and adjacent table (n > 120 events, five to seven cells/analysis).
FIGURE 2:
FIGURE 2:
Activation of ERK1/2 is mediated by beta-arrestin 1 at 5 min. (A) HEK293 cells stably expressing human CB2Rs and preincubated overnight with 10 ng/ml PTX were incubated with 10 µM 2-AG. Cell lysates were analyzed by Western blots with antibodies against phospho-ERK1/2 (top panel) and total ERK1/2 (bottom panel). (B) Time course represents quantification of multiple experiments normalized to total ERK1/2 levels. Data represent the mean ± SEM at each point (n > 5 independent experiments). (C) HEK293 cells expressing human CB2R and transfected with beta-arrestin 1 siRNA were incubated with 10 µM 2-AG and compared with mock-transfected controls. (D) Multiple experiments were quantified and normalized to total ERK1/2 levels. Data indicate a significant reduction in ERK1/2 phosphorylation at the 5-min time point in cells transfected with beta-arrestin 1 siRNA (mean ± SEM at each point (n = 6). (E) HEK293 cells expressing CB2R and transfected with beta-arrestin 2 siRNA or mock controls were incubated with 10 µM 2-AG as indicated. (F) Plotted data from multiple experiments indicate no significant effects of beta-arrestin 2 siRNA (n = 6).
FIGURE 3:
FIGURE 3:
2-AG induces beta-arrestin 2 recruitment to the plasma membrane. (A) TIRFM images showing HEK293 cells stably expressing SEP-CB2R coexpressing beta-arrestin 1-mRFP before and after 10-min incubation with 10 µM 2-AG. (B) TIRFM images showing HEK293 cells stably expressing SEP-CB2R coexpressing beta-arrestin 2-mRFP before and after 10-min incubation with 10 µM 2-AG. (C) Changes in total plasma membrane fluorescence from the red channel (beta-arrestins) were continuously analyzed before and after agonist incubation by TIRM (n = 8–10 cells). (D) Quantification of multiple beta-arrestin recruitment experiments at 5 min after 10 µM 2-AG (n = 8–10 cells). (E) Confocal images of HEK293 cells expressing CB2R (green) and beta-arrestin 1 (red) before and after 2-AG incubations. (F) Pearson’s colocalization coefficients for internalized receptors with beta-arrestin 1 (individual replicates are represented, n = 7–10).
FIGURE 4:
FIGURE 4:
ERK1/2 phosphorylation occurs from CB2R localized at Rab4/5 endosomes. (A) Time course showing ERK1/2 phosphorylation in HEK293 cells stably expressing human CB2R and cotransfected with either Rab4(S22N) or Rab11(S29N) exposed to 10 µM 2-AG. Cell lysates were analyzed using western blots against phospho-ERK1/2 (top panel) and total ERK1/2 (bottom panel). (B) Multiple experiments were quantified and normalized to total ERK1/2 levels. Significant reduction of ERK1/2 phosphorylation was observed in cells expressing Rab4(S22N). Data represent the mean ± SEM at each point (n = 9–10). (C) Confocal imaging from HEK293 cells stably expressing SEP-CB2R and cotransfected with Rab4, Rab5, or Rab11 before and after incubations with 10 µM 2-AG. Each image has a white square depicting a selected region expanded on the right side (size bar = 20 µm). (D) Pearson’s colocalization coefficients for internalized receptors with Rab4, Rab5, and Rab11, were obtained from confocal images at selected time points before and after 10 µM 2-AG addition to the imaging media. (n > 7 cells/colocalization point)
FIGURE 5:
FIGURE 5:
VPS29 impacts beta-arrestin–mediated ERK1/2 activation. (A) Time course showing ERK1/2 phosphorylation in HEK293 cells stably expressing CB2R and cotransfected with either siRNA against VPS29 or wild-type VPS29 in the presence of 10 µM 2-AG. Cell lysates were analyzed by Western blots against phospho-ERK1/2 (top panel) and total ERK1/2 (bottom panel). (B) Quantification of multiple time courses revealed significant effects of VPS29 siRNA and VPS29 overexpression in ERK1/2 phosphorylation. Data represent the mean ± SEM at each point (n = 7–10 independent experiments). (C) Confocal imaging of HEK293 cells stably expressing CB2Rs and transfected with VPS29 mCherry before and after 5 min 10 µM 2-AG. Pearson’s colocalization coefficient was calculated from several independent experiments at 5 min.
FIGURE 6:
FIGURE 6:
CB2R recycling to the cell surface. (A) HEK cells stably expressing SEP-CB2R or SEP-CB1R were incubated with 10 µM 2-AG and imaged under TIRFM at time intervals as described under Materials and Methods. Kymographs depict single cells over time, where individual exocytic events are visible (arrowheads). (B) Individual exocytic events were quantified on multiple individual experiments and normalized to surface area (n = 10–12 cells).
FIGURE 7:
FIGURE 7:
CB2R trafficking and signaling model. Cartoon depicting CB2R signaling at the cell surface. After agonist addition, receptors signal via G proteins and are rapidly recruited into endocytic pits together with beta-arrestin 2 for internalization. Receptor removal from the cell surface by endocytosis requires dynamin and occurs more rapidly than CB1R. After internalization, CB2R colocalizes to Rab4/5 endosomes within 5 min of ligand exposure, resulting in beta-arrestin 1 recruitment and signaling. Beta-arrestin 1–mediated signaling is terminated when receptors traverse the retromer into other endosomal compartment, most likely on their way toward the cell surface for recycling. In this undefined compartment, ERK1/2 is also activated via an unknown mechanism.

Similar articles

Cited by

References

    1. Ahn KH, Mahmoud MM, Shim J-Y, Kendall DA. Distinct roles of β-arrestin 1 and β-arrestin 2 in ORG27569-induced biased signaling and internalization of the cannabinoid receptor 1 (CB1) J Biol Chem. 2013;288:9790–800. - PMC - PubMed
    1. Atwood BK, Mackie K. CB2: a cannabinoid receptor with an identity crisis. Br J Pharmacol. 2010;160:467–479. - PMC - PubMed
    1. Atwood BK, Wager-Miller J, Haskins C, Straiker A, Mackie K. Functional selectivity in CB2 cannabinoid receptor signaling and regulation: implications for the therapeutic potential of CB2 ligands. Mol Pharmacol. 2012;81:250–263. - PMC - PubMed
    1. Benito C, Tolón RM, Pazos MR, Núñez E, Castillo AI, Romero J. Cannabinoid CB2 receptors in human brain inflammation. Br J Pharmacol. 2008;153:277–285. - PMC - PubMed
    1. Bouaboula M, Poinot-Chazel C, Marchand J, Canat X, Bourrié B, Rinaldi-Carmona M, Calandra B, Le Fur G, Casellas P. Signaling pathway associated with stimulation of CB2 peripheral cannabinoid receptor. Eur J Biochem. 1996;237:704–711. - PubMed

MeSH terms

LinkOut - more resources