. 2018 Jan 1;119(1):145-159.
doi: 10.1152/jn.00551.2017. Epub 2017 Sep 27.

Breathing above the brain stem: volitional control and attentional modulation in humans

Affiliations

Breathing above the brain stem: volitional control and attentional modulation in humans

Jose L Herrero et al. J Neurophysiol. .

Abstract

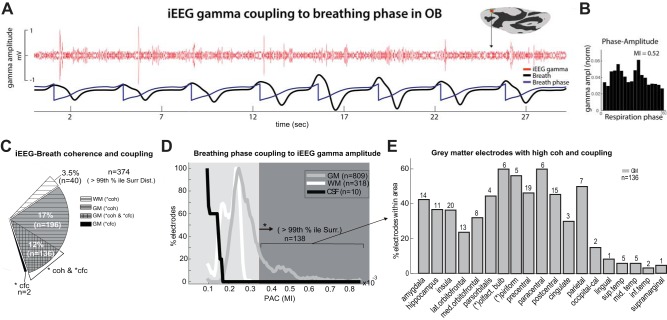
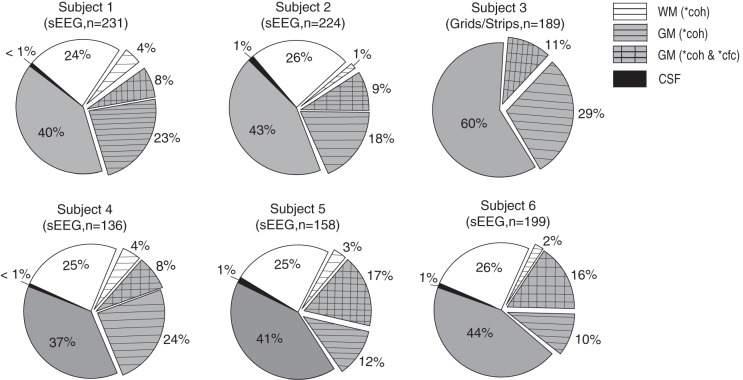
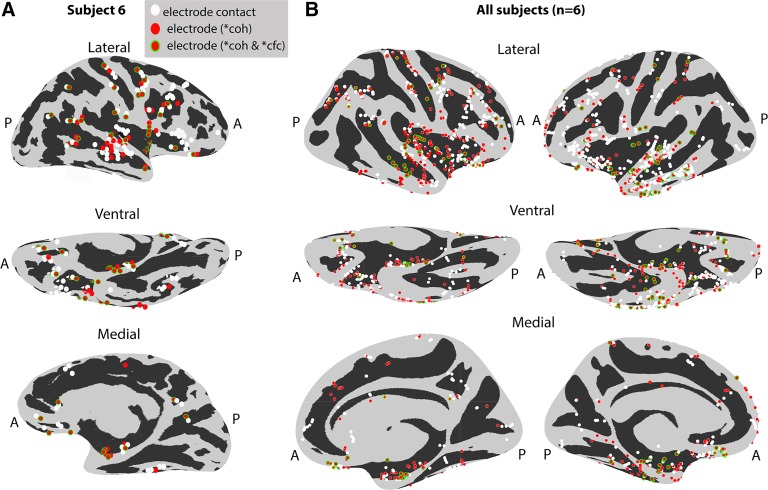
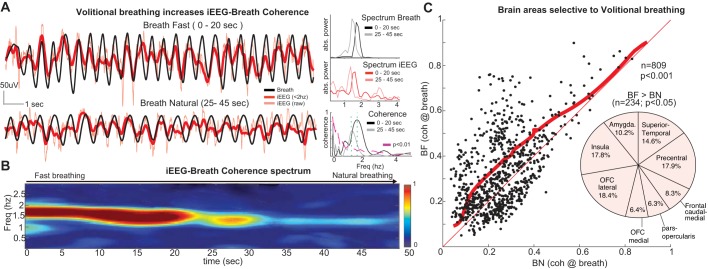
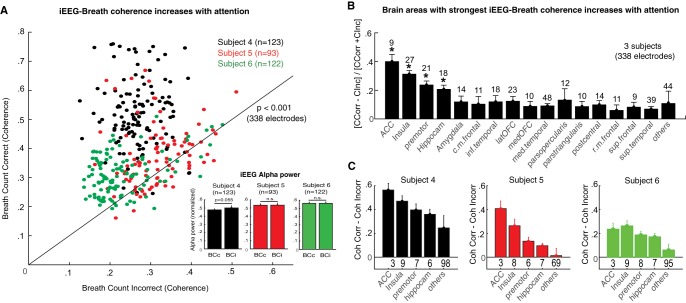
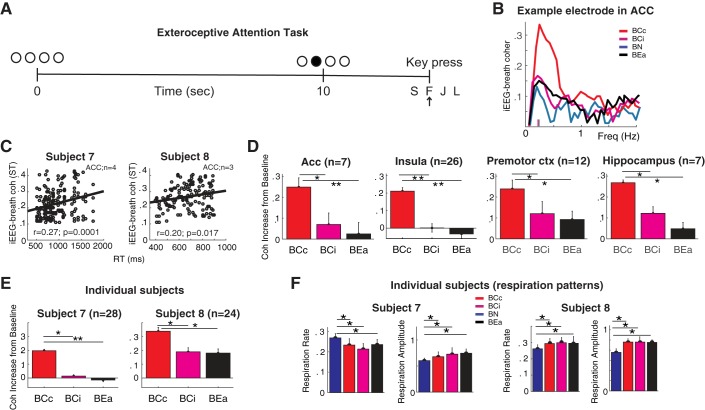
Whereas the neurophysiology of respiration has traditionally focused on automatic brain stem processes, higher brain mechanisms underlying the cognitive aspects of breathing are gaining increasing interest. Therapeutic techniques have used conscious control and awareness of breathing for millennia with little understanding of the mechanisms underlying their efficacy. Using direct intracranial recordings in humans, we correlated cortical and limbic neuronal activity as measured by the intracranial electroencephalogram (iEEG) with the breathing cycle. We show this to be the direct result of neuronal activity, as demonstrated by both the specificity of the finding to the cortical gray matter and the tracking of breath by the gamma-band (40-150 Hz) envelope in these structures. We extend prior observations by showing the iEEG signal to track the breathing cycle across a widespread network of cortical and limbic structures. We further demonstrate a sensitivity of this tracking to cognitive factors by using tasks adapted from cognitive behavioral therapy and meditative practice. Specifically, volitional control and awareness of breathing engage distinct but overlapping brain circuits. During volitionally paced breathing, iEEG-breath coherence increases in a frontotemporal-insular network, and during attention to breathing, we demonstrate increased coherence in the anterior cingulate, premotor, insular, and hippocampal cortices. Our findings suggest that breathing can act as an organizing hierarchical principle for neuronal oscillations throughout the brain and detail mechanisms of how cognitive factors impact otherwise automatic neuronal processes during interoceptive attention. NEW & NOTEWORTHY Whereas the link between breathing and brain activity has a long history of application to therapy, its neurophysiology remains unexplored. Using intracranial recordings in humans, we show neuronal activity to track the breathing cycle throughout widespread cortical/limbic sites. Volitional pacing of the breath engages frontotemporal-insular cortices, whereas attention to automatic breathing modulates the cingulate cortex. Our findings imply a fundamental role of breathing-related oscillations in driving neuronal activity and provide insight into the neuronal mechanisms of interoceptive attention.

Keywords: cortical control of breathing; interoceptive attention to breathing; intracranial EEG; mind-body; oscillations.


Figures

Fig. 1.
Fig. 1.
Electrode localization in 2 representative patients. Two methods of electrode survey are used. A: CT (left). Postoperative skull radiograph is from 1 subject implanted with 20 stereo-depth EEG (sEEG) electrode arrays. Of the 320 contacts implanted in this subject, 231 were analyzed for breathing-related activity because they were outside the seizure onset zone and provided artifact-free signals. Right, MRI image of the same patient, showing 2 electrode arrays with the deepest contacts (1–4) in the hippocampi (red), superficial electrodes in the superior temporal gyrus (green), and a number of intervening electrodes lying in the white matter. B: CT (left). Lateral view of head radiograph is from the 1 subject who was implanted with subdural ECoG grids and strips. Right, MRI reconstruction showing the location of the electrodes on a parcellated brain (FreeSurfer; Dale et al. 1999; Fischl et al. 1999).
Fig. 2.
Fig. 2.
Coherence between the intracranial EEG (iEEG) and the breathing during natural respiration. A: iEEG (red lines) and breathing signals (black lines) during a representative 30-s period during natural respiration for 2 sample electrodes: one in the hippocampus (top), which shows strong phase-locked signals, and another in the white matter (bottom) showing negligible phase locking. B, top: power spectrum of the manometric breathing signal (black line) and the hippocampal iEEG trace (red line), both with peaks at 0.28 Hz. The iEEG shows an additional peak at 1.33 Hz. Bottom, power spectrum for an electrode in the adjacent white matter showing no such peak at the breathing rate. C, top: coherence between respiration and hippocampal signals. The coherence value at the 0.28-Hz respiratory rate (dashed green lines) was significant (coherence value = 0.62, P = 0.0001). Significance (magenta dash line) was evaluated by performing bootstrap analysis shuffling iEEG and breathing signals (1,000 iterations, P < 0.01). Bottom: iEEG-breath coherence from an electrode in the white matter. The coherence value at the breathing frequency (dashed green line) was not significant (coherence value = 0.02, P = 0.44). abs., Absolute; a.u., arbitrary units; RR, respiratory rate.
Fig. 3.
Fig. 3.
A: iEEG-breath coherence in gray matter (GM), white matter (WM), and cerebrospinal fluid (CSF). Pie chart shows the total number of electrodes (n = 1,137 in 6 subjects) and the electrodes that showed iEEG-breath coherence greater than 99th percentile of the surrogate distribution derived from shifting the respiration signal with respect to the iEEG [asterisk indicates coherence >99% percentile; n = 374 (32.9%), horizontal hatching]. Most of the electrodes with greater coherence were in gray matter. B: distribution of coherence values at the respiratory rate across the population of GM, WM, and CSF electrodes as a percentage of the total of each. Coherence values were larger in most electrodes located in the GM than those in WM and CSF. Values (y-axis) were smoothed (0.02 window width) before being plotted and are normalized (norm) for each area (GM, WM, or CSF) separately. Dark gray area shows coherence greater than 99th percentile (n = 374). GM sites show a bimodal distribution, with one population showing higher local mode at 0.25 and the other at a mode close to that of the WM and CSF at 0.12. coh, Coherence value; 99% ile Surr Dist., >99th percentile of the surrogate distribution.
Fig. 4.
Fig. 4.
Percentage of gray matter electrodes within each brain area showing iEEG-breath coherence above the threshold (99th percentile). Numbers above each bar represent the total number of electrodes within that area showing the effect. Asterisks indicate electrode locations after correction using FreeSurfer parcellation (see materials and methods). Cuneus-calc-occipi, cuneus-calcarine-occipital.
Fig. 5.
Fig. 5.
Breathing-phase coupling to gamma-amplitude oscillations. A: sample electrode in the olfactory bulb (OB) exhibiting bursts of broadband signal (40–150 Hz) at specific phases of the respiratory cycle, particularly during the beginning and end of exhalation during natural breathing. B: gamma-band amplitude at different phases of the breathing signal (18 bins of 20° width each) for this sample electrode averaged across an 8-min period. C: iEEG-breath coherence and cross-frequency coupling in GM, WM, and CSF. Pie chart shows the percentage of electrodes exhibiting large coherence values (>99th percentile; horizontal hatching) as well as cross-frequency coupling (cross-hatching), and cross-frequency coupling alone (black) across the population (n = 1,137 electrodes). D: distribution of modulation indexes (MIs) across the population of GM, WM, and CSF electrodes. Lines represent raw MIs after smoothing (window width = 0.02). MIs were smaller in electrodes located in the CSF and WM compared with electrodes in the GM. Only 138/1,137 (12.2%) of the electrodes showed MIs above the threshold, all located in the GM. The threshold (dark gray area) was the 99th percentile of the surrogate MI distribution derived from shifting the respiration signal with respect to the iEEG (as indicated by asterisk). The y-axis represents electrode percentages normalized with respect to each area (GM, WM, and CSF), separately. E: percentage of GM electrodes within each brain area that showed both MIs and coherence values above the threshold. Up to 40% of the electrodes that were in the amygdala, hippocampus, insula, motor, parietal, and primary olfactory cortices showed increased gamma-amplitude oscillations at specific phases of the respiratory cycle. cfc,  cross-frequency coupling; coh, coherence; PAC, phase-amplitude coupling; lat., lateral; med., medial; olfact., olfactory; occipital-cal, occipital-calcarine; sup. temp, superior temporal; mid. temp, middle temporal; inf, inferior.
Fig. 6.
Fig. 6.
Electrode sampling and effects in 6 individual subjects (n = total number of electrodes analyzed in each subject after electrodes were removed from the SOZ). Subject 3 was implanted with grids and strips and consequently had no electrodes in the WM or the CSF. The remaining subjects were implanted with depth (sEEG) electrodes. Each sEEG subject had electrodes implanted in the WM and the CSF. Pie charts show the percentage of electrodes with high iEEG-breath coherence (horizontal hatching; >99th percentile of surrogate distribution) and the percentage of electrodes with high iEEG-breath coherence as well as phase-gamma amplitude coupling (cross-hatching; >99th percentile). Only 2 electrodes showed high phase-amplitude coupling and low coherence (1 electrode in each of subjects 1 and 2; data not shown). coh, iEEG-breath coherence; cfc, cross-frequency coupling of iEEG-gamma amplitude to respiration phase. Asterisk indicates >99th percentile of the surrogate distribution.
Fig. 7.
Fig. 7.
Coherence and cross-frequency coupling effects localized on inflated brain surfaces. A: representative subject’s inflated brain. Electrodes with high coherence (red) as well as cross-frequency coupling (red with green outline) are displayed in 3 different brain views (lateral, ventral, and medial). Other electrodes (white) had values below the 99th percentile threshold. B: electrodes from 6 subjects registered onto a common brain surface (see materials and methods). Electrodes with high coherence and cross-frequency coupling are broadly distributed across multiple brain areas. A, anterior; P, posterior. Asterisk indicates >99th percentile of the surrogate distribution.
Fig. 8.
Fig. 8.
Volitional breathing increases iEEG-breath coherence and recruits frontal networks. A, left: raw iEEG (red) and manometric respiration signals (black) from a sample electrode in the caudal medial frontal cortex during fast breathing (top; 0–20 s) followed by the transition to natural breathing (bottom; 25–45 s). Note the larger amplitude and faster frequency in both iEEG and breathing signals during the initial hyperventilation period, as well as the stronger iEEG-breath phase locking. Right, plots show the power spectrum peaks at 1.7 Hz during hyperventilation and at 1.4 Hz during transition to natural breathing for the respiration signal (top; black lines) and the iEEG signals (middle; red lines), as well as the iEEG-breath coherence (bottom). The coherence peak at the breathing rate (green dashed lines) is smaller when the subject breathes more slowly (gray line). B: time-frequency coherence spectrum between the signals shown in A. The peak in the spectrum closely follows the respiration rate. C: iEEG-breath coherence at the respiration rate for all electrodes in the gray matter (n = 809) during fast breathing (BF; vertical axis) and natural breathing (BN; horizontal axis). Coherence values were significantly increased across the population during fast breathing (P < 0.001, Wilcoxon signed-rank test). Thick red line shows the significance threshold (P < 0.05, bootstrapping method, 95% percentile) with 234/809 electrodes above the line showing significantly increased coherence values. Thin red line represents unity. Pie chart shows the locations of those 234 electrodes within the gray matter where coherence was significantly larger during fast breathing vs. natural breathing. Note the large proportion of electrodes in frontal areas, including caudal medial frontal cortex. Freq, frequency; OFC, orbitofrontal cortex.
Fig. 9.
Fig. 9.
Attention to breathing increases iEEG-breath coherence in brain areas related to interoception. A: iEEG-breath coherence values at the respiratory rate during correctly (y-axis) and incorrectly (x-axis) reported breath-counting periods across the population of gray matter electrodes (n = 338 in 3 subjects). Values were increased during correct periods in the 3 subjects collectively (P < 0.001, Wilcoxon’s signed-rank test) and in each subject separately. Black line represents unity. Inset: normalized iEEG alpha power for the 2 conditions and 3 subjects averaged across electrodes sites. None of the subjects showed significant differences between correct and incorrect reports, although there was a trend in subject 4 (P = 0.055) with slightly larger alpha power during incorrect reports. B: distribution of the effect across brain areas. Graph shows mean normalized differences in coherence between correctly and incorrectly reported counting periods. To normalize coherence values across subjects, the difference between correct and incorrect blocks for each subject was divided by their sum. Numbers above bars represent the total number of electrodes within the indicated area. C: coherence values in each subject and brain area (coherence correct – coherence incorrect). The strongest effect was observed in the anterior cingulate cortex, insula, premotor cortex, and hippocampus, and this pattern was consistent across subjects. Other brain areas showed smaller effects. *P < 0.05. Acc, anterior cingulate cortex. Bars indicate means, and error bars indicate SE.
Fig. 10.
Fig. 10.
Increased iEEG-breath coherence through attention is distinct from arousal. A: exteroceptive attention task. Subjects pressed the appropriate key to signal a luminance change. B: example electrode in the Acc: iEEG-breath coherence increases with effective interoceptive attention to the breath (breath count correct, BCc; red) but remains near natural breathing baseline (breath natural, BN; blue) when attention to the breath is not effective (breath count incorrect, BCi; magenta) or when attention is exteroceptively directed (breath exteroceptive attention, BEa; black). Small vertical lines in x-axis indicate respiratory rate. C: correlation between iEEG-breath coherence and reaction time in Acc for each subject: trials with slow reaction times showed larger iEEG-breath coherence. D: population (2 subjects) iEEG-breath coherence values for the different breathing conditions and brain areas. Values were normalized by the coherence during natural breathing for each electrode site. In all 4 areas examined, BCc was significantly higher than BCi and BEa. E: individual subjects’ iEEG-breath coherence values for the different breathing conditions averaged across brain areas. F: respiration rate and amplitude in the same 2 subjects.

References

    1. Aleksandrov VG, Aleksandrova NP, Bagaev VA. Identification of a respiratory related area in the rat insular cortex. Can J Physiol Pharmacol 78: 582–586, 2000. doi:10.1139/y00-031. - DOI - PubMed
    1. Başar E, Başar-Eroglu C, Karakaş S, Schürmann M. Gamma, alpha, delta, and theta oscillations govern cognitive processes. Int J Psychophysiol 39: 241–248, 2001. doi:10.1016/S0167-8760(00)00145-8. - DOI - PubMed
    1. Biskamp J, Bartos M, Sauer JF. Organization of prefrontal network activity by respiration-related oscillations. Sci Rep 7: 45508, 2017. doi:10.1038/srep45508. - DOI - PMC - PubMed
    1. Boiten FA. The effects of emotional behaviour on components of the respiratory cycle. Biol Psychol 49: 29–51, 1998. doi:10.1016/S0301-0511(98)00025-8. - DOI - PubMed
    1. Borchers S, Hauser TK, Himmelbach M. Bilateral hand representations in human primary proprioceptive areas. Neuropsychologia 49: 3383–3391, 2011. doi:10.1016/j.neuropsychologia.2011.08.013. - DOI - PubMed

Publication types

LinkOut - more resources