. 2017 Sep 27;8(1):710.
doi: 10.1038/s41467-017-00813-z.

MicroRNA-9 downregulates the ANO1 chloride channel and contributes to cystic fibrosis lung pathology

Affiliations

MicroRNA-9 downregulates the ANO1 chloride channel and contributes to cystic fibrosis lung pathology

Florence Sonneville et al. Nat Commun. .

Abstract

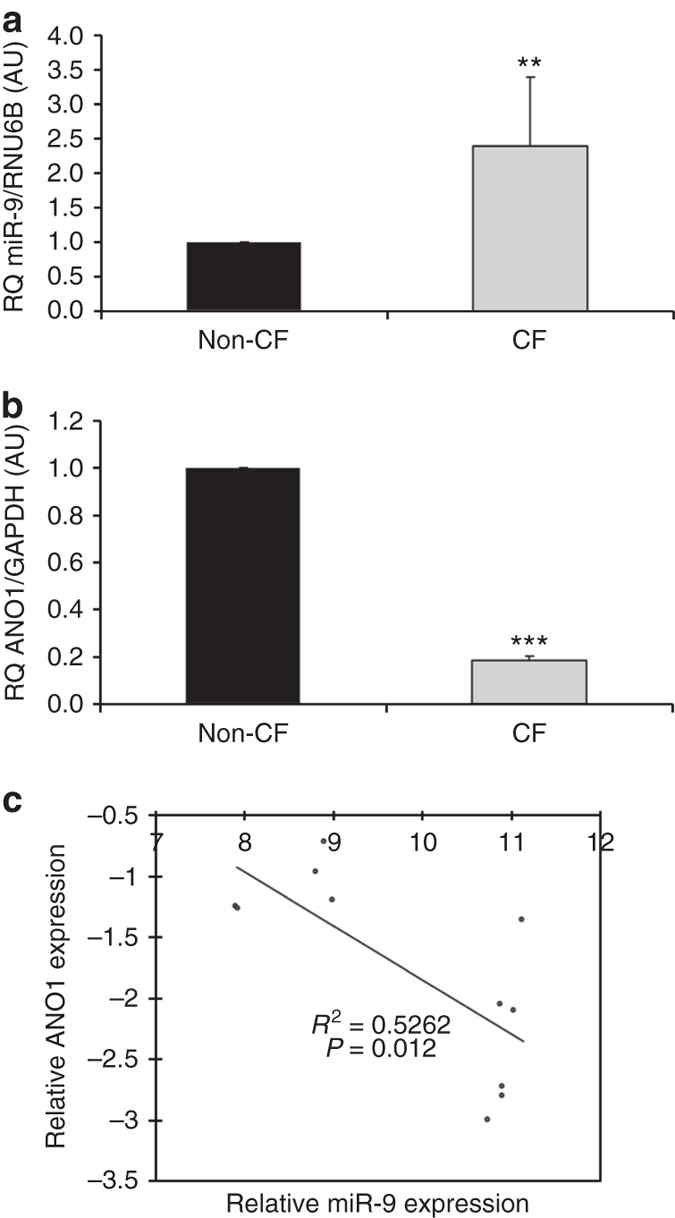
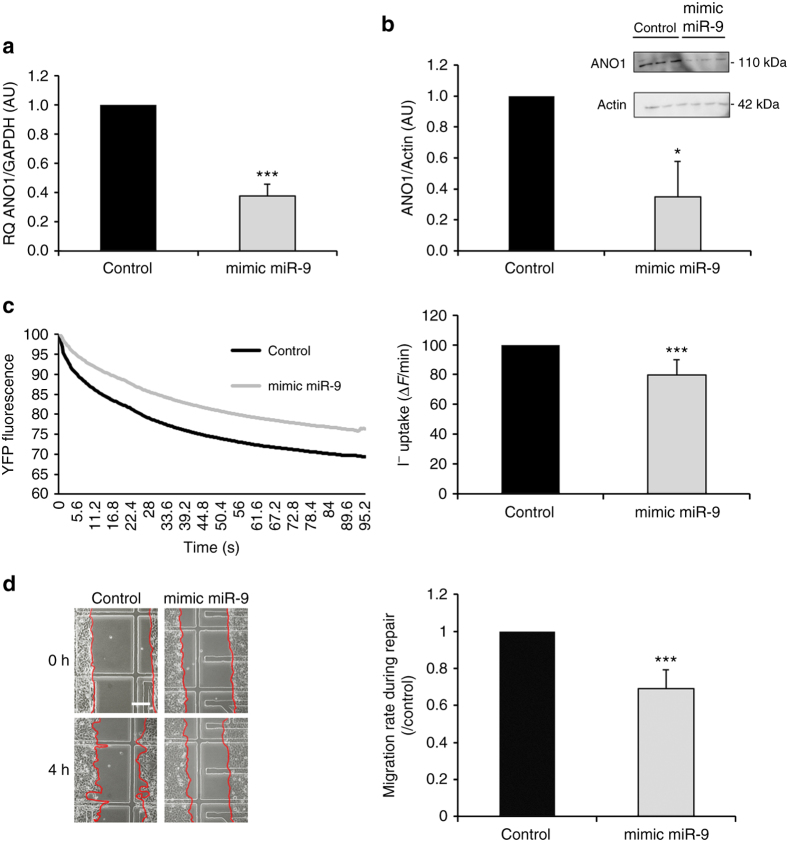
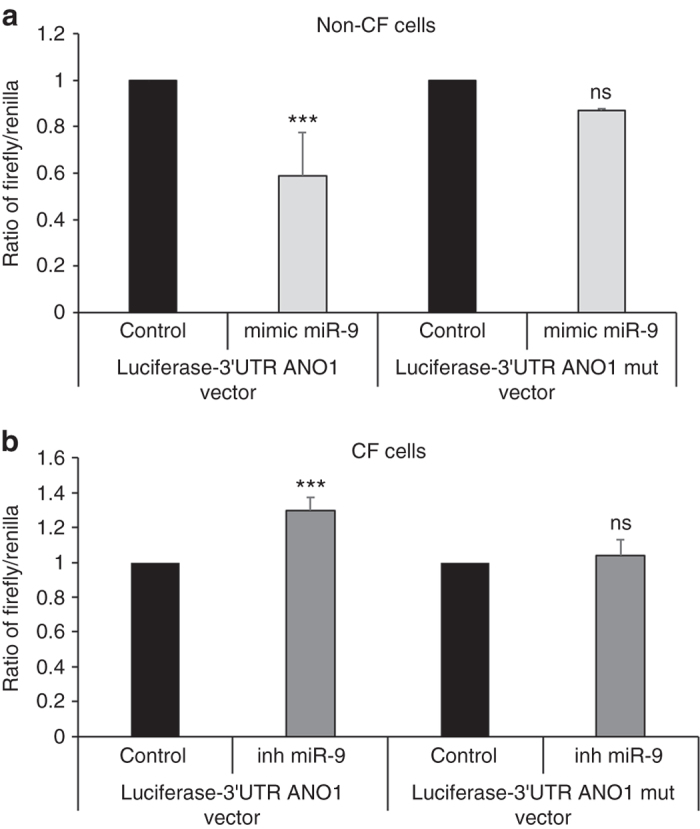
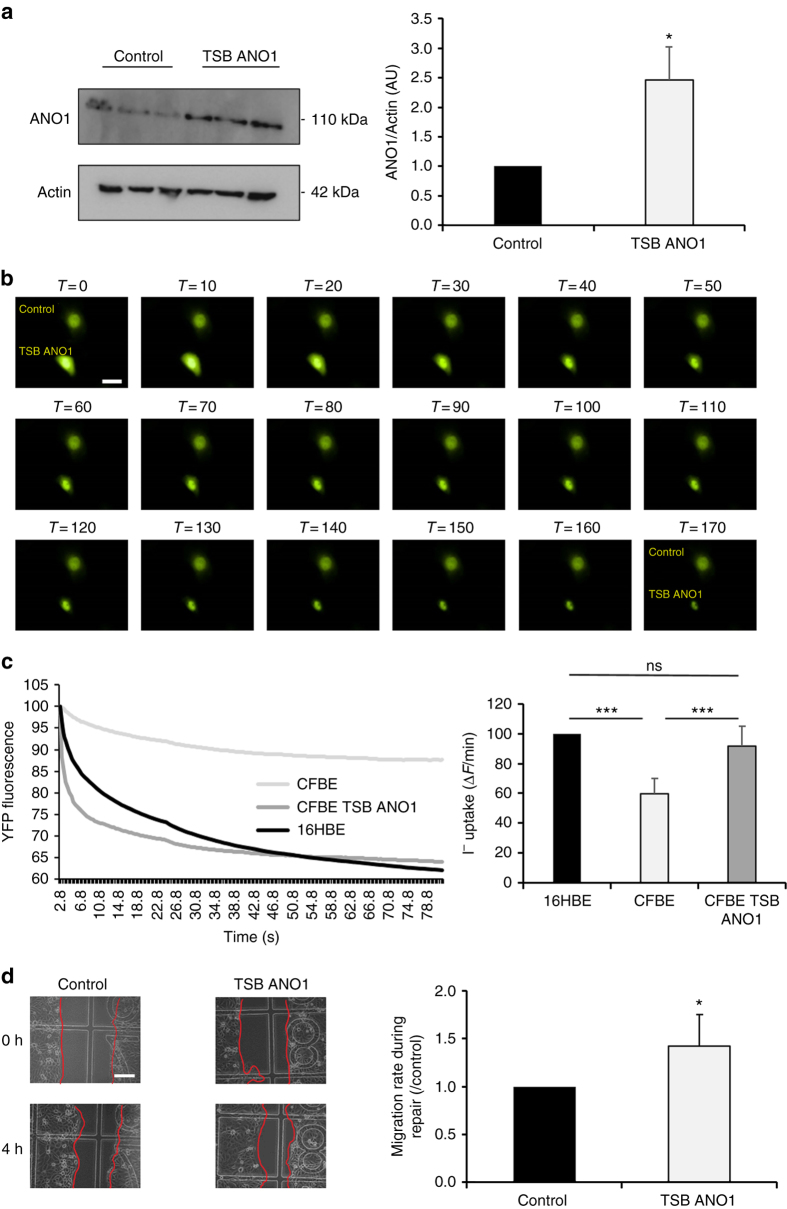
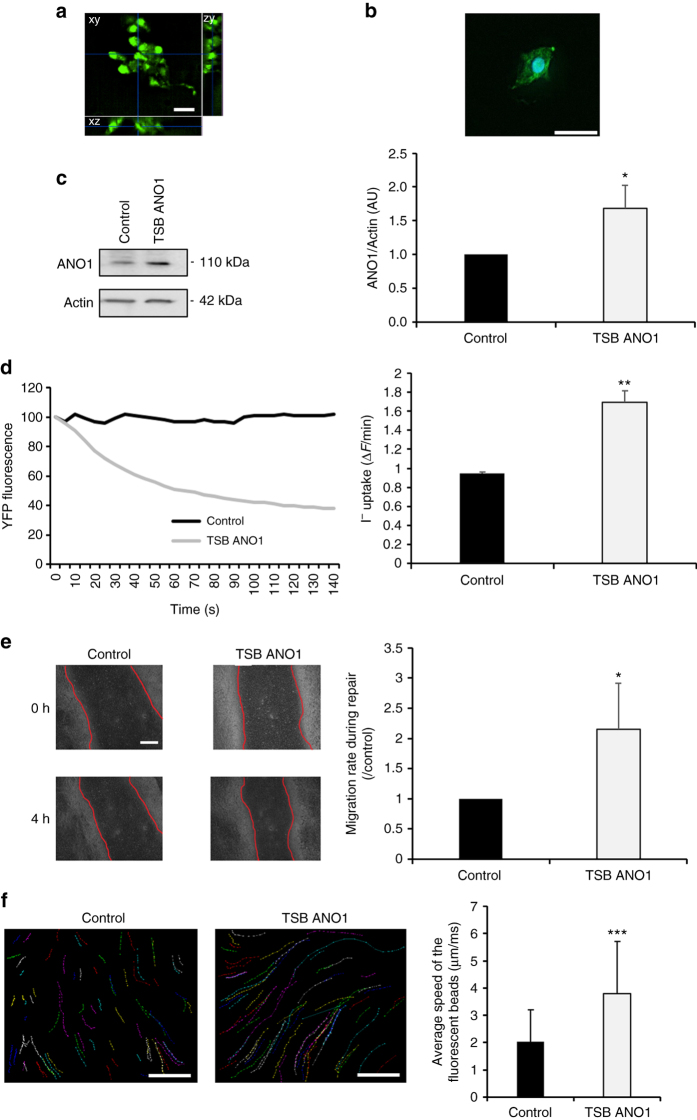
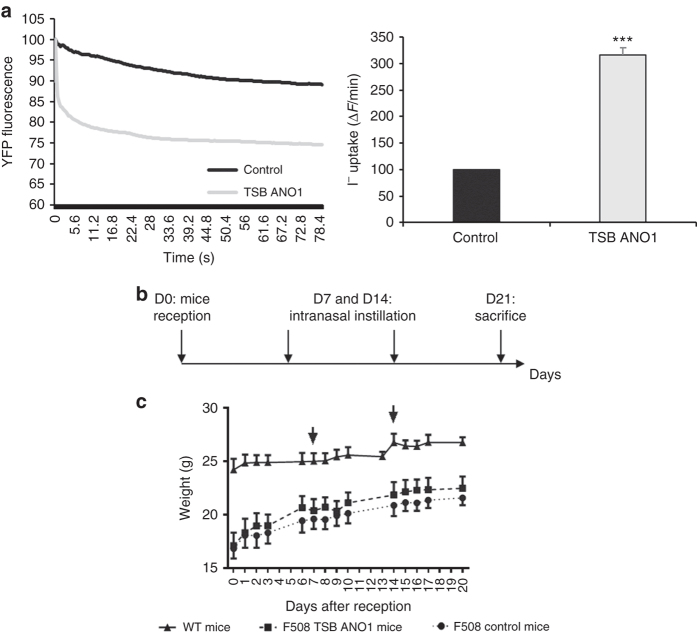
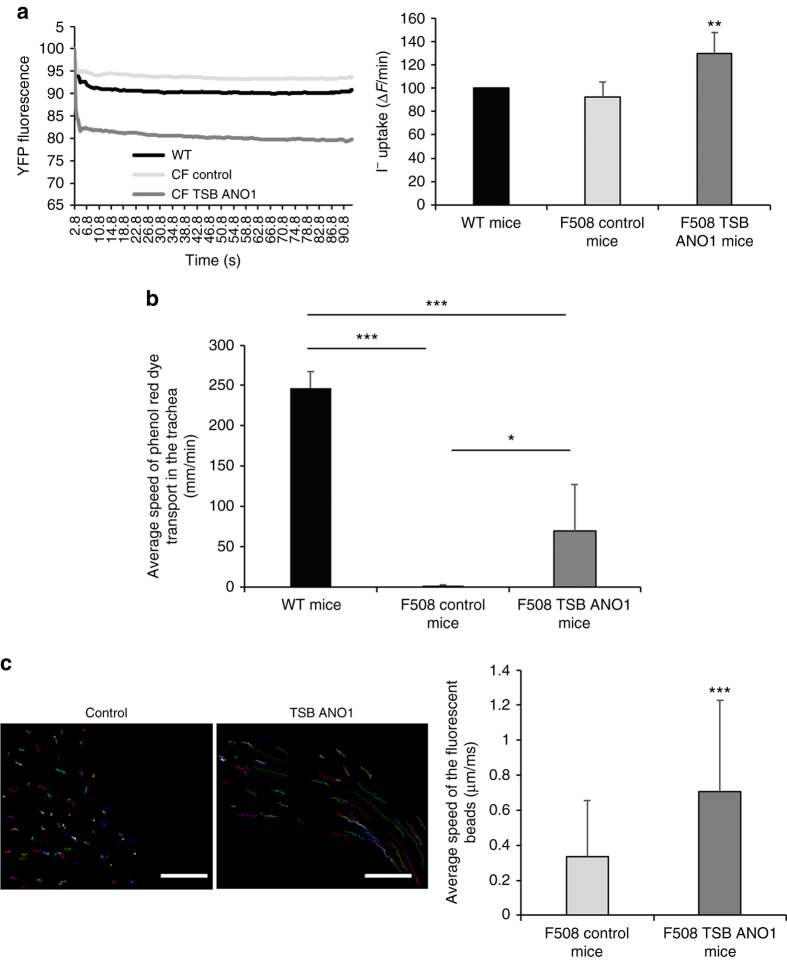
Cystic fibrosis results from reduced cystic fibrosis transmembrane conductance regulator protein activity leading to defective epithelial ion transport. Ca2+-activated Cl- channels mediate physiological functions independently of cystic fibrosis transmembrane conductance regulator. Anoctamin 1 (ANO1/TMEM16A) was identified as the major Ca2+-activated Cl- channel in airway epithelial cells, and we recently demonstrated that downregulation of the anoctamin 1 channel in cystic fibrosis patients contributes to disease severity via an unknown mechanism. Here we show that microRNA-9 (miR-9) contributes to cystic fibrosis and downregulates anoctamin 1 by directly targeting its 3'UTR. We present a potential therapy based on blockage of miR-9 binding to the 3'UTR by using a microRNA target site blocker to increase anoctamin 1 activity and thus compensate for the cystic fibrosis transmembrane conductance regulator deficiency. The target site blocker is tested in in vitro and in mouse models of cystic fibrosis, and could be considered as an alternative strategy to treat cystic fibrosis.Downregulation of the anoctamin 1 calcium channel in airway epithelial cells contributes to pathology in cystic fibrosis. Here the authors show that microRNA-9 targets anoctamin 1 and that inhibiting this interaction improves mucus dynamics in mouse models.


Conflict of interest statement

F.S. and O.T. own a patent application related to the findings described herein (PCT/FR2015/051850). The remaining authors declare no competing financial interests.

Figures

Fig. 1
Fig. 1
Correlation of downregulation of ANO1 mRNA and upregulation of miR-9. a miR-9 expression in non-CF (16HBE14o-; n = 5) and CF (CFBE41o-; n = 6) bronchial epithelial cell lines measured by qRT-PCR. Relative expression levels were normalized to those of RNU6B. Data are presented as the mean ± SD and were compared using Student’s t-test. All qRT-PCR experiments were performed in triplicate. b Relative expression levels of ANO1 mRNA in non-CF (16HBE14o-; n = 5) and CF (CFBE41o-; n = 6) human bronchial epithelial cells normalized to GAPDH. Data are quantified by qRT-PCR and are presented as a fold-change compared to normalized controls. Data are presented as the mean ± SD and were compared using Student’s t-test. All qRT-PCR experiments were performed in triplicate. c Pearson’s correlation analysis showed a negative correlation between miR-9 and ANO1 mRNA expression levels in non-CF and CF bronchial epithelial cell lines (P = 0.012)
Fig. 2
Fig. 2
miR-9 regulates ANO1 expression, ANO1 chloride activity, and non-CF cells migration. Non-CF cells (16HBE14o-) were transfected with a miR-9 mimic (30 nM) or a negative control for 48 h. a ANO1 mRNA expression was analyzed by RT-qPCR and normalized to GAPDH (n = 3). Data are presented as the mean ± SD and were compared using Student’s t-test. All qRT-PCR experiments were performed in triplicate. b ANO1 protein expression was analyzed by western blotting using anti-ANO1 antibody and normalized to β-actin (n = 3, in triplicates). Data are presented as the mean ± SD and were compared using Student’s t-test. c ANO1 chloride channel activity assessed by I quenching of halide-sensitive YFP-H148q/I152L protein. Representative and original traces of ANO1 chloride activity (left) and quantification (right) of non-CF cells transfected with a miR-9 mimic or negative control (n = 8, in triplicates). Data are presented as the mean ± SD and were compared using Student’s t-test. d Representative images were taken during 4 h of wound closure of non-CF cells transfected with a miR-9 mimic or a negative control (left) and quantification of the migration rates during repair (n = 5). Data are presented as the mean ± SD and were compared using Student’s t-test
Fig. 3
Fig. 3
miR-9 directly targets ANO1 3′UTR in non-CF and CF cells. a Relative luciferase activity in non-CF cells (16HBE14o-) transiently transfected with a luciferase-3′UTR ANO1 vector or a luciferase-3′UTR ANO1 vector mutated at miR-9-binding sites and co-transfected with a miR-9 mimic or a negative control (control). Firefly luciferase activity was normalized to Renilla luciferase activity (n = 3, with 8 replicates). Histograms represent average values ± SDs and were compared using Student’s t-test. b Relative luciferase activity in CF cells (CFBE41o-) transiently transfected with luciferase-3′UTR ANO1 or luciferase-3′UTR ANO1 mutated at miR-9-binding sites and cotransfected with an inhibitor of miR-9 (inh miR-9) or a negative control (control). Firefly luciferase activity was normalized to Renilla luciferase activity (n = 3, with 8 replicates). Histograms represent average values ± SDs and were compared using Student’s t-test
Fig. 4
Fig. 4
miR-9-specific TSB increases ANO1 expression, chloride activity, and migration rate. CF cells (CFBE41o-) were transfected with TSB control (control) or ANO1 TSB for 24 h. a ANO1 protein expression was analyzed and quantified by western blotting using anti-ANO1 antibody. β-actin was used for normalization. (n = 4, in triplicates). Histograms represent average values ± SDs and were compared using Student’s t-test. b Kinetics of YFP-H148Q/I152L protein quenching after addition of I to the medium. Twenty-four hours after transfection with YFP-H148Q/I152L plasmid, cells were selectively microinjected with TSB control or ANO1 TSB as indicated. Scale bar 5 µm. c Representative and original traces of ANO1 channel activity (left) and quantification (right) of CF bronchial epithelial cells transfected with ANO1 TSB or a negative control (n = 8, in triplicates) as compared to non-CF cells (16HBE14o-). Histograms represent average values ± SDs and the conditions were compared using ANOVA coupled with Dunnett’s, Bonferroni’s and Tukey’s post hoc test. d Migration rates during repair of CF cells. Representative images were taken during 4 h of wound closure of CF cells (left) and migration rates were quantification (right) (n = 5). Scale bar 10 µm. Histograms represent average values ± SDs and were compared using Student’s t-test
Fig. 5
Fig. 5
miR-9-specific TSB restores deficient parameters in primary CF cells. Primary hAECB and fully differentiated human bronchial air–liquid-interface cultures, isolated from bronchial biopsies from CF (F508del/F508del) patients were transfected with TSB control (control) or ANO1 TSB every day during 3 days. a Confocal microscopic analysis of fluorescein-conjugated TSB transfected into human bronchial cells isolated from CF patients (green). Cells were cultured in ALI and transfected for 24 h. b Isolated cells from ALI cultures transfected with fluorescein-conjugated TSB (green). The nuclei were stained with DAPI (blue), and merged images are shown. Scale bars 10 µm. c ANO1 protein expression was analyzed and quantified by western blotting using anti-ANO1 antibody. β-actin was used for normalization. Histograms represent average values ± SDs (n = 6) and were compared using Student’s t-test. d Representative and original traces of ANO1 channel activity (left) and quantification (right) of hAECB CF cells transfected with ANO1 TSB or a negative control (n = 4). e Migration rates during repair of primary CF cells. Representative photographs were taken during 4 h of wound closure of CF cells (left), and migration rates were quantification (right) (n = 4). Scale bar 20 µm. Histograms represent average values ± SDs and were compared using Student’s t-test. f Effect of TSB control or ANO1 TSB on mucus dynamics after 30 days of transfection. The movements of 100 beads were quantified for each condition, and the average speed (µm/ms) was determined. Scale bar 40 µm. Histograms represent the mean values ± SDs and were compared using Student’s t-test
Fig. 6
Fig. 6
miR-9-specific TSB is well tolerated in CF mice. For all the experiments, we used 8-week-old male 129-Cftr tm1Eur CF model mice homozygous for the F508del mutation in the 129/FVB outbred background (F508del-CFTR) and their wild-type littermates obtained from CDTA-CNRS (Orléans, France). a Representative and original traces of ANO1 channel activity (left) and quantification (right) of MLE15 cells transfected with TSB control (control) or ANO1 TSB. Histograms represent average values ± SDs (n = 5) and were compared using Student’s t-test. b Outline of the CF mouse experiment. TSB control or ANO1 TSB was instilled intranasally at days 7 and 14 after reception (day 0), and mice were killed at day 21. c Growth curves of mice from the day of reception (day 0). Arrows represent intranasal instillation
Fig. 7
Fig. 7
miR-9-specific TSB increases ANO1 activity and mucus dynamics in CF mice. For all the experiments, we used 8-week-old male 129-Cftr tm1Eur CF model mice homozygous for the F508del mutation in the 129/FVB outbred background (F508del-CFTR) and their wild-type littermates obtained from CDTA-CNRS (Orléans, France). a Representative and original traces of ANO1 channel activity (left) and quantification (right) of cells isolated from wild-type mice (n = 8), CF mice instilled with ANO1 TSB (n = 7) or a negative control (n = 7). Histograms represent the average values ± SDs and were compared using one-ANOVA test coupled with Dunnett’s, Bonferroni’s, and Tukey’s post hoc test. b Effect of TSB control or TSB ANO1 on the transport of phenol red dye in the trachea. Histograms represent the average values ± SDs and were compared using one-way ANOVA test coupled with Dunnett’s, Bonferroni’s, and Tukey’s post hoc test. c Effect of TSB control or ANO1 TSB on mucus dynamics on the trachea of CF mice. The movements of 100 beads were quantified for each condition, and the average speed (µm/ms) was determined. Scale bar 40 µm. Histograms represent the mean values ± SDs and were compared using Student’s t-test

References

    1. Pittman JE, Ferkol TW. The evolution of cystic fibrosis care. Chest. 2015;148:533–542. doi: 10.1378/chest.14-1997. - DOI - PMC - PubMed
    1. Riordan JR, et al. Identification of the cystic fibrosis gene: cloning and characterization of complementary DNA. Science. 1989;245:1066–1073. doi: 10.1126/science.2475911. - DOI - PubMed
    1. Corvol H, Thompson KE, Tabary O, le Rouzic P, Guillot L. Translating the genetics of cystic fibrosis to personalized medicine. Transl. Res. 2015;168:40–49. doi: 10.1016/j.trsl.2015.04.008. - DOI - PubMed
    1. Van Goor F, et al. Rescue of CF airway epithelial cell function in vitro by a CFTR potentiator, VX-770. Proc. Natl Acad. Sci. USA. 2009;106:18825–18830. doi: 10.1073/pnas.0904709106. - DOI - PMC - PubMed
    1. Wainwright CE, et al. Lumacaftor-Ivacaftor in patients with cystic fibrosis homozygous for Phe508del CFTR. N. Engl. J. Med. 2015;373:1783. doi: 10.1056/NEJMoa1409547. - DOI - PubMed

Publication types