

Cascaded Amplitude Modulations in Sound Texture Perception
- PMID: 28955191
- PMCID: PMC5601004
- DOI: 10.3389/fnins.2017.00485
Cascaded Amplitude Modulations in Sound Texture Perception
Abstract
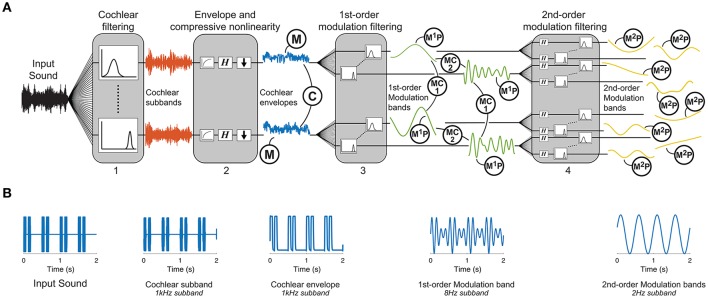
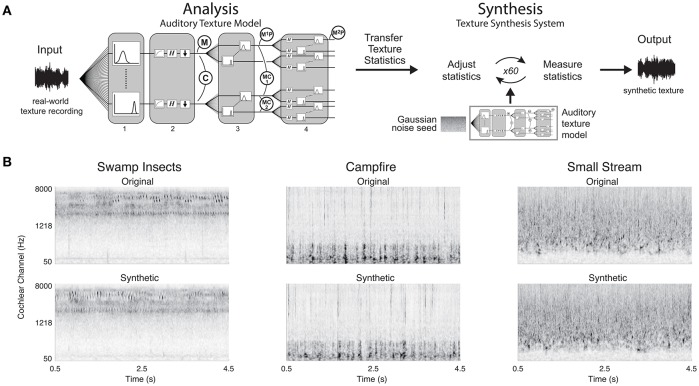
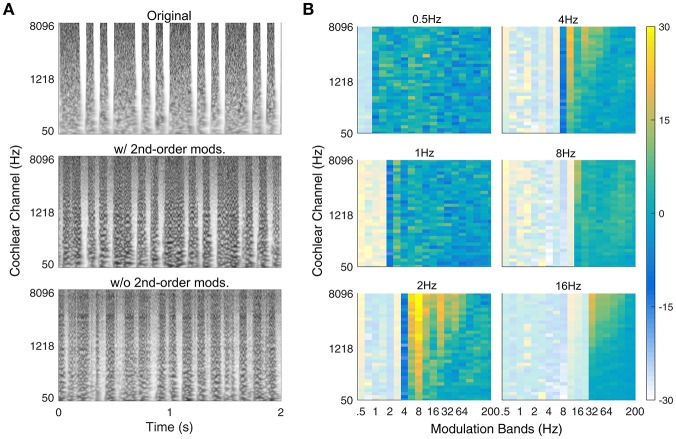
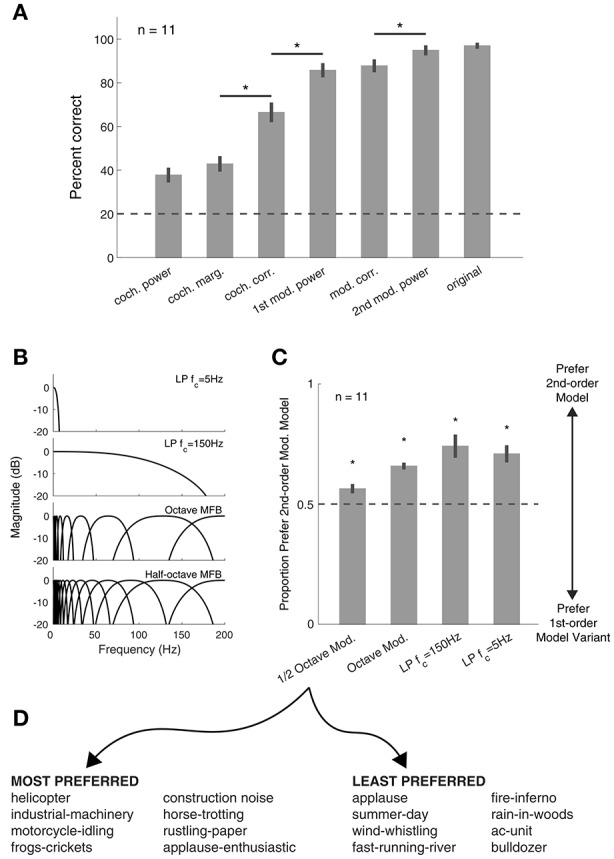
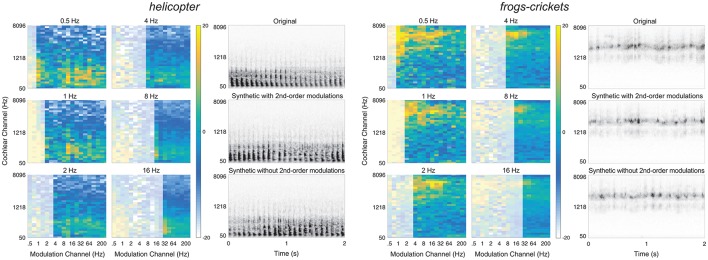
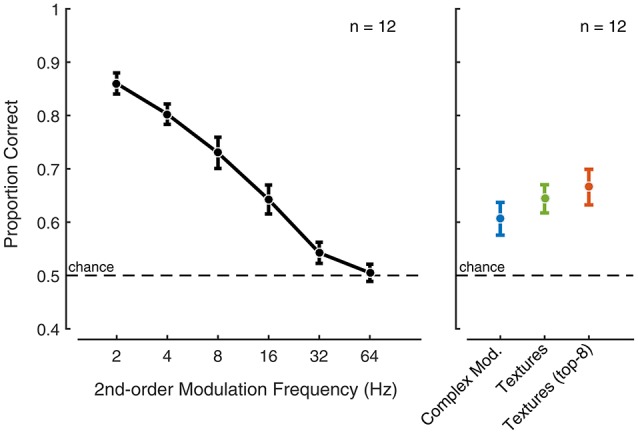
Sound textures, such as crackling fire or chirping crickets, represent a broad class of sounds defined by their homogeneous temporal structure. It has been suggested that the perception of texture is mediated by time-averaged summary statistics measured from early auditory representations. In this study, we investigated the perception of sound textures that contain rhythmic structure, specifically second-order amplitude modulations that arise from the interaction of different modulation rates, previously described as "beating" in the envelope-frequency domain. We developed an auditory texture model that utilizes a cascade of modulation filterbanks that capture the structure of simple rhythmic patterns. The model was examined in a series of psychophysical listening experiments using synthetic sound textures-stimuli generated using time-averaged statistics measured from real-world textures. In a texture identification task, our results indicated that second-order amplitude modulation sensitivity enhanced recognition. Next, we examined the contribution of the second-order modulation analysis in a preference task, where the proposed auditory texture model was preferred over a range of model deviants that lacked second-order modulation rate sensitivity. Lastly, the discriminability of textures that included second-order amplitude modulations appeared to be perceived using a time-averaging process. Overall, our results demonstrate that the inclusion of second-order modulation analysis generates improvements in the perceived quality of synthetic textures compared to the first-order modulation analysis considered in previous approaches.
Keywords: amplitude modulation; auditory model; auditory perception; natural sound; sound texture.
Figures
Similar articles
-
A two-stage spectral model for sound texture perception: Synthesis and psychophysics.Iperception. 2023 Feb 22;14(1):20416695231157349. doi: 10.1177/20416695231157349. eCollection 2023 Jan-Feb. Iperception. 2023. PMID: 36845027 Free PMC article.
-
Identification and Discrimination of Sound Textures in Hearing-Impaired and Older Listeners.Trends Hear. 2021 Jan-Dec;25:23312165211065608. doi: 10.1177/23312165211065608. Trends Hear. 2021. PMID: 34939472 Free PMC article.
-
Distinct neural ensemble response statistics are associated with recognition and discrimination of natural sound textures.Proc Natl Acad Sci U S A. 2020 Dec 8;117(49):31482-31493. doi: 10.1073/pnas.2005644117. Epub 2020 Nov 20. Proc Natl Acad Sci U S A. 2020. PMID: 33219122 Free PMC article.
-
[Neural Representation of Sound Texture in the Auditory Cortex].Brain Nerve. 2015 Jun;67(6):679-90. doi: 10.11477/mf.1416200202. Brain Nerve. 2015. PMID: 26062583 Review. Japanese.
-
Between sound and perception: reviewing the search for a neural code.Hear Res. 2001 Jul;157(1-2):1-42. doi: 10.1016/s0378-5955(01)00259-3. Hear Res. 2001. PMID: 11470183 Review.
Cited by
-
Cascaded Tuning to Amplitude Modulation for Natural Sound Recognition.J Neurosci. 2019 Jul 10;39(28):5517-5533. doi: 10.1523/JNEUROSCI.2914-18.2019. Epub 2019 May 15. J Neurosci. 2019. PMID: 31092586 Free PMC article.
-
Predicting tingling sensations induced by autonomous sensory meridian response (ASMR) videos based on sound texture statistics: a comparison to pleasant feelings.Philos Trans R Soc Lond B Biol Sci. 2024 Aug 26;379(1908):20230254. doi: 10.1098/rstb.2023.0254. Epub 2024 Jul 15. Philos Trans R Soc Lond B Biol Sci. 2024. PMID: 39005038 Free PMC article.
-
Human Auditory Ecology: Extending Hearing Research to the Perception of Natural Soundscapes by Humans in Rapidly Changing Environments.Trends Hear. 2023 Jan-Dec;27:23312165231212032. doi: 10.1177/23312165231212032. Trends Hear. 2023. PMID: 37981813 Free PMC article.
-
Developmental origins of natural sound perception.Front Psychol. 2024 Dec 11;15:1474961. doi: 10.3389/fpsyg.2024.1474961. eCollection 2024. Front Psychol. 2024. PMID: 39726626 Free PMC article. Review.
-
Illusory sound texture reveals multi-second statistical completion in auditory scene analysis.Nat Commun. 2019 Nov 8;10(1):5096. doi: 10.1038/s41467-019-12893-0. Nat Commun. 2019. PMID: 31704913 Free PMC article.
References
-
- Andén J., Mallat S. (2011). Multiscale scattering for audio classification, in ISMIR (Miami, FL: ), 657–662.
-
- Andén J., Mallat S. (2012). Scattering representation of modulated sounds, in Proceedings of the 15th International Conference on Digital Audio Effects (New York, NY: ).
-
- Andén J., Mallat S. (2014). Deep Scattering Spectrum. IEEE Trans. Signal Process. 62, 4114–4128. 10.1109/TSP.2014.2326991 - DOI
LinkOut - more resources
Full Text Sources
Other Literature Sources