. 2017 Sep 11:9:296.
doi: 10.3389/fnagi.2017.00296. eCollection 2017.

Alterations in the Interplay between Neurons, Astrocytes and Microglia in the Rat Dentate Gyrus in Experimental Models of Neurodegeneration

Affiliations

Alterations in the Interplay between Neurons, Astrocytes and Microglia in the Rat Dentate Gyrus in Experimental Models of Neurodegeneration

Daniele Lana et al. Front Aging Neurosci. .

Abstract

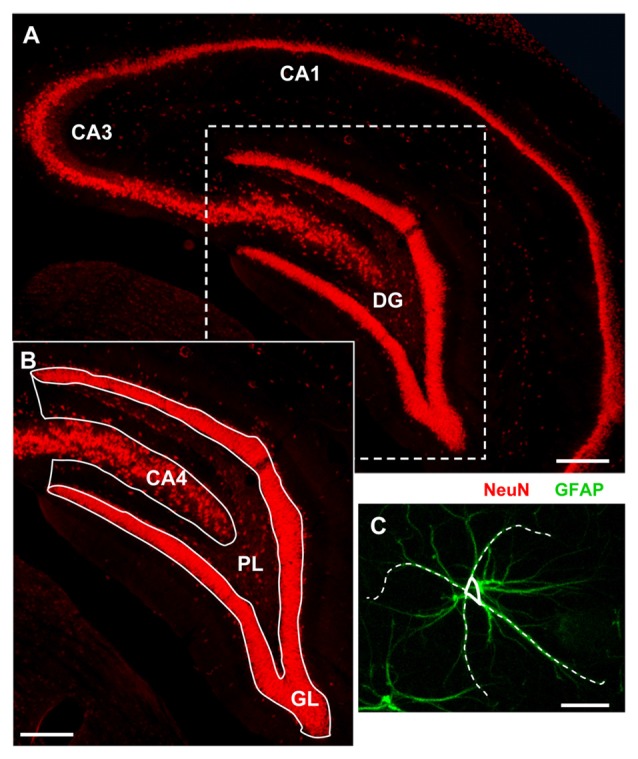
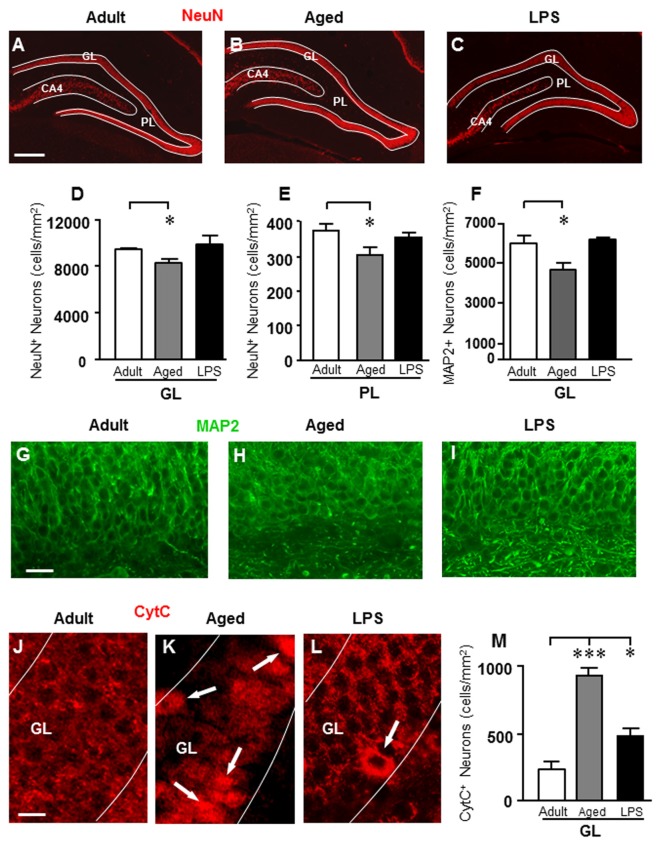
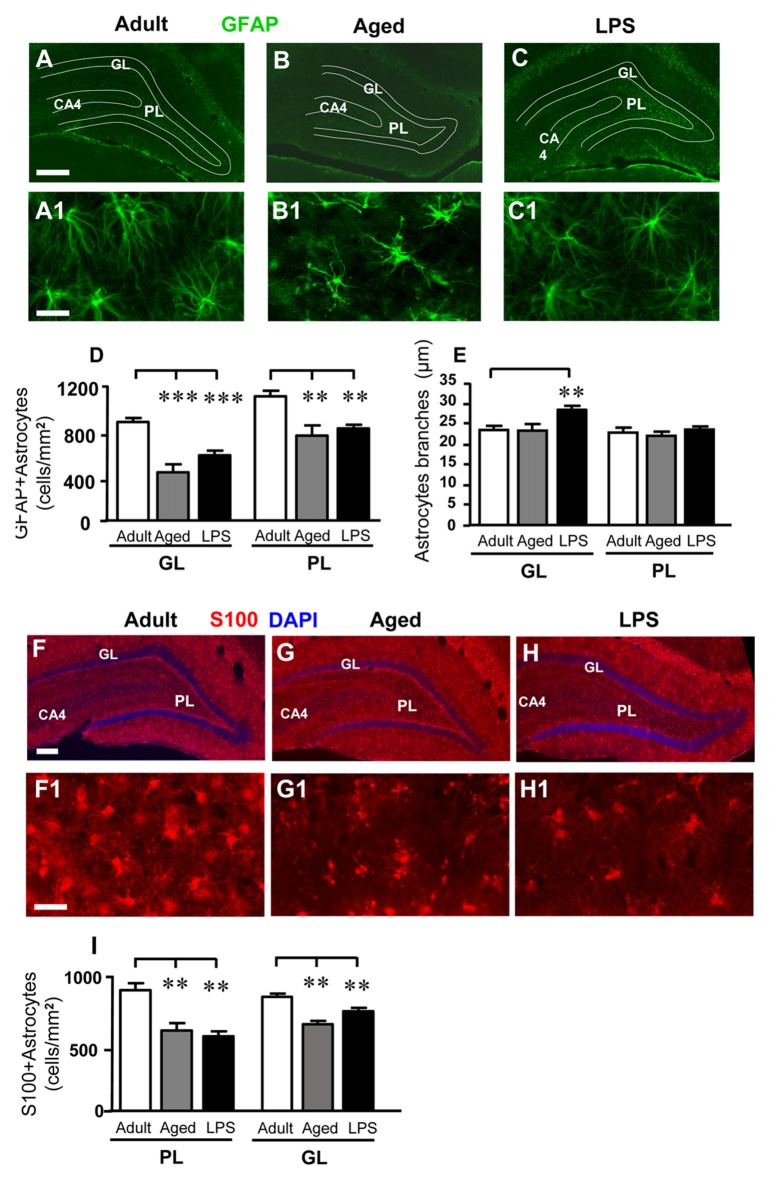
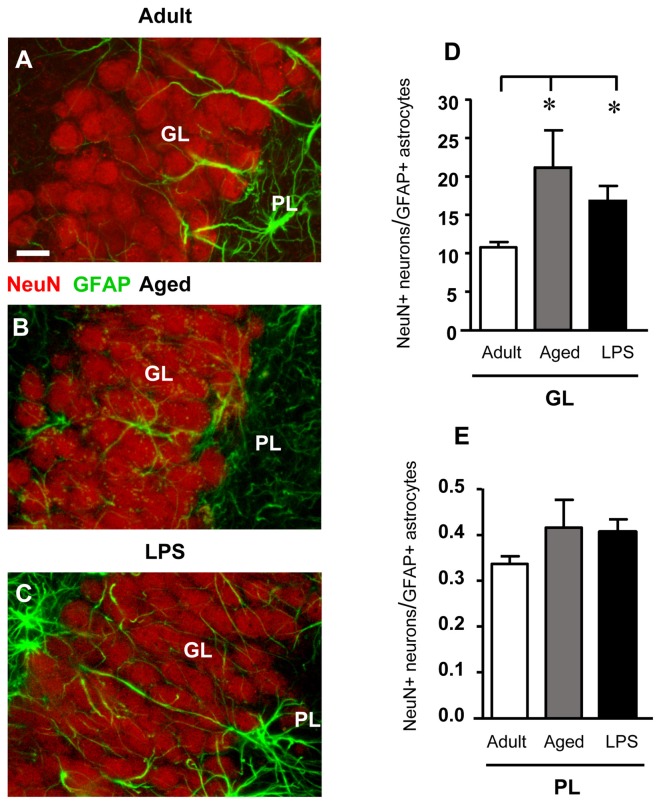
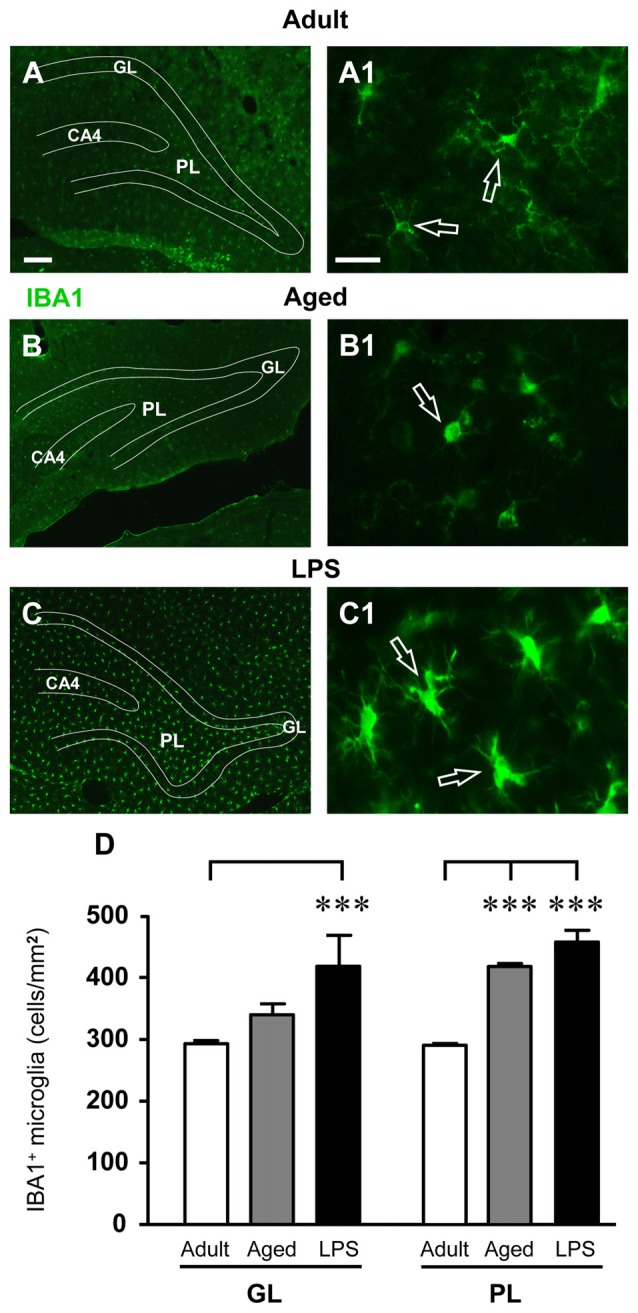
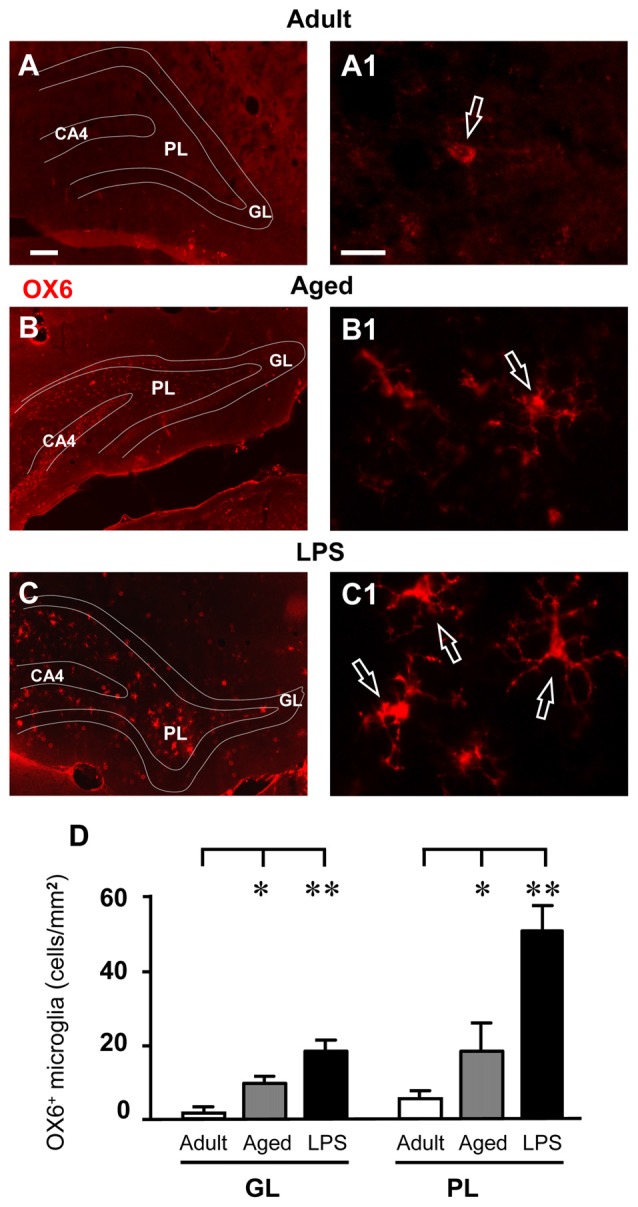
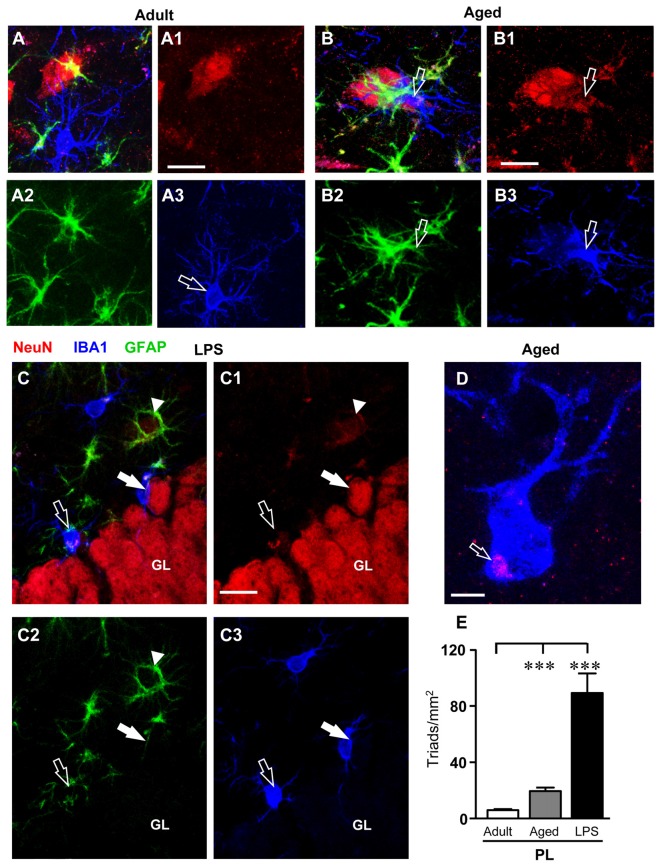
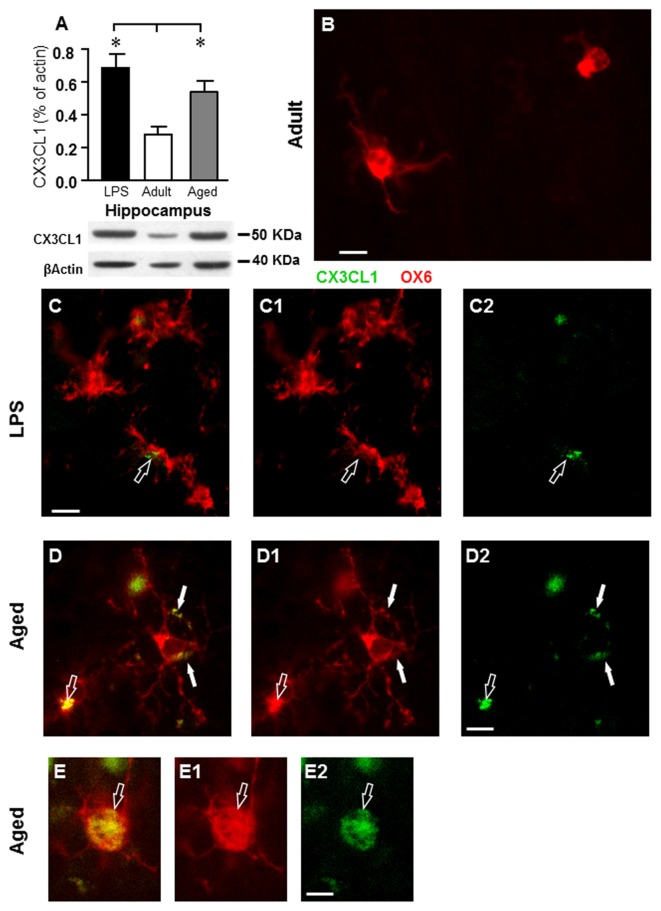
The hippocampus is negatively affected by aging and neurodegenerative diseases leading to impaired learning and memory abilities. A diverse series of progressive modifications in the intercellular communication among neurons, astrocytes and microglia occur in the hippocampus during aging or inflammation. A detailed understanding of the neurobiological modifications that contribute to hippocampal dysfunction may reveal new targets for therapeutic intervention. The current study focussed on the interplay between neurons and astroglia in the Granule Layer (GL) and the Polymorphic Layer (PL) of the Dentate Gyrus (DG) of adult, aged and LPS-treated rats. In GL and PL of aged and LPS-treated rats, astrocytes were less numerous than in adult rats. In GL of LPS-treated rats, astrocytes acquired morphological features of reactive astrocytes, such as longer branches than was observed in adult rats. Total and activated microglia increased in the aged and LPS-treated rats, as compared to adult rats. In the GL of aged and LPS-treated rats many neurons were apoptotic. Neurons decreased significantly in GL and PL of aged but not in rats treated with LPS. In PL of aged and LPS-treated rats many damaged neurons were embraced by microglia cells and were infiltrated by branches of astrocyte, which appeared to be bisecting the cell body, forming triads. Reactive microglia had a scavenging activity of dying neurons, as shown by the presence of neuronal debris within their cytoplasm. The levels of the chemokine fractalkine (CX3CL1) increased in hippocampal homogenates of aged rats and rats treated with LPS, and CX3CL1 immunoreactivity colocalized with activated microglia cells. Here we demonstrated that in the DG of aged and LPS-treated rats, astrocytes and microglia cooperate and participate in phagocytosis/phagoptosis of apoptotic granular neurons. The differential expression/activation of astroglia and the alteration of their intercommunication may be responsible for the different susceptibility of the DG in comparison to the CA1 and CA3 hippocampal areas to neurodegeneration during aging and inflammation.

Keywords: CX3CL1; MAP2; S100; apoptosis; confocal microscopy; inflammaging; phagocytosis; phagoptosis.


Figures

Figure 1
Figure 1
Representative image of the region of interest (ROI) for the analyses. (A) Fluorescent immunostaining of neurons with anti-NeuN antibody in the dorsal hippocampus of a young rat. Scale bar: 250 μm. (B) Magnification of the framed area in (A) schematically showing the dentate gyrus (DG) subregions: Granular Layer (GL) and Polymorphic Layer (PL). Hippocampal CA4 is also shown. Scale bar: 100 μm. (C) Schematic diagram showing the method used to measure the length of principal GFAP+ astrocytes branches. Scale bar: 10 μm.
Figure 2
Figure 2
Analysis of neurons in GL and PL of adult, aged and LPS-treated rats. (A–C) Representative photomicrographs of NeuN immunostaining of neurons (red) in DG of an adult (A), an aged (B) and an LPS-treated rat (C). Scale bar: 200 μm. (D,E) Quantitative analysis of neurons/mm2 in DG GL (D) and PL (E) of adult (n = 6), aged (n = 5) and LPS-treated rats (n = 6). Neurons were significantly less numerous in GL and PL of aged rats. (F) Quantitative analysis of MAP2 neurons/mm2 in DG GL of adult (n = 6), aged (n = 5) and LPS-treated rats (n = 4). MAP2+ granular neurons were significantly less numerous in GL of aged rats. (G–I) Representative photomicrographs of MAP2 immunostaining (green) in the GL of an adult (G), an aged (H) and an LPS-treated rat (I). Scale bar: 25 μm. (J–L) Representative photomicrographs of CytC immunostaining (red) in the GL of an adult (J), an aged (K) and an LPS-treated rat (L). The arrows in (K) and (L) point to apoptotic neurons in GL. Scale bar: 10 μm. (M) Quantitative analysis of apoptotic neurons/mm2 in GL of adult (n = 4), aged (n = 4) and LPS-treated rats (n = 4). Apoptotic granular neurons were significantly more numerous in GL of aged and LPS-treated rats. Data reported in all graph bars are expressed as mean ± SEM. All statistical analyses were performed using ANOVA and Newman-Keuls Multiple Comparison Test: *P < 0.05 vs. adult rats, ***P < 0.001 vs. adult rats (see text for details).
Figure 3
Figure 3
Characterization and quantitative analysis of astrocytes in GL and PL of adult, aged and LPS-treated rats. (A–C) Representative photomicrographs showing immunoreactivity of GFAP (green) in DG of an adult (A), an aged (B) and an LPS-treated rat (C). Scale bar: 150 μm. (A1–C1) Magnification of GFAP+ astrocytes in the PL of an adult (A1), an aged (B1) and an LPS-treated rat (C1). Scale bar: 25 μm. (D) Quantitative analysis of GFAP positive astrocytes/mm2 in hippocampal GL and PL of adult (n = 5), aged (n = 4) and LPS-treated rats (n = 6). GFAP+ astrocytes were significantly less numerous in GL and PL of aged and LPS-treated rats. (E) Length of principal astrocyte branches in GL and PL of adult (n = 5), aged (n = 5) and LPS-treated rats (n = 7). GFAP+ astrocytes branches were significantly longer in GL of LPS-treated rats. (F–H) Representative photomicrographs showing immunoreactivity of S100 (red) in DG of an adult (F), an aged (G) and an LPS-treated rat (H). Nuclei were counterstained with DAPI (blue). Scale bar: 100 μm. (F1–H1) Magnification of S100+ astrocytes in the PL of an adult (F1), an aged (G1) and an LPS-treated rat (H1). Scale bar: 50 μm. (I) Quantitative analysis of S100-positive astrocytes/mm2 in hippocampal GL and PL of adult (n = 6), aged (n = 5) and LPS-treated rats (n = 5). S100+ astrocytes were significantly less numerous in GL and PL of aged and LPS-treated rats. Data reported in all graph bars are expressed as mean ± SEM. All statistical analyses were performed using ANOVA and Newman-Keuls Multiple Comparison Test: **P < 0.01 vs. adult rats, ***P < 0.001 vs. adult rats (see text for details).
Figure 4
Figure 4
Confocal microscopy 3D renderings of double immunostaining of neurons (NeuN, red), and astrocytes (GFAP, green) in the GL of an adult (A), an aged (B) and of an LPS-treated rat (C). Scale bar: 10 μm. (D,E) Ratios between NeuN+ neurons and GFAP+ astrocytes in GL (D) and PL (E) of adult (n = 6), aged (n = 5) and LPS-treated (n = 6) rats. The ratios NeuN+ neurons/GFAP+ astrocytes increased in GL of aged and LPS-treated rats. Data reported in all graph bars are expressed as mean ± SEM. All statistical analyses were performed using ANOVA and Newman-Keuls Multiple Comparison Test: *P < 0.05 vs. adult rats (see text for details).
Figure 5
Figure 5
Analysis of total microglia in GL and PL of adult, aged and LPS-treated rats. (A–C) Representative photomicrographs of IBA1 immunostaining of total microglia (green) in DG of an adult (A), an aged (B) and an LPS-treated rat (C). Scale bar: 100 μm. (A1–C1) Magnification of total microglia in the PL of an adult (A1), an aged (B1) and an LPS-treated rat (C1). Scale bar: 15 μm. (D) Quantitative analysis of IBA1 positive microglia/mm2 in hippocampal GL and PL of adult (n = 5), aged (n = 5) and LPS-treated rats (n = 5). Microglia were significantly more numerous in GL of LPS-treated rats and in PL of aged and LPS-treated rats. Data reported in all graph bars are expressed as mean ± SEM. All statistical analyses were performed using ANOVA and Newman-Keuls Multiple Comparison Test: ***P < 0.001 vs. adult rats (see text for details).
Figure 6
Figure 6
Analysis of OX6 positive, activated microglia in GL and PL of adult, aged and LPS-treated rats. (A–C) Representative photomicrographs of OX6 immunostaining of activated microglia (red) in DG of an adult (A), an aged (B) and an LPS-treated rat (C). Scale bar: 100 μm. (A1–C1) Magnification of activated microglia in PL of an adult (A1), an aged (B1) and an LPS-treated rat (C1). Scale bar: 15 μm. (D) Quantitative analysis of activated microglia/mm2 in hippocampal GL and PL of adult (n = 3), aged (n = 5) and LPS-treated rats (n = 4). Activated microglia cells were significantly more numerous in GL and PL of aged and LPS-treated rats. Data reported in all graph bars are expressed as mean ± SEM. All statistical analyses were performed using ANOVA and Newman-Keuls Multiple Comparison Test: *P < 0.05 vs. adult rats, **P < 0.01 vs. adult rats (see text for details).
Figure 7
Figure 7
Quantification and characterization of the neuron-astrocyte-microglia triads in PL of adult, aged and LPS-treated rats. (A–A3,B–B3,C–C3) Confocal microscopy 3D renderings of triple immunostaining of neurons (NeuN, red), astrocytes (GFAP, green) and microglia (IBA1, blue) in the PL of an adult (A–A3), an aged (B–B3), and of an LPS-treated rat (C–C3). (A–A3) The images show a neuron, astrocytes and microglia in the PL of an adult rat, not forming a triad. Scale bar: 10 μm. (B–B3) The arrows indicates neurons (B1) showing signs of degeneration with surrounding GFAP+ astrocytes (B2) and a microglial cell in reactive, phagocytic state (B3), forming a triad (A). Scale bar: 5 μm. (C–C3) The open arrow in (C1) indicates a neuron showing signs of degeneration with surrounding GFAP+ astrocytes and microglial cells in reactive, phagocytic state (C3) involved in the triad formation (C). Scale bar: 15 μm. (D) Representative photomicrograph of an activated microglia cell (IBA1, blue) engulfing a neuronal debris (NeuN, red, open arrow) in PL of an aged rat. Scale bar: 2 μm. (E) Quantitative analysis of neuron-astrocyte-microglia triads/mm2 in DG PL of adult (n = 6), aged (n = 5) and LPS-treated rats (n = 4). Triads were significantly more numerous in PL of aged and LPS-treated rats. Data reported in all graph bars are expressed as mean ± SEM. Statistical analysis was performed using ANOVA and Newman-Keuls Multiple Comparison Test: ***P < 0.001 vs. adult rats (see text for details).
Figure 8
Figure 8
Analysis of CX3CL1 expression in the hippocampus of adult, aged and LPS-treated rats. (A) Quantitative Western Blot analysis of CX3CL1 in whole hippocampus homogenates of adult (n = 6), aged (n = 4), and LPS-treated (n = 4) rats. Each column in the graph represents the level of CX3CL1 normalized to β-actin run in the same gel, expressed as mean ± SEM (*P < 0.05 vs. adult rats). Typical Western Blots of CX3CL1 and actin run in the same gel are shown below. (B–D2) Fluorescent immunohistochemistry of CX3CL1 (C2–D2, green), of OX6 positive microglia (C1–D1, red), and the merge of CX3CL1 and OX6 (B–D) in the PL of an adult (B), an LPS-treated rat (C) and of an aged rat (D). (B) Scale bar: 5 μm; (C–C2,D–D2) Scale bar: 10 μm. These images show that CX3CL1 colocalized with microglia cells (arrows) in aged and LPS-treated rats. (E–E2) Representative photomicrographs demonstrating that CX3CL1 (E2, green) is expressed in the cytoplasm of an activated microglial cell (E1, OX6, red) in the PL of an aged rat. (E) Is the merge of the two previous images. Scale bar: 5 μm.

Similar articles

Cited by

References

    1. Allen N. J., Barres B. A. (2009). Neuroscience: glia—more than just brain glue. Nature 457, 675–677. 10.1038/457675a - DOI - PubMed
    1. Amaral D. G. (1993). Emerging principles of intrinsic hippocampal organization. Curr. Opin. Neurobiol. 3, 225–229. 10.1016/0959-4388(93)90214-j - DOI - PubMed
    1. Amaral D. G., Lavenex P. (2007). “Hippocampal neuroanatomy,” in The Hippocampus Book, eds Andersen P., Morris R., Amaral D. G., O’Keefe J. (New York, NY: Oxford University Press; ), 37–114.
    1. Amaral D. G., Scharfman H. E., Lavenex P. (2007). The dentate gyrus: fundamental neuroanatomical organization (dentate gyrus for dummies). Prog. Brain Res. 163, 3–22. 10.1016/S0079-6123(07)63001-5 - DOI - PMC - PubMed
    1. Bachstetter A. D., Morganti J. M., Jernberg J., Schlunk A., Mitchell S. H., Brewster K. W., et al. . (2011). Fractalkine and CX3CR1 regulate hippocampal neurogenesis in adult and aged rats. Neurobiol. Aging 32, 2030–2044. 10.1016/j.neurobiolaging.2009.11.022 - DOI - PMC - PubMed