

Perturbation of B Cell Gene Expression Persists in HIV-Infected Children Despite Effective Antiretroviral Therapy and Predicts H1N1 Response
- PMID: 28955330
- PMCID: PMC5600985
- DOI: 10.3389/fimmu.2017.01083
Perturbation of B Cell Gene Expression Persists in HIV-Infected Children Despite Effective Antiretroviral Therapy and Predicts H1N1 Response
Abstract
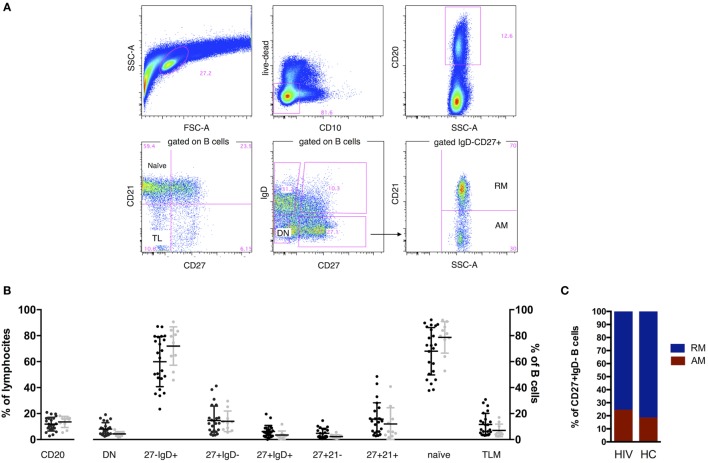
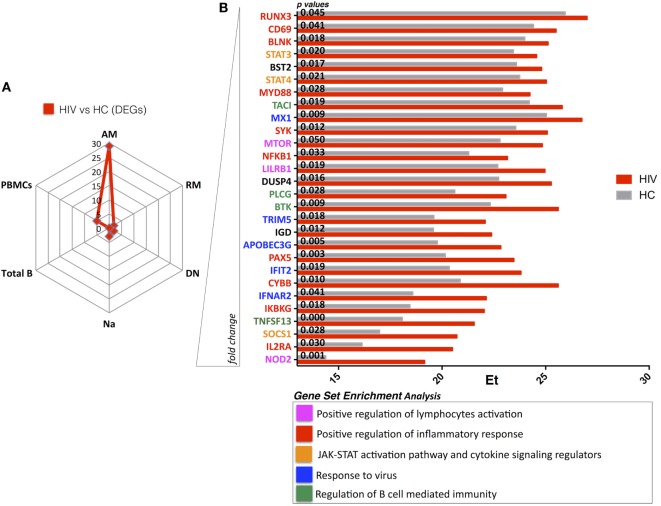
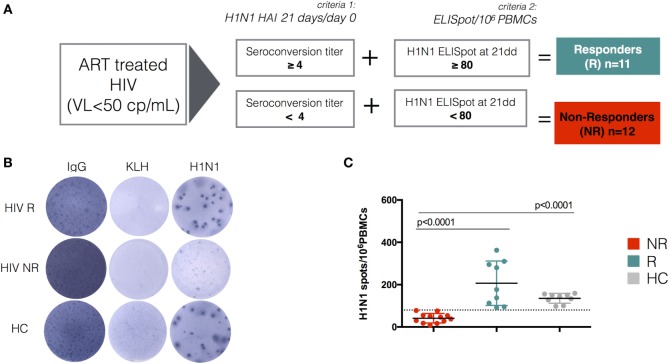
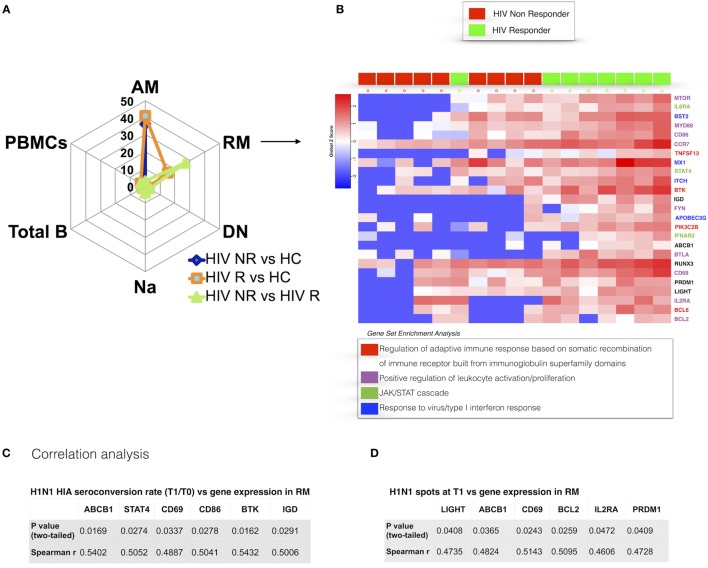
Despite effective antiretroviral therapy (ART), HIV-infected individuals with apparently similar clinical and immunological characteristics can vary in responsiveness to vaccinations. However, molecular mechanisms responsible for such impairment, as well as biomarkers able to predict vaccine responsiveness in HIV-infected children, remain unknown. Following the hypothesis that a B cell qualitative impairment persists in HIV-infected children (HIV) despite effective ART and phenotypic B cell immune reconstitution, the aim of the current study was to investigate B cell gene expression of HIV compared to age-matched healthy controls (HCs) and to determine whether distinct gene expression patterns could predict the ability to respond to influenza vaccine. To do so, we analyzed prevaccination transcriptional levels of a 96-gene panel in equal numbers of sort-purified B cell subsets (SPBS) isolated from peripheral blood mononuclear cells using multiplexed RT-PCR. Immune responses to H1N1 antigen were determined by hemaglutination inhibition and memory B cell ELISpot assays following trivalent-inactivated influenza vaccination (TIV) for all study participants. Although there were no differences in terms of cell frequencies of SPBS between HIV and HC, the groups were distinguishable based upon gene expression analyses. Indeed, a 28-gene signature, characterized by higher expression of genes involved in the inflammatory response and immune activation was observed in activated memory B cells (CD27+CD21-) from HIV when compared to HC despite long-term viral control (>24 months). Further analysis, taking into account H1N1 responses after TIV in HIV participants, revealed that a 25-gene signature in resting memory (RM) B cells (CD27+CD21+) was able to distinguish vaccine responders from non-responders (NR). In fact, prevaccination RM B cells of responders showed a higher expression of gene sets involved in B cell adaptive immune responses (APRIL, BTK, BLIMP1) and BCR signaling (MTOR, FYN, CD86) when compared to NR. Overall, these data suggest that a perturbation at a transcriptional level in the B cell compartment persists despite stable virus control achieved through ART in HIV-infected children. Additionally, the present study demonstrates the potential utility of transcriptional evaluation of RM B cells before vaccination for identifying predictive correlates of vaccine responses in this population.
Keywords: B cell receptor; B cells; H1N1; influenza vaccination; pediatric HIV; systems biology; transcriptomics; vaccinomics.
Figures
Similar articles
-
Artificial Intelligence Applied to in vitro Gene Expression Testing (IVIGET) to Predict Trivalent Inactivated Influenza Vaccine Immunogenicity in HIV Infected Children.Front Immunol. 2020 Oct 5;11:559590. doi: 10.3389/fimmu.2020.559590. eCollection 2020. Front Immunol. 2020. PMID: 33123133 Free PMC article.
-
Higher PIK3C2B gene expression of H1N1+ specific B-cells is associated with lower H1N1 immunogenicity after trivalent influenza vaccination in HIV infected children.Clin Immunol. 2020 Jun;215:108440. doi: 10.1016/j.clim.2020.108440. Epub 2020 Apr 21. Clin Immunol. 2020. PMID: 32330555 Free PMC article.
-
Antibody but not memory B-cell responses are tuned-down in vertically HIV-1 infected children and young individuals being vaccinated yearly against influenza.Vaccine. 2014 Feb 3;32(6):657-63. doi: 10.1016/j.vaccine.2013.12.008. Epub 2013 Dec 13. Vaccine. 2014. PMID: 24333344
-
Single Cell Profiling Reveals PTEN Overexpression in Influenza-Specific B cells in Aging HIV-infected individuals on Anti-retroviral Therapy.Sci Rep. 2019 Feb 21;9(1):2482. doi: 10.1038/s41598-019-38906-y. Sci Rep. 2019. PMID: 30792481 Free PMC article.
-
Low expression of activation marker CD69 and chemokine receptors CCR5 and CXCR3 on memory T cells after 2009 H1N1 influenza A antigen stimulation in vitro following H1N1 vaccination of HIV-infected individuals.Hum Vaccin Immunother. 2015;11(9):2253-65. doi: 10.1080/21645515.2015.1051275. Epub 2015 Jun 19. Hum Vaccin Immunother. 2015. PMID: 26091502 Free PMC article.
Cited by
-
Gene Expression: the Key to Understanding HIV-1 Infection?Microbiol Mol Biol Rev. 2020 May 13;84(2):e00080-19. doi: 10.1128/MMBR.00080-19. Print 2020 May 20. Microbiol Mol Biol Rev. 2020. PMID: 32404327 Free PMC article. Review.
-
Impaired Development and Expansion of Germinal Center Follicular Th Cells in Simian Immunodeficiency Virus-Infected Neonatal Macaques.J Immunol. 2018 Oct 1;201(7):1994-2003. doi: 10.4049/jimmunol.1800235. Epub 2018 Aug 13. J Immunol. 2018. PMID: 30104244 Free PMC article.
-
Virological and immunological features of SARS-CoV-2-infected children who develop neutralizing antibodies.Cell Rep. 2021 Mar 16;34(11):108852. doi: 10.1016/j.celrep.2021.108852. Cell Rep. 2021. PMID: 33730580 Free PMC article.
-
Artificial Intelligence Applied to in vitro Gene Expression Testing (IVIGET) to Predict Trivalent Inactivated Influenza Vaccine Immunogenicity in HIV Infected Children.Front Immunol. 2020 Oct 5;11:559590. doi: 10.3389/fimmu.2020.559590. eCollection 2020. Front Immunol. 2020. PMID: 33123133 Free PMC article.
-
Biomarkers of vaccine safety and efficacy in vulnerable populations: Lessons from the fourth international precision vaccines conference.Vaccine. 2025 Jan 1;43(Pt 2):126477. doi: 10.1016/j.vaccine.2024.126477. Epub 2024 Nov 28. Vaccine. 2025. PMID: 39608233 Free PMC article.
References
LinkOut - more resources
Full Text Sources
Other Literature Sources
Research Materials
Miscellaneous