. 2017 Sep 11:8:1089.
doi: 10.3389/fimmu.2017.01089. eCollection 2017.

Molecular Analysis of a Short-term Model of β-Glucans-Trained Immunity Highlights the Accessory Contribution of GM-CSF in Priming Mouse Macrophages Response

Affiliations

Molecular Analysis of a Short-term Model of β-Glucans-Trained Immunity Highlights the Accessory Contribution of GM-CSF in Priming Mouse Macrophages Response

Sarah Walachowski et al. Front Immunol. .

Abstract

β-Glucans (BGs) are glucose polymers present in the fungal cell wall (CW) and, as such, are recognized by innate immune cells as microbial-associated pattern through Dectin-1 receptor. Recent studies have highlighted the ability of the pathogenic yeast Candida albicans or its CW-derived β(1,3) (1,6)-glucans to increase human monocytes cytokine secretion upon secondary stimulation, a phenomenon now referred as immune training. This ability of monocytes programming confers BGs an undeniable immunotherapeutic potential. Our objective was to determine whether BGs from Saccharomyces cerevisiae, a non-pathogenic yeast, are endowed with such a property. For this purpose, we have developed a short-term training model based on lipopolysaccharide re-stimulation of mouse bone marrow-derived macrophages primed with S. cerevisiae BGs. Through a transcriptome analysis, we demonstrated that BGs induced a specific gene expression signature involving the PI3K/AKT signaling pathway as in human monocytes. Moreover, we showed that over-expression of Csf2 (that encodes for GM-CSF) was a Dectin-1-dependent feature of BG-induced priming of macrophages. Further experiments confirmed that GM-CSF up-regulated Dectin-1 cell surface expression and amplified macrophages response along BG-mediated training. However, the blockade of GM-CSFR demonstrated that GM-CSF was not primarily required for BG-induced training of macrophages although it can substantially improve it. In addition, we found that mouse macrophages trained with BGs upregulated their expression of the four and a half LIM-only protein 2 (Fhl2) in a Dectin-1-dependent manner. Consistently, we observed that intracellular levels of FHL2 increased after stimulation of macrophages with BGs. In conclusion, our experiments provide new insights on GM-CSF contribution to the training of cells from the monocytic lineage and highlights FHL2 as a possible regulator of BG-associated signaling.

Keywords: Dectin-1; GM-CSF; macrophage; trained immunity; β-glucans.


Figures
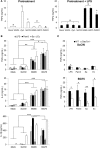
Figure 1
Figure 1
BG-enriched preparations of Saccharomyces cerevisiae cell wall (ScCW) prime the macrophage response predominantly via Dectin-1 upon toll-like lectin receptor (TLR) ligands or whole bacteria exposure. Wild-type (WT) thioglycollate-elicited peritoneal macrophages (A) and WT or Clec7a/ bone marrow-derived macrophages from C57BL/6 mice (B,C) were stimulated with 100 µg/mL of crude (ScCW) or BG-enriched (BG65, BG75) compounds for 8 h. After incubation, cell culture supernatants were collected [panel (A) on the left, white bars] and stored at −20°C. Cells were then stimulated with 100 ng/mL of ultraPure lipopolysaccharide (LPS) for 16 h [panel (A) on the right: dark bars, (B) and (C)] or Pam3CSK4 (Pam3) [(B) and (C)]. For the stimulation with live bacteria, Staphylococcus aureus N305 or Escherichia coli P4 strains were used at MOI = 10 for 1 h, followed by 16 h incubation with cell culture medium supplemented with Gentamicin™ (B) and (C). At the end of the incubation, supernatants were collected and immediately stored at −20°C. TNFα, IL-6, and IL1β were quantified by ELISA. Data are expressed as the mean ± SD from three independent experiments performed in triplicate. In (A,C), a Student’s t-test was used to assess significance between conditions (*p < 0.05; **p < 0.01) and mean values not sharing the same letter in (A) are significantly different. In (B), a two-way ANOVA with Bonferroni post-tests was used to compare pretreatment conditions (*p < 0.05; **p < 0.01, ***p < 0.001).
Figure 2
Figure 2
β-glucans (BGs) prime the production of TNFα in macrophages via a late and dose-dependent mechanism lasting beyond BG incubation. (A,B,E) bone marrow-derived macrophages (BMDM) were subcultured in 96-well plates. (A) Cells were incubated for 8 h with a 10-fold serial dilution from 100 to 0.1 µg/mL of BG75. After supernatant removal, BMDM were then stimulated with 100 ng/mL of ultraPure lipopolysaccharide (LPS) for 16 h. Supernatants were collected at the end of the incubation for further analysis. (B) Cells were stimulated for 1, 4, 8, 16, and 24 h with 100 µg/mL of BG-containing products (ScCW, BG65, and BG75). Supernatants were discarded and 100 ng/mL of ultraPure LPS was added in each well for 16 h incubation. Supernatants were immediately collected and stored at −20°C. TNFα was measured using ELISA and data are expressed as the mean ± SD from two independent experiments performed in triplicate. (C,D) NFκB/AP-1 reporter RAW-Blue™ macrophages were treated with 100 µg/mL of BG-containing compounds for 8 h before stimulation with 100 ng/mL of ultraPure LPS for 1, 4, 8, or 16 h. At the end of the incubation, supernatants were harvested and stored at −20°C until further use. NFκB/AP-1 activity was determined by a colorimetric enzyme assay where cell culture supernatants were incubated with Quanti-Blue™ reagent before reading OD at 650 nm. TNFα was quantified by ELISA. Data are expressed as the mean ± SD from three independent experiments performed in triplicate. (E) BMDM were incubated for 8 h with 100 µg/mL of BG75 or control. After supernatant removal, fresh medium was added for further 24 or 72 h (resting time) and cells were stimulated with 100 ng/mL of ultraPure LPS for 16 h. Supernatants were collected and stored at −20°C. TNFα was measured using ELISA and data are expressed as the mean ± SD from three independent experiments performed in triplicate. Mean values not sharing the same letter are significantly different according to the Student’s t-test (p < 0.05). For (B–D), results of statistical analyses are displayed for comparisons between each compound according to the incubation time.
Figure 3
Figure 3
Gene expression profiling reveals specific hallmarks of β-glucan (BG)-pretreated macrophages after lipopolysaccharide (LPS) exposure. Wild-type bone marrow-derived macrophages (BMDM) were cultured in 24-well plates and treated with 100 µg/mL of the set of three BG extracts for 8 h in triplicate. After incubation, supernatants were removed and cells were stimulated with 100 ng/mL of ultraPure LPS for 4 or 8 h. A microarray analysis was performed using Agilent mRNA transcriptomic analysis. After quality control and normalization, data were analyzed using Agilent GeneSpring GX software by two-way ANOVA and Benjamini–Hochberg post hoc correction. Transcripts with a p-value of less than or equal to 0.001 and a fold change (FC) value of at least 1.5 between conditions in at least one sample were selected for further analysis. (A) Venn diagrams showing the overlap of upregulated (↑) and downregulated (↓) genes in each condition were obtained using VENNY 2.0. (B) Unsupervised hierarchical clustering (Euclidian distance) of transcriptional profiles, displayed as a heatmap of FC expression values, from BG-treated BMDM compared to non-treated BMDM upon LPS exposure. Each row represents a transcript and each column an individual sample. The heatmap shows 4 clusters constituted by entities with a p-value of 0.001 for which FC were greater than 5 compared to mock plus 8 h LPS-stimulated cells. Red indicates over-expressed and blue indicated under-expressed transcripts. (C) Based on a comparison of FC expression values between BG pretreatments and the non-pretreated condition upon 8 h of LPS exposure obtained from GeneSpring software (FC >1.5), we performed a pathway over-representation analysis using Innate DB. Significant pathways which p-values (calculated by the hypergeometric algorithm) were lower than 0.05 are displayed for each BG pretreatment condition (threshold value–log p-value = 1.30).
Figure 4
Figure 4
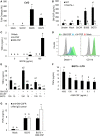
Csf2 upregulation induced by BG-enriched compounds treatment and lipopolysaccharide (LPS) exposure is mainly Dectin-1-dependent. Wild-type or Clec7a−/− bone marrow-derived macrophages (BMDM) were stimulated with 100 µg/mL of the various BG-containing compounds for 8 h. After incubation, cell culture supernatants were removed and 100 ng/mL of ultraPure LPS or medium was added in each well for 8 h (A) or 48 h (B). (A) Supernatants were discarded and BMDM were lysed in RLT lysis buffer. Total RNA was extracted as described before and retro-transcribed. Csf2 expression was determined by quantitative PCR after normalization with three housekeeping genes (Sdha, Rpl9, and Hprt1). Fold change (FC) data are expressed as the mean ± SD as compared to the mock condition in three independent experiments. Mean values not sharing the same letter are significantly different according to the Student’s t-test (p < 0.05). (B) After incubation, cell culture supernatants were harvested and stored at −20°C. GM-CSF was measured by ELISA. (C–E) WT BMDM were pre-incubated 2 h with rGM-CSF (5 ng/mL) or rM-CSF (5 ng/mL) or medium. (C) Cells were further stimulated with 100 µg/mL or 10 µg/mL of BG75 for 8 h. Cell culture supernatants were then removed and TNFα was quantified by ELISA. (D) After incubation, cells were harvested to assess surface expression of Dectin-1 and CD11b by flow cytometry. Expression data of Dectin-1 or CD11b are presented as overlaid histograms for each condition. (E) After pre-incubation with rGM-CSF, rM-CSF, or medium, BMDM were treated with 100 or 10 µg/mL of BG75 for 8 h before further stimulation with 100 ng/mL of ultraPure LPS or medium for 16 h. Supernatants were collected and TNFα was measured by ELISA. (F) BMDM were pre-incubated for 2 h with 10-fold serial dilutions of rGM-CSF from 0.1 to 1000 pg/mL, before assessment as in (E). (G) In this experiment, BMDM were first incubated with an anti-GM-CSFR monoclonal antibody or its isotype control for 2 h. rGM-CSF (100 pg/mL) was added to cells for 2 h as a positive control for neutralization. Cells were then stimulated as in (E). Data are expressed as the mean ± SD from two independent experiments performed in triplicate. Mean values not sharing the same letter are significantly different according to the Student’s t-test (p < 0.05).
Figure 5
Figure 5
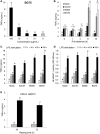
Fhl2 upregulation induced by BG-enriched compounds is under the control of Dectin-1. (A) Wild-type WT or Clec7a−/− bone marrow-derived macrophages (BMDM) were pre-treated as described in Figure 4A. Fhl2 expression was determined by RT-qPCR as described for Csf2. (B) WT or Clec7a−/− BMDM were stimulated with BG-containing compounds for 8 h. At the end of the incubation, BMDM were lysed in RLT lysis buffer. After RNA extraction, cDNA synthesis and RT-qPCR were performed. Data are expressed as the fold change (FC) related to the mock condition value and are representative of two experiments performed in triplicate. (C) WT BMDM were stimulated following the same protocol as in (A). After incubation, BMDM were lysed in RIPA buffer supplemented with 5 mM EDTA and protease inhibitor (Pierce™). After clarification and protein quantitation, 10 mg of total lysates were separated on a polyacrylamide gel. After transfer, nitrocellulose membrane was subjected to Western blotting with anti-FHL2 (F4B2-B11) and anti-β-actin (C4) mAbs (Santa Cruz Biotechnologies). Blotting was revealed using chemiluminescence. Results are also presented as the relative quantity of FHL2 protein detected in each condition as compared to the reference corresponding to the unstimulated cells. The data are representative of three independent experiments.

Similar articles

Cited by

References

    1. Taylor PR, Martinez-Pomares L, Stacey M, Lin H-H, Brown GD, Gordon S. Macrophage receptors and immune recognition. Annu Rev Immunol (2005) 23:901–44.10.1146/annurev.immunol.23.021704.115816 - DOI - PubMed
    1. Creagh EM, O’Neill LAJ. TLRs, NLRs and RLRs: a trinity of pathogen sensors that co-operate in innate immunity. Trends Immunol (2006) 27:352–7.10.1016/j.it.2006.06.003 - DOI - PubMed
    1. Goodridge HS, Underhill DM. Fungal recognition by TLR2 and dectin-1. Handb Exp Pharmacol (2008) 183:87–109.10.1007/978-3-540-72167-3_5 - DOI - PubMed
    1. LeibundGut-Landmann S, Groß O, Robinson MJ, Osorio F, Slack EC, Tsoni SV, et al. Syk- and CARD9-dependent coupling of innate immunity to the induction of T helper cells that produce interleukin 17. Nat Immunol (2007) 8:630–8.10.1038/ni1460 - DOI - PubMed
    1. Taylor PR, Tsoni SV, Willment JA, Dennehy KM, Rosas M, Findon H, et al. Dectin-1 is required for β-glucan recognition and control of fungal infection. Nat Immunol (2007) 8:31–8.10.1038/ni1408 - DOI - PMC - PubMed