. 2017 Sep 13:8:1581.
doi: 10.3389/fpls.2017.01581. eCollection 2017.

Insights into Resistance to Fe Deficiency Stress from a Comparative Study of In Vitro-Selected Novel Fe-Efficient and Fe-Inefficient Potato Plants

Affiliations

Insights into Resistance to Fe Deficiency Stress from a Comparative Study of In Vitro-Selected Novel Fe-Efficient and Fe-Inefficient Potato Plants

Georgina A Boamponsem et al. Front Plant Sci. .

Abstract

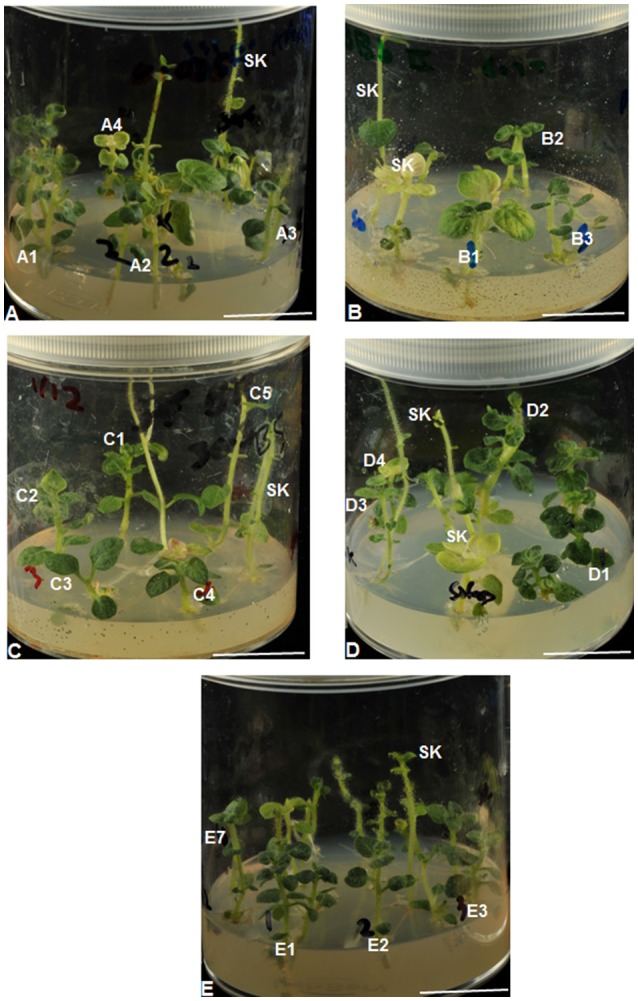
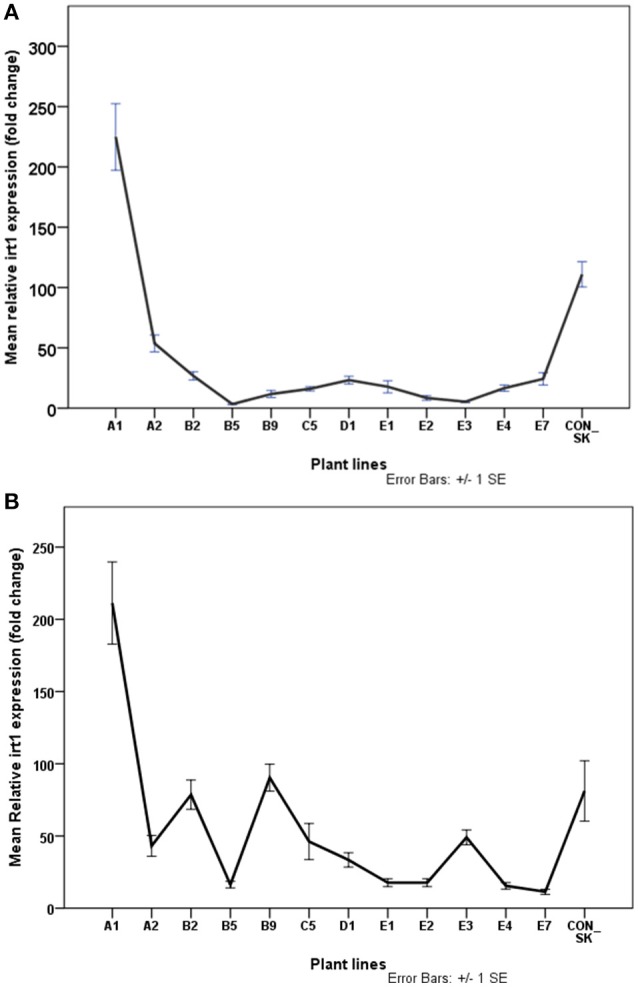
Iron (Fe) deficiency induces chlorosis (IDC) in plants and can result in reduced plant productivity. Therefore, development of Fe-efficient plants is of great interest. To gain a better understanding of the physiology of Fe-efficient plants, putative novel plant variants were regenerated from potato (Solanum tubersosum L. var. 'Iwa') callus cultures selected under Fe deficient or low Fe supply (0-5 μM Fe). Based on visual chlorosis rating (VCR), 23% of callus-derived regenerants were classified as Fe-efficient (EF) and 77% as Fe-inefficient (IFN) plant lines when they were grown under Fe deficiency conditions. Stem height was found to be highly correlated with internodal distance, leaf and root lengths in the EF plant lines grown under Fe deficiency conditions. In addition, compared to the IFN plant lines and control parental biotype, the EF plants including the lines named A1, B2, and B9, exhibited enhanced formation of lateral roots and root hairs as well as increased expression of ferritin (fer3) in the leaf and iron-regulated transporter (irt1) in the root. These morphological adaptations and changes in expression the fer3 and irt1 genes of the selected EF potato lines suggest that they are associated with resistance to low Fe supply stress.

Keywords: Fe-deficiency; chlorosis; ferritin; iron-regulated transporter; stress resistance.


Figures

Figure 1
Figure 1
Selection for Fe-efficient potato (cv. “Iwa”) callus cultures using Fe deficiency as selection pressure. Isolated chlorosis-tolerant (“green islands”) somaclonal variants (circled in red) were subcultured on respective Fe-deficient medium for 2–4 subcultures to get rid of chimeras/mixed chlorosis-sensitive cells to obtain solely Fe-efficient callus lines. Calli were cultured on media supplemented with 0.005, 0.1, 0.5 (A–C), 1 and 5 (G,H) μM Fe. Selected Fe-efficient calli subcultured on media supplemented with 0.005 – 0.5, 1 and 5 μM Fe (D–F,I,J), respectively. Control: calli grown and subcultured on medium with sufficient Fe (50 μM). Scale of bars = 10 mm.
Figure 2
Figure 2
Establishment of selected plant lines, for example, derived from Fe-efficient potato (cv. “Iwa”) callus line selected when grown on medium supplemented with 0.005 μM Fe (A). Two plant lines named as A1 and A2 (shown in B and C), respectively. Scale of bars: A = 10 mm, B,C = 20 mm.
Figure 3
Figure 3
Differential tolerance to Fe deficiency-induced chlorosis among potato (cv. “Iwa”) plant lines and control plants (SK). Top to bottom: (A–E) plant lines, that were regenerated from calli tolerant to low Fe levels (0.005–5 μM Fe), were grown on the same respective medium (A: 0.005 – E: 5 μM Fe) used for isolation of the calli. Plants are indicated as Fe-efficient (A1, B2, D1, E1–3, and E7) and Fe-inefficient (A2–4, B1, B3, C1–5, D2–4, E6, and SK). All scale bars = 20 mm.
Figure 4
Figure 4
Visual chlorosis rating scores of potato plant lines (A–E) and parental biotype (SK) cultured in Fe-deficient medium supplemented with 0.005 μM Fe (for A1-ASK plant lines derived from Fe-efficient calli selected on 0.005 μM Fe-containing medium), 0.5 μM Fe (for B1-BSK), 0.1 μM Fe (for C1-CSK), 1 μM Fe (for D1-DSK) and 5 μM Fe (for E1-ESK). Chlorosis scores were taken within 3 months of culture for all 12 biological replicates per plant line and control plant.
Figure 5
Figure 5
Stereomicroscopic view of morphological characteristics of parental potato (cv. “Iwa”) stock plants (A,B), and plant lines (C–E) growing under Fe deficiency conditions. From top to bottom: control plants (A,B) with slender to thin long stems, lateral stem, long intermodal distance, and fewer number of leaves; Fe-efficient (C,D) and inefficient (E) plant lines with thick short stems, short intermodal distance, numerous average to broad sized and chlorotic leaves (E). Scale of bars = 5 mm.
Figure 6
Figure 6
Effect of Fe deficiency on stem height (A), intermodal distance (B), leaf length (C), number of leaves per plant (D) and root length (E) of potato lines and control (cv. “Iwa”) parental biotype (SK). Morphological parameters were measured (n = 9) after 2 months of exposure to Fe deficiency treatments (0.005 μM Fe for A plant lines, 0.5 μM Fe for B lines, 0.1 μM Fe for C lines, 1 μM Fe for D lines and 5 μM Fe for E lines).
Figure 7
Figure 7
Normalized relative expression of fer3 in leaf (A) and root (B) of S. tuberosum (cv. “Iwa”) plants with differential tolerance to Fe-deficiency induced chlorosis. Plants were exposed to Fe-deficiency conditions for three months. Values are means of relative transcript levels (in fold change) of four replicates for each of two biological replicates (n = 8). EF1 and L2 reference genes were used to normalize fer3 expression levels. Error bars represent the ± standard error (SE) of the mean calculated for the combined sample and biological replicates. A1, B2, B9, D1, E1-3 and E7 represent plant lines selected to be potentially Fe-efficient based on IDC scores ≤2.42.
Figure 8
Figure 8
Normalized relative expression of irt1 in leaf (A) and root (B) of S. tuberosum (cv. “Iwa”) plants with differential IDC tolerance. Plants were exposed to Fe-deficiency conditions for three months. Values are means of relative transcript levels (in fold change) of four replicates for each of two biological replicates (n = 8). EF1 and L2 reference genes were used to normalize irt1 expression levels. Error bars represent the ± standard error (SE) of the mean calculated for the combined sample and biological replicates. A1, B2, B9, D1, E1–3, and E7 are plant lines selected to be potentially Fe-efficient based on IDC scores ≤2.42.

Similar articles

Cited by

References

    1. Abadia J., Vazquez S., Rellan-Alvarez R., El-Jendoubi H., Abadia A., Alvarez-Ferández A., et al. . (2011). Towards a knowledge-based correction of iron chlorosis. Plant Physiol. Biochem. 49, 471–482. 10.1016/j.plaphy.2011.01.026 - DOI - PubMed
    1. Barberon M., Zelazny E., Robert S., Conéjéro G., Curie C., Friml J., et al. . (2011). Monoubiquitin-dependent endocytosis of the iron-regulated transporter 1 (IRT1) transporter controls iron uptake in plants. Proc. Natl. Acad. Sci. U.S.A. 108, E450–E458 10.1073/pnas.1100659108 - DOI - PMC - PubMed
    1. Barton L. L., Abadía J. (2006). Iron Nutrition in Plants and Rhizospheric Microorganisms. Springer.
    1. Bert P., Bordenave L., Donnart M., He'vin C., Ollat N., Decroocq S. (2013). Mapping genetic loci for tolerance to lime-induced iron deficiency chlorosis in grapevine rootstocks (Vitis sp.). Theore. Appl. Genet. 126, 451–473. 10.1007/s00122-012-1993-5 - DOI - PubMed
    1. Bienfait H., Frits D., Letty A., Kramere D. (1987). Control of the development of iron-efficiency reactions in potato as a response to iron deficiency is located in the roots. Plant Physiol. 83, 244–247. 10.1104/pp.83.2.244 - DOI - PMC - PubMed

LinkOut - more resources