Relation of Renal Function with Left Ventricular Systolic Function and NT-proBNP Level and Its Prognostic Implication in Heart Failure with Preserved versus Reduced Ejection Fraction: an analysis from the Korean Heart Failure (KorHF) Registry
- PMID: 28955391
- PMCID: PMC5614949
- DOI: 10.4070/kcj.2017.0050
Relation of Renal Function with Left Ventricular Systolic Function and NT-proBNP Level and Its Prognostic Implication in Heart Failure with Preserved versus Reduced Ejection Fraction: an analysis from the Korean Heart Failure (KorHF) Registry
Abstract
Background and objectives: The relationship between ejection fraction (EF), N-terminal pro-brain natriuretic peptide (NT-proBNP) levels and renal function is unknown as stratified by heart failure (HF) type. We investigated their relation and the prognostic value of renal function in heart failure with preserved ejection fraction (HFpEF) vs. reduced ejection fraction (HFrEF).
Materials and methods: NT-proBNP, glomerular filtration rate (GFR), and EF were obtained in 1,932 acute heart failure (AHF) patients. HFrEF was defined as EF<50%, and renal dysfunction as GFR<60 mL/min/1.73 m2 (mild renal dysfunction: 30≤GFR<60 mL/min/1.73 m2; severe renal dysfunction: GFR<30 mL/min/1.73 m2). The primary outcome was 12-month all-cause death.
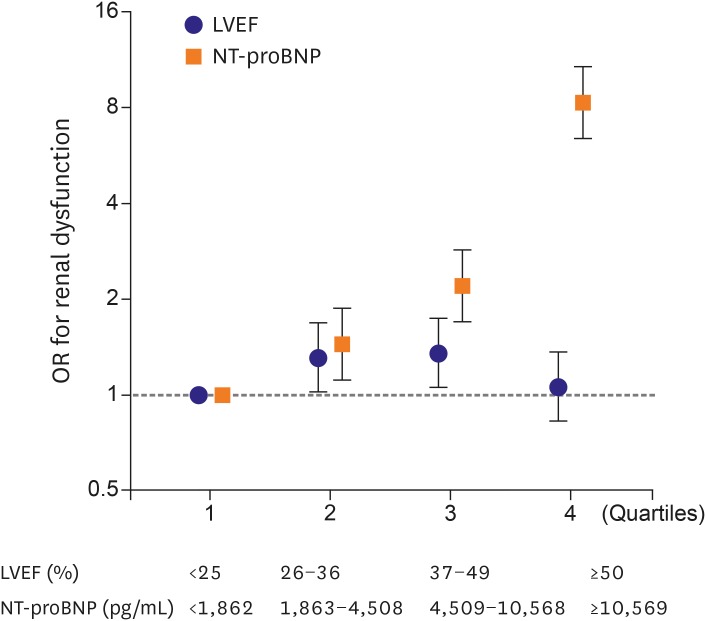
Results: There was an inverse correlation between GFR and log NT-proBNP level (r=-0.298, p<0.001), and between EF and log NT-proBNP (r=-0.238, p<0.001), but no correlation between EF and GFR (r=0.017, p=0.458). Interestingly, the prevalence of renal dysfunction did not differ between HFpEF and HFrEF (49% vs. 52%, p=0.210). Patients with renal dysfunction had higher 12-month mortality in both HFpEF (7.9% vs. 15.2%, log-rank p=0.008) and HFrEF (8.6% vs. 16.8%, log-rank p<0.001). Multivariate analysis showed severe renal dysfunction was an independent predictor of 12-month mortality (hazard ratio [HR], 2.08; 95% confidence interval [CI], 1.40-3.11). When stratified according to EF: the prognostic value of severe renal dysfunction was attenuated in HFpEF patients (HR, 1.46; 95% CI, 0.66-3.21) contrary to HFrEF patients (HR, 2.43; 95% CI, 1.52-3.89).
Conclusion: In AHF patients, the prevalence of renal dysfunction did not differ between HFpEF and HFrEF patients. However, the prognostic value of renal dysfunction was attenuated in HFpEF patients.
Keywords: Ejection fraction; Heart failure; Pro-brain natriuretic peptide (1-76); Prognosis; Renal dysfunction.
Conflict of interest statement
Conflict of Interest: The authors have no financial conflicts of interest.
Figures


Similar articles
-
Prognosis and NT-proBNP in heart failure patients with preserved versus reduced ejection fraction.Heart. 2019 Aug;105(15):1182-1189. doi: 10.1136/heartjnl-2018-314173. Epub 2019 Apr 8. Heart. 2019. PMID: 30962192 Free PMC article.
-
[Prognostic value of N-terminal B-type natriuretic peptide on all-cause mortality in heart failure patients with preserved ejection fraction].Zhonghua Xin Xue Guan Bing Za Zhi. 2019 Nov 24;47(11):875-881. doi: 10.3760/cma.j.issn.0253-3758.2019.11.005. Zhonghua Xin Xue Guan Bing Za Zhi. 2019. PMID: 31744276 Chinese.
-
Prognostic impact of beta-blocker use by N-terminal pro-brain natriuretic peptide level in acute heart failure patients.ESC Heart Fail. 2024 Dec;11(6):3842-3853. doi: 10.1002/ehf2.14974. Epub 2024 Jul 17. ESC Heart Fail. 2024. PMID: 39015043 Free PMC article.
-
Diagnostic and prognostic value of serum soluble suppression of tumorigenicity-2 in heart failure with preserved ejection fraction: A systematic review and meta-analysis.Front Cardiovasc Med. 2022 Sep 20;9:937291. doi: 10.3389/fcvm.2022.937291. eCollection 2022. Front Cardiovasc Med. 2022. PMID: 36204571 Free PMC article.
-
Relationship of Nonalcoholic Fatty Liver Disease and Heart Failure With Preserved Ejection Fraction.JACC Basic Transl Sci. 2021 Nov 22;6(11):918-932. doi: 10.1016/j.jacbts.2021.07.010. eCollection 2021 Nov. JACC Basic Transl Sci. 2021. PMID: 34869957 Free PMC article. Review.
Cited by
-
Imaging approaches in risk stratification of patients with coronary artery disease: a narrative review.Arch Med Sci. 2024 Jun 6;21(1):16-31. doi: 10.5114/aoms/188808. eCollection 2025. Arch Med Sci. 2024. PMID: 40190322 Free PMC article.
-
Impaired renal function and mortalities in acute heart failure with different phenotypes.ESC Heart Fail. 2022 Oct;9(5):2928-2936. doi: 10.1002/ehf2.14002. Epub 2022 Jun 17. ESC Heart Fail. 2022. PMID: 35712992 Free PMC article.
-
Combination of serum TIMP-3, CA125, and NT-proBNP in predicting ventricular remodeling in patients with heart failure following acute myocardial infarction.Cardiovasc Diagn Ther. 2020 Oct;10(5):1184-1191. doi: 10.21037/cdt-20-399. Cardiovasc Diagn Ther. 2020. PMID: 33224742 Free PMC article.
-
Diagnostic and Prognostic Value of Aminoterminal Prohormone of Brain Natriuretic Peptide in Heart Failure with Mildly Reduced Ejection Fraction Stratified by the Degree of Renal Dysfunction.J Clin Med. 2024 Jan 16;13(2):489. doi: 10.3390/jcm13020489. J Clin Med. 2024. PMID: 38256622 Free PMC article.
-
Microalbuminuria and its Prognostic Significance in Patients with Acute Heart Failure with Preserved, Mid-Range, and Reduced Ejection Fraction.Arq Bras Cardiol. 2022 Apr;118(4):703-709. doi: 10.36660/abc.20201144. Arq Bras Cardiol. 2022. PMID: 35137781 Free PMC article. English, Portuguese.
References
-
- Writing Group Members Heart disease and stroke statistics--2010 update: a report from the American Heart Association. Circulation. 2010;121:e46–e215. - PubMed
-
- Ronco C, Haapio M, House AA, Anavekar N, Bellomo R. Cardiorenal syndrome. J Am Coll Cardiol. 2008;52:1527–1539. - PubMed
-
- Januzzi JL, van Kimmenade R, Lainchbury J, et al. NT-proBNP testing for diagnosis and short-term prognosis in acute destabilized heart failure: an international pooled analysis of 1256 patients: the International Collaborative of NT-probnp Study. Eur Heart J. 2006;27:330–337. - PubMed
LinkOut - more resources
Full Text Sources
Other Literature Sources
Research Materials
Miscellaneous