. 2017:1:0027.
doi: 10.1038/s41551-016-0027. Epub 2017 Feb 6.

Rapid intraoperative histology of unprocessed surgical specimens via fibre-laser-based stimulated Raman scattering microscopy

Affiliations

Rapid intraoperative histology of unprocessed surgical specimens via fibre-laser-based stimulated Raman scattering microscopy

Daniel A Orringer et al. Nat Biomed Eng. 2017.

Abstract

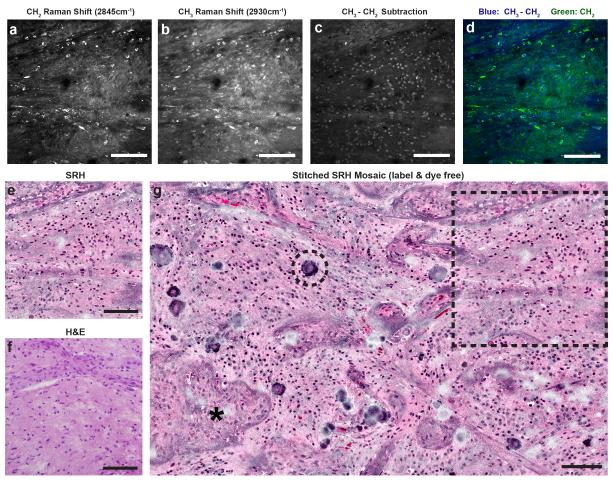
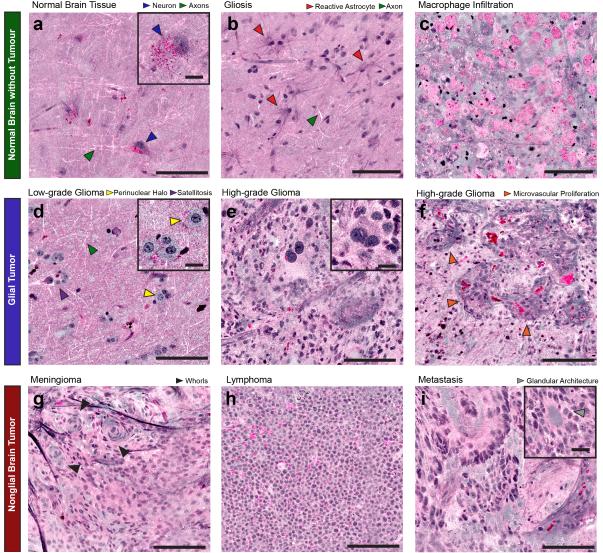
Conventional methods for intraoperative histopathologic diagnosis are labour- and time-intensive, and may delay decision-making during brain-tumour surgery. Stimulated Raman scattering (SRS) microscopy, a label-free optical process, has been shown to rapidly detect brain-tumour infiltration in fresh, unprocessed human tissues. Here, we demonstrate the first application of SRS microscopy in the operating room by using a portable fibre-laser-based microscope and unprocessed specimens from 101 neurosurgical patients. We also introduce an image-processing method - stimulated Raman histology (SRH) - which leverages SRS images to create virtual haematoxylin-and-eosin-stained slides, revealing essential diagnostic features. In a simulation of intraoperative pathologic consultation in 30 patients, we found a remarkable concordance of SRH and conventional histology for predicting diagnosis (Cohen's kappa, κ > 0.89), with accuracy exceeding 92%. We also built and validated a multilayer perceptron based on quantified SRH image attributes that predicts brain-tumour subtype with 90% accuracy. Our findings provide insight into how SRH can now be used to improve the surgical care of brain tumour patients.


Figures

Fig. 1
Fig. 1. Engineering a clinical SRS microscope
(A) SRS microscope in the UMHS operating room. (B) Key components of the dual-wavelength fiber-laser-coupled microscope required to create a portable, clinically compatible SRS imaging system. The top arm of the laser diagram indicates the scheme for generating the Stokes beam (red), while the bottom arm generates the pump beam (orange). Both beams are combined (purple) and passed through the specimen. (C) Raw 2845cm−1 image of human tissue before, and (D) after balanced-detection-based noise cancellation. HNLF = highly non-linear fiber; PPLN = periodically poled lithium niobate; PD = photo diode.
Fig. 2
Fig. 2. Creating virtual H&E slides with the clinical SRS microscope
(A) CH2 and (B) CH3 images are acquired and (C) subtracted. (D) The CH2 image is assigned to the green channel, and CH3-CH2 image is assigned to the blue channel to create a two-color blue-green image. Applying an H&E lookup table, SRH images (E) are comparable to a similar section of tumor (F) imaged after formalin-fixation, paraffin-embedding (FFPE), and H&E staining. (G) Mosaic tiled image of several SRH FOVs to create a mosaic of imaged tissue. Asterisk (*) indicates a focus of microvascular proliferation, dashed circle indicates calcification, and the dashed box demonstrates how the FOV in (E) fits into the larger mosaic. Scale bars = 100μm.
Fig. 3
Fig. 3. Imaging of key diagnostic histoarchitectural features with SRH
(A) Normal cortex reveals scattered pyramidal neurons (blue arrowheads) with angulated boundaries and lipofuscin granules, which appear red. White linear structures are axons (green arrowheads). (B) Gliotic tissue contains reactive astrocytes with radially directed fine protein-rich processes (red arrowheads) and axons (green arrowheads). (C) A macrophage infiltrate near the edge of a glioblastoma reveals round, swollen cells with lipid-rich phagosomes. (D) SRH reveals scattered “fried-egg” tumor cells with round nuclei, ample cytoplasm, perinuclear halos (yellow arrowheads), and neuronal satellitosis (purple arrowhead) in a diffuse 1p19q-co-deleted low-grade oligodendroglioma. Axons (green arrowhead) are apparent in this tumor-infiltrated cortex as well. (E) SRH demonstrates hypercellularity, anaplasia, and cellular and nuclear pleomorphism in a glioblastoma. A large binucleated tumor cell is shown (inset) in contrast to smaller adjacent tumor cells. (F) SRH of another glioblastoma reveals microvascular proliferation (orange arrowheads) with protein-rich basement membranes of angiogenic vasculature appearing purple. SRH reveals (G) the whorled architecture of meningioma (black arrowheads), (H) monomorphic cells of lymphoma with high nuclear:cytoplasmic ratio, and (I) the glandular architecture (inset; gray arrowhead) of a metastatic colorectal adenocarcinoma. Large image scale bars = 100μm; inset image scale bars =20μm.
Fig. 4
Fig. 4. SRH reveals structural heterogeneity in human brain tumors
(a) An MRI of a patient with a history of low-grade oligodendroglioma who was followed for an enlarging enhancing mass (yellow arrowhead) in the previous resection cavity (red circle). SRH imaging of the resected tissue reveals areas with low-grade oligodendroglioma architecture in some regions (left column) with foci of anaplasia (right column) in other areas of the same specimen. (b) Gangliogliomas are typically composed of cells of neuronal and glial lineage. SRH reveals architectural differences between a shallow tissue biopsy at the location indicated with a green arrowhead on the preoperative MRI where disorganized binucleated dysplastic neurons predominate (left), and a deeper biopsy (blue arrowhead) where architecture is more consistent with a hypercellular glioma (right). FFPE H&E images are shown for comparison.
Fig. 5
Fig. 5. Simulation of intraoperative histologic diagnosis with SRH
A web-based survey consisting of specimens from 30 patients (patients 72-101) imaged with both SRH and conventional H&E methods was administered to three neuropathologists. Neuropathologists recorded free-form responses as they would during a clinical intraoperative histologic consult. Responses were graded based on whether tissue was judged as (A) lesional or non-lesional, (B) glial or non-glial, and (C) on the accuracy of diagnosis. SRH and H&E preparations for six examples of portions of specimens presented in the survey are shown: gliotic brain tissue (patient 91), medulloblastoma (patient 101), anaplastic astrocytoma (patient 76), meningioma (patient 95), glioblastoma (patient 82), and metastatic carcinoma (patient 74). Scale bars = 50μm.
Fig. 6
Fig. 6. MLP classification of SRH images
The specimen from patient 87, a low-grade ependymoma, was classified by the MLP as a low-grade glial tumor. (A) An SRH mosaic depicting the low-grade glial tumor diagnostic class with individual FOVs designated by dashed lines (center). Four individual FOVs are depicted at higher scale, with the MLP diagnostic probability for all four categories listed above: P(NL) = probability of non-lesional; P(LGG) = probability of low-grade glial; P(HGG) = probability of high-grade glial; P(NG) = probability of non-glial. Representative FOVs include a FOV with a small number of ovoid tumor cells (arrowhead) classified as low-grade glioma (top left, orange outline), a FOV with high cellularity with frequent hyalinized blood vessels (arrowheads) classified as non-glial tumor (top right, green outline), a FOV with moderate cellularity and abundant piloid processes (bottom right, yellow outline) classified as a low-grade glioma, and a FOV with higher cellularity and several prominent vessels (arrowheads) classified as high-grade glial tumor (bottom left, blue outline). Scale bars are 100μm for the individual FOVs and 500μm for the mosiac image. (B) Probability heatmaps overlaid on the SRH mosaic image indicate the MLP-determined probability of class membership for each FOV across the mosaic image for the four diagnostic categories. Colored boxes correspond to the FOVs highlighted in A.
Fig 7
Fig 7. MLP-based diagnostic prediction
(A) Heat map depiction of the classification of cases as lesional or non-lesional via MLP. Green checks indicate correct MLP prediction, red circles indicate incorrect prediction. (B) Heat map depiction of the classification of cases as glial or non-glial via MLP. Green checks indicate correct MLP prediction, red circles indicate incorrect prediction. (C) Summary of MLP results from test set of 30 neurosurgical cases (patients 72-101). The fraction of correct tiles is indicated by the hue and intensity of each heat map tile, as well as the predicted diagnostic class.

References

    1. Eisenhardt L, Cushing H. Diagnosis of Intracranial Tumors by Supravital Technique. Am J Pathol. 1930;6:541–552. 547. - PMC - PubMed
    1. Somerset HL, Kleinschmidt-DeMasters BK. Approach to the intraoperative consultation for neurosurgical specimens. Advances in anatomic pathology. 2011;18:446–449. doi: 10.1097/PAP.0b013e3182169934. - DOI - PubMed
    1. Sanai N, Polley M-Y, McDermott MW, Parsa AT, Berger MS. An extent of resection threshold for newly diagnosed glioblastomas. Journal of neurosurgery. 2011;115:3–8. doi: 10.3171/2011.2.JNS10998. - DOI - PubMed
    1. Freudiger CW, et al. Label-free biomedical imaging with high sensitivity by stimulated Raman scattering microscopy. Science. 2008;322:1857–1861. doi: 10.1126/science.1165758. doi:322/5909/1857 [pii] - DOI - PMC - PubMed
    1. Lu FK, et al. Label-Free Neurosurgical Pathology with Stimulated Raman Imaging. Cancer Res. 2016 doi: 10.1158/0008-5472.CAN-16-0270. - DOI - PMC - PubMed