. 2015 Nov 21:5:8-15.
doi: 10.1016/j.bbrep.2015.11.020. eCollection 2016 Mar.

Soluble form of the ST2 gene product exhibits growth promoting activity in NIH-3T3 cells

Affiliations

Soluble form of the ST2 gene product exhibits growth promoting activity in NIH-3T3 cells

Shin-Ichi Tominaga et al. Biochem Biophys Rep. .

Abstract

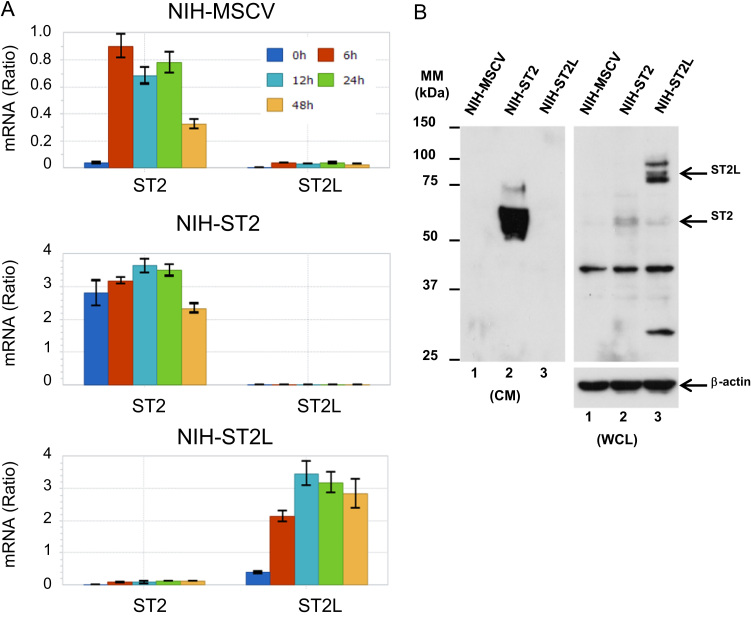
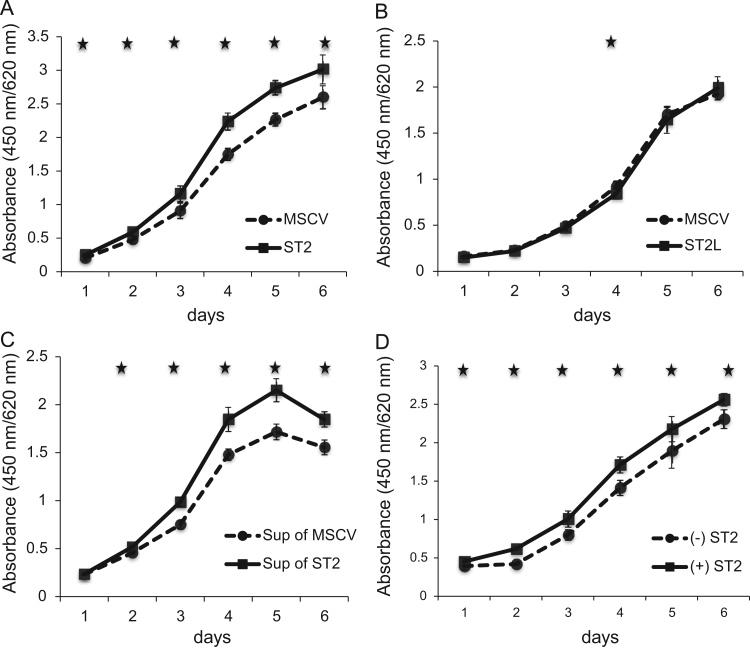
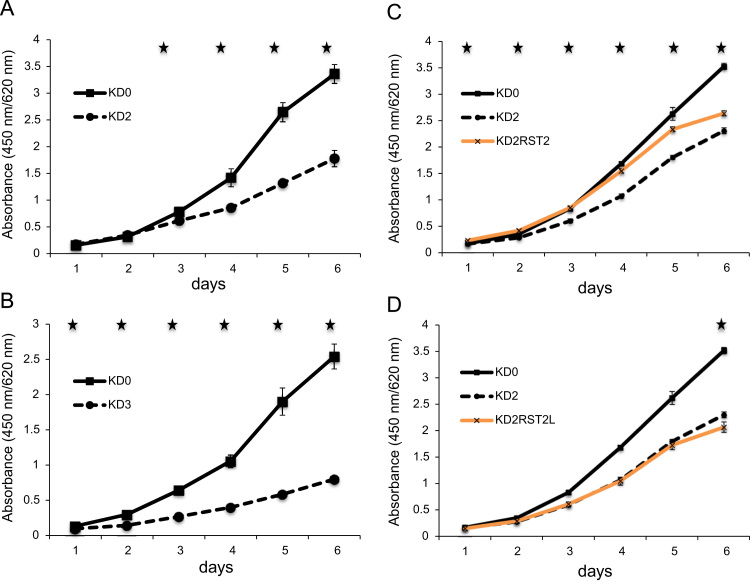
The ST2 gene is induced in murine fibroblast cells at the start of cell proliferation. Although IL-33 has been identified as a ligand for one of the two major gene products of ST2 - namely, the transmembrane receptor form ST2L - prompting immunological research on inflammation, the roles of the ST2 gene products in cell proliferation remain to be elucidated. Using a cell proliferation assay system with NIH-3T3 cells, a normal murine fibroblast cell line, we found that treatment with recombinant ST2 caused an acceleration of cell proliferation, suggesting that ST2 acts in an autocrine/paracrine fashion. Strikingly, shRNA-induced knockdown of both ST2 gene products, ST2 and ST2L, reduced cell proliferation. This effect was effectively canceled by the expression of shRNA-resistant ST2, but not shRNA-resistant ST2L. The novel enhancement of cell proliferation by ST2 appears to involve positive feedback. Since the ST2 level is increased in various diseases involving inflammation, future investigations into the role of ST2 gene products in relation to various diseases, including malignancies, may be warranted.

Keywords: Cell proliferation; DMEM, Dulbecco’s Modified Eagle’s Medium; EDTA, ethylenediaminetetraacetic acid; ELISA, enzyme-linked immunosorbent assay; FBS, fetal bovine serum; Fibroblast; GAPDH, glyceraldehyde-3-phosphate dehydrogenase; RT-PCR, reverse transcription-polymerase chain reaction; S.D., standard deviation; SDS-PAGE, sodium dodecylsulfate-polyacrylamide gel electrophoresis; ST2 gene; bp, base pairs; cDNA, complementary DNA; shRNA, short hairpin RNA.


Figures

Fig. 1
Fig. 1
RT-PCR analysis of NIH-3T3 cells. (A) RNA extraction and subsequent RT-PCR were carried out as described in Section 2. The values under h indicate the hours after growth stimulation. All the products shown correspond to the expected lengths described in Section 2. (B) Quantitative PCR was carried out as described in Section 2. mRNA(Ratio) represents the relative amount of mRNA of ST2 or ST2L to GAPDH.
Fig. 2
Fig. 2
Expression of ST2 and ST2L in the derivative cells of NIH-3T3 cells. (A) Quantitative PCR analysis was performed as in Fig. 1B. (B) FLAG-tagged ST2 and ST2L proteins in conditioned media (CM) and whole cell lysate (WCL) from the infected NIH-3T3 cells were detected by immunoblotting with M2 antibody.
Fig. 3
Fig. 3
Cell proliferation assay. (A) A cell proliferation assay was carried out for NIH-ST2 cells (solid line) and control NIH-MSCV cells (broken line) as described in Section 2. Error bars indicate the S.D. The asterisks denote P values <0.01. (B) A cell proliferation assay was carried out for NIH-ST2L cells (solid line) and control NIH-MSCV cells (broken line) as in Panel A. (C) The culture supernatants of NIH-ST2 cells (solid line) and NIH-MSCV cells (broken line) were collected after 3 days, and then freshly seeded NIH-3T3 cells were cultured with the conditioned medium. A cell proliferation assay was carried out as in Panel A. (D) The recombinant soluble ST2 was purified as described in Section 2, and a cell proliferation assay was carried out as in Panel A. The concentration of soluble ST2 was 500 ng/mL. Error bars indicate the S.D. The asterisks denote P values <0.01.
Fig. 4
Fig. 4
Knockdown of the ST2 gene products and expression of shRNA-resistant ST2 and ST2L in KD2 cells. (A) The knockdown procedure was carried out as described in Section 2, and quantitative PCR was carried out as in Fig. 1B. (B) Native (nat) and shRNA-resistant (mut) nucleotide sequences from nucleotides number 876 to 894 were aligned along with corresponding amino acid sequence in the middle. Exchanging the 3rd letter of each of 5 codons did not alter the resultant amino acid sequence. (C) The KD2 cells introduced with shRNA-resistant ST2 and shRNA-resistant ST2L expression vectors containing mutant sequences (mut in Panel B) were designated KD2RST2 and KD2RST2L, respectively. Quantitative PCR was carried out as in Fig. 1B. (D) FLAG-tagged shRNA-resistant ST2 and ST2L proteins in the conditioned media (CM) and whole cell lysate (WCL) of the infected NIH-3T3 cells were detected by immunoblotting with M2 antibody.
Fig. 5
Fig. 5
Effect of knockdown of both ST2 and ST2L, and recovery of individual ST2 or ST2L, on the cell proliferation of NIH-3T3 cells. (A) and (B) The cell proliferation assay was carried out as in Fig. 3 for KD2 (broken line in Panel A) and KD3 (broken line in Panel B) in comparison to the control KD0 (solid lines). Error bars indicate the S.D. The asterisks denote P values <0.01. (C) The cell proliferation was recovered to the control level in the case of KD2RST2 (orange line). Error bars indicate the S.D. The asterisks denote P values <0.01, comparing KD2 with KD2RST2. (D) No recovery was observed in the case of KD2RST2L (orange line). Error bars indicate the S.D. The asterisks denote P values <0.01, comparing KD2 with KD2RST2L. (For interpretation of the references to color in this figure legend, the reader is referred to the web version of this article.)
Fig. 6
Fig. 6
Effect of soluble ST2 on cell cycle progression and cell viability in NIH-3T3 cells. (A) NIH-3T3 cells were released from G0 phase into culture medium with (+) or without (−) 500 ng/mL of recombinant soluble ST2. The cells were harvested at the indicated time points for cell cycle analysis by flow cytometer. (B) NIH-3T3 cells were released from G0 phase for 12 h before the medium were replaced by culture medium with (+) or without (−) 500 ng/mL of recombinant soluble ST2 for 48 h. After this period, the cells were harvested for cell cycle analysis by flow cytometer. (C) NIH-3T3 cells were released from G0 phase into culture medium with (+) or without (–) 500 ng/mL of recombinant soluble ST2. After 2 and 4 days, cell viability was assessed by the trypan blue exclusion assay. Error bars, S.D. (n=3).

References

    1. Tominaga S. Murine mRNA for the β-subunit of integrin is increased in BALB/c-3T3 cells entering the G1 phase from the G0 state. FEBS Lett. 1988;238:315–319. - PubMed
    1. Tominaga S. A putative protein of a growth-specific cDNA from BALB/c-3T3 cells is highly similar to the extracellular portion of mouse interleukin 1 receptor. FEBS Lett. 1989;258:301–304. - PubMed
    1. Yanagisawa K., Takagi T., Tsukamoto T., Tetsuka T., Tominaga S. Presence of a novel primary response gene ST2L, encoding a product highly similar to the interleukin 1 receptor type I. FEBS Lett. 1993;318:83–87. - PubMed
    1. Schmitz J., Owyang A., Oldham E., Song Y., Murphy E., McClanahan T.K., Zurawski G., Moshrefi M., Qin J., Li X., Gorman D.M., Bazan J.F., Kastelein R.A. IL-33, an interleukin-1-like cytokine that signals via the IL-1 receptor-related protein ST2 and induces T helper type 2-associated cytokines. Immunity. 2005;23:479–490. - PubMed
    1. Hayakawa H., Hayakawa M., Kume A., Tominaga S. Soluble ST2 blocks interleukin-33 signaling in allergic airway inflammation. J. Biol. Chem. 2007;282:26369–26380. - PubMed

LinkOut - more resources