

The Hsp60 protein of helicobacter pylori displays chaperone activity under acidic conditions
- PMID: 28955994
- PMCID: PMC5614549
- DOI: 10.1016/j.bbrep.2016.11.011
The Hsp60 protein of helicobacter pylori displays chaperone activity under acidic conditions
Abstract
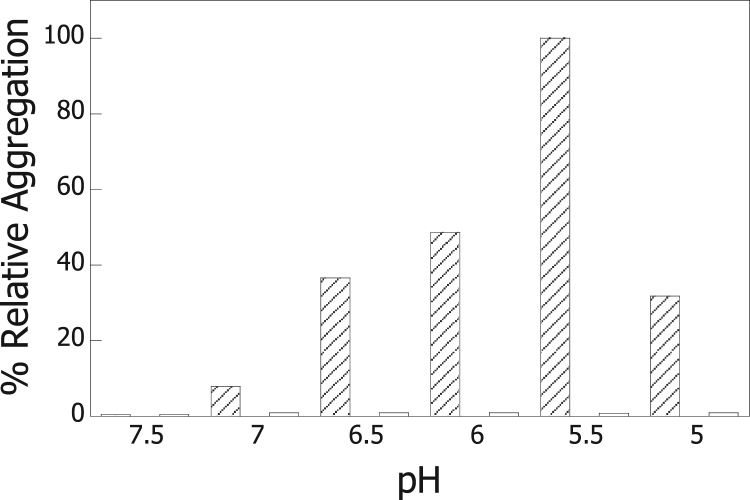
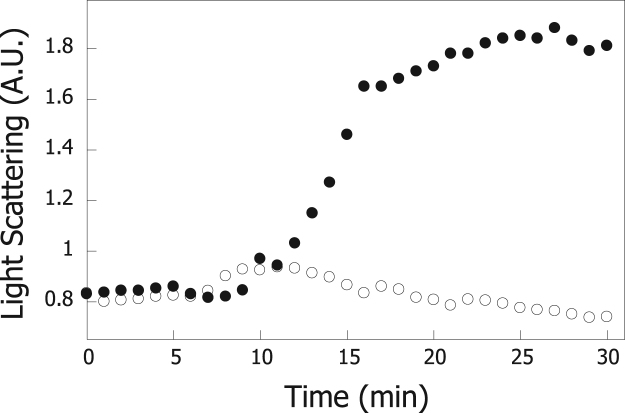
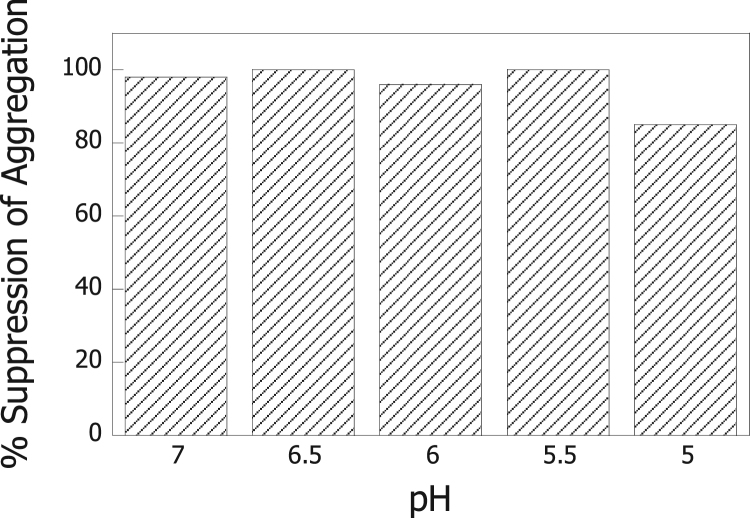
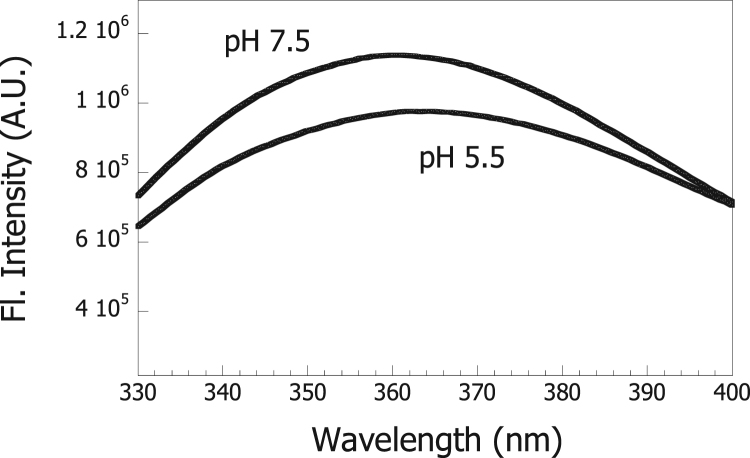
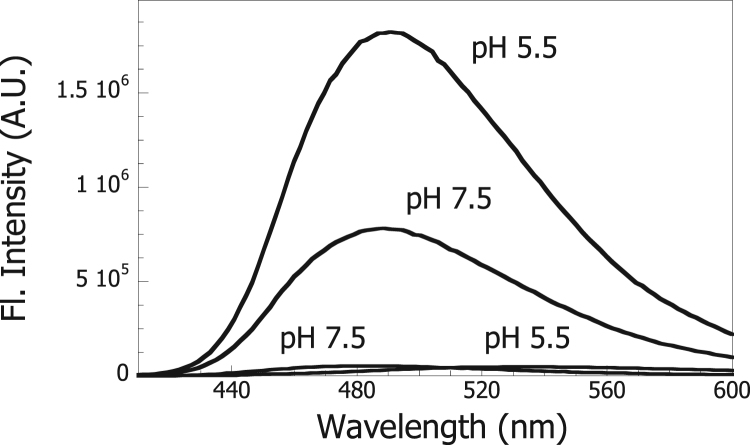
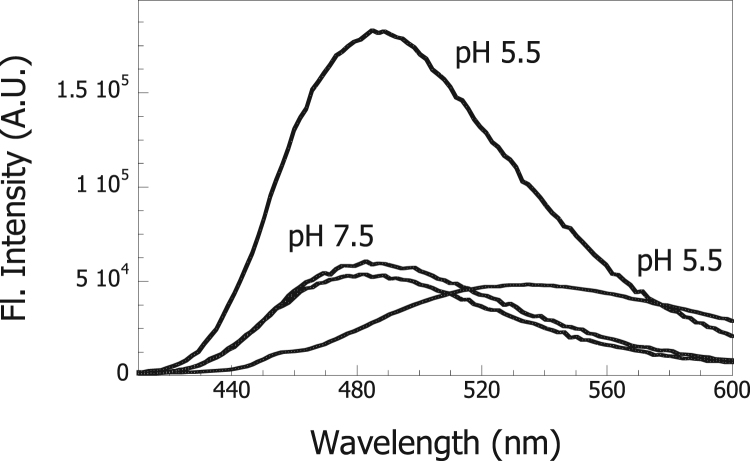
The heat shock protein, Hsp60, is one of the most abundant proteins in Helicobacter pylori. Given its sequence homology to the Escherichia coli Hsp60 or GroEL, Hsp60 from H. pylori would be expected to function as a molecular chaperone in this organism. H. pylori is an organism that grows on the gastric epithelium, where the pH can fluctuate between neutral and 4.5 and the intracellular pH can be as low as 5.0. This study was performed to test the ability of Hsp60 from H. pylori to function as a molecular chaperone under mildly acidic conditions. We report here that Hsp60 could suppress the acid-induced aggregation of alcohol dehydrogenase (ADH) in the 7.0-5.0 pH range. Hsp60 was found to undergo a conformational change within this pH range. It was also found that exposure of hydrophobic surfaces of Hsp60 is significant and that their exposure is increased under acidic conditions. Although, alcohol dehydrogenase does not contain exposed hydrophobic surfaces, we found that their exposure is triggered at low pH. Our results demonstrate that Hsp60 from H. pylori can function as a molecular chaperone under acidic conditions and that the interaction between Hsp60 and other proteins may be mediated by hydrophobic interactions.
Keywords: Acid stress; Conformational changes; Hsp60; Molecular chaperone; Protein aggregation.
Figures
Similar articles
-
Mechanistic Insight Into the Interaction Between Helicobacter pylori Urease Subunit α and Its Molecular Chaperone Hsp60.Front Microbiol. 2019 Feb 5;10:153. doi: 10.3389/fmicb.2019.00153. eCollection 2019. Front Microbiol. 2019. PMID: 30804917 Free PMC article.
-
Heat shock protein 60 (HSP60) immunoreactivity in gastric epithelium associated with Helicobacter pylori infection: a pitfall in immunohistochemically interpreting HSP60-mediated autoimmune responses.Pathol Int. 1999 Jan;49(1):88-90. doi: 10.1046/j.1440-1827.1999.00828.x. Pathol Int. 1999. PMID: 10227731
-
The proteomics analysis of extracellular vesicles revealed the possible function of heat shock protein 60 in Helicobacter pylori infection.Cancer Cell Int. 2023 Nov 16;23(1):272. doi: 10.1186/s12935-023-03131-1. Cancer Cell Int. 2023. PMID: 37974232 Free PMC article.
-
Helicobacter pylori alcohol dehydrogenase.EXS. 1994;71:185-95. doi: 10.1007/978-3-0348-7330-7_19. EXS. 1994. PMID: 8032149 Review.
-
The gastric biology of Helicobacter pylori.Annu Rev Physiol. 2003;65:349-69. doi: 10.1146/annurev.physiol.65.092101.142156. Epub 2002 May 1. Annu Rev Physiol. 2003. PMID: 12471160 Review.
Cited by
-
Transcriptomic Analysis of the Brucella melitensis Rev.1 Vaccine Strain in an Acidic Environment: Insights Into Virulence Attenuation.Front Microbiol. 2019 Feb 14;10:250. doi: 10.3389/fmicb.2019.00250. eCollection 2019. Front Microbiol. 2019. PMID: 30837973 Free PMC article.
-
The Relation Between Host TLR9 -1486T/C, rs187084 Gene Polymorphisms and Helicobacter pylori cagA, sodB, hsp60, and vacA Virulence Genes among Gastric Cancer Patients.Pol J Microbiol. 2022 Feb 27;71(1):35-42. doi: 10.33073/pjm-2022-003. Pol J Microbiol. 2022. PMID: 35635169 Free PMC article.
-
Mechanistic Insight Into the Interaction Between Helicobacter pylori Urease Subunit α and Its Molecular Chaperone Hsp60.Front Microbiol. 2019 Feb 5;10:153. doi: 10.3389/fmicb.2019.00153. eCollection 2019. Front Microbiol. 2019. PMID: 30804917 Free PMC article.
-
Plant Heat Shock Proteins Are More Effective in Enhancing Recombinant Alcohol Dehydrogenase Activity than Bacterial Ones In Vitro.Iran J Biotechnol. 2024 Jul 1;22(3):e3878. doi: 10.30498/ijb.2024.442517.3878. eCollection 2024 Jul. Iran J Biotechnol. 2024. PMID: 39737206 Free PMC article.
-
Concurrent detection of cagA, vacA, sodB and hsp60 virulence genes and their relationship with clinical outcomes of disease in Helicobacter pylori isolated strains of southwest of Iran.Iran J Microbiol. 2019 Jun;11(3):198-205. Iran J Microbiol. 2019. PMID: 31523402 Free PMC article.
References
-
- Covacci A., Telford G., Del Giudice J., Parsonnet J., Rappuoli R. Helicobacter pylori virulence and genetic geography. Science. 1999;284:1328–1333. - PubMed
-
- Slonczewski J.L., McGee D.J., Phillips J., Kirkpatrick C., Mobley H.L.T. pH-Dependent protein profiles of helicobacter pylori analyzed by two-dimensional gels. Helicobacter. 2000;5:240–247. - PubMed
-
- Sachs G., Weeks D.L., Wen Y., Marcus E.A., Scott D.R. Acid acclimation by helicobacter pylori. Physiology. 2005;20:429–438. - PubMed
LinkOut - more resources
Full Text Sources
Other Literature Sources
Research Materials
Miscellaneous
