Review
. 2017 Oct 23;142(21):4005-4017.
doi: 10.1039/c7an01055a.

Vibrational spectroscopy and imaging: applications for tissue engineering

Affiliations
Review

Vibrational spectroscopy and imaging: applications for tissue engineering

William Querido et al. Analyst. .

Abstract

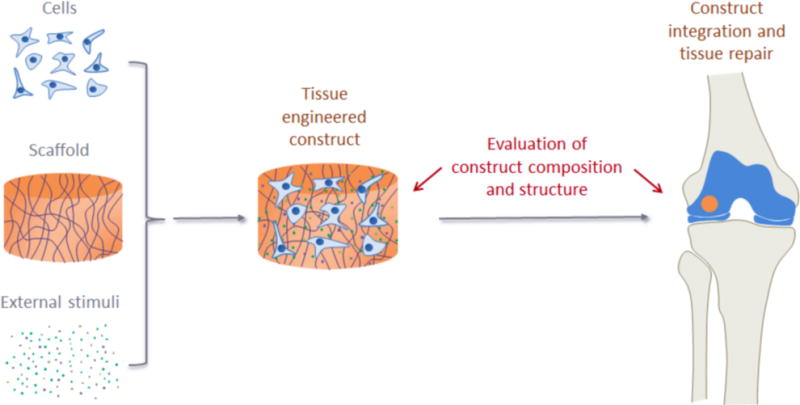
Tissue engineering (TE) approaches strive to regenerate or replace an organ or tissue. The successful development and subsequent integration of a TE construct is contingent on a series of in vitro and in vivo events that result in an optimal construct for implantation. Current widely used methods for evaluation of constructs are incapable of providing an accurate compositional assessment without destruction of the construct. In this review, we discuss the contributions of vibrational spectroscopic assessment for evaluation of tissue engineered construct composition, both during development and post-implantation. Fourier transform infrared (FTIR) spectroscopy in the mid and near-infrared range, as well as Raman spectroscopy, are intrinsically label free, can be non-destructive, and provide specific information on the chemical composition of tissues. Overall, we examine the contribution that vibrational spectroscopy via fiber optics and imaging have to tissue engineering approaches.


Figures

Figure 1
Figure 1
Schematic representation of typical tissue engineering procedures. Cells, scaffolds, and external stimuli (such as growth factors, cytokines, and mechanical forces) are combined to produce tissue engineered constructs. Important compositional and structural parameters of the constructs need to be carefully evaluated to increase the chance of successful tissue repair.
Figure 2
Figure 2
Application of mid-infrared (MIR) spectral imaging for evaluation of engineered cartilage and cartilage repair. The image from Kim et al. illustrates the use of MIR imaging to evaluate cartilage growth on poly(lactic-co-glycolic acid) (PLGA) scaffolds doped with synthetic thrombin peptide (TP-508) after implantation into osteochondral defects in rabbits. The authors show the use of MIR to assess collagen, proteoglycan (PG) and PLGA content, and collagen integrity and orientation, after 3 and 6 weeks in TP-508 and placebo groups. Note how MIR spectral imaging data permits a variety of information to be obtained from the same tissue section. Note also the strong correlation between the PG MIR images and the histological alcian blue stain for PG.
Figure 3
Figure 3
Application of NIR spectroscopy to assessment of composition of engineered cartilage. In the work from McGoverin et al., the authors show how NIR fiber optics can non-destructively monitor the development of engineered cartilage constructs of bovine chondrocytes seeded in polyglycolic acid (PGA) scaffolds. The authors followed the same scaffolds grown in culture for 42 days, and collected NIR spectra through the entire thickness of the scaffolds. (a) Raw NIR spectra. (b) Second derivative spectra. Peak heights at 5200, 4610 and 4310 cm−1 were used to quantify water, collagen and proteoglycan content, respectively. Spectra from native cartilage was used for comparison.
Figure 4
Figure 4
Application of NIR spectroscopy to assessment of mechanical properties of engineered cartilage. Hanifi et al. recently showed that NIR spectral data can non-destructively assess mechanical properties of cartilage constructs of bovine chondrocytes grown in polyglycolic acid (PGA) scaffolds. The authors found a significant positive correlation between the water, collagen and proteoglycan content quantified based on the NIR spectra and the dynamic stiffness of the constructs measured by standard mechanical testing. They also showed a negative correlation with the NIR peak of the PGA scaffold and dynamic stiffness.
Figure 5
Figure 5
Application of MIR spectroscopy to bone tissue engineering. The image from Marelli et al. shows the use of MIR spectroscopy to analyze the bone matrix produced by murine mesenchymal stem cells grown in dense collagen (DC) and injectable dense collagen (I-DC) hydrogels. The authors used MIR in attenuated total reflection (ATR) mode to evaluate the intensity of the ν3PO4 band (relative to amide I) as an indication of bone mineral formation. The spectra show the absence of mineral peaks in DC scaffolds and a progressive mineralization in I-DC scaffolds after 14 and 21 days of cell culture.
Figure 6
Figure 6
Application of MIR spectral imaging to bone tissue engineering. Sroka-Bartnicka et al. demonstrated the usefulness of MIR spectral imaging to quantify and image several features of bone tissue formed around engineered constructs. The authors analyzed the tissue formed around carbon hydroxyapatite/β-glucan scaffolds after implantation into rabbit bone defects for different lengths of time. The spatial distribution of proteins, lipids, phosphate, and collagen cross-linking maturity was assessed. In the visible image, C is the construct and DB is the surrounding demineralized bone.
Figure 7
Figure 7
Raman spectroscopy in tissue engineering. The image from Bergholt et al. shows how Raman spectroscopy and imaging can be used to analyze engineered cartilage constructs of bovine chondrocytes cultured in hydrophilic polytetrafluoroethylene (PTFE) membranes. (A) Raman spectroscopy was used to image the distribution of collagen, glycosaminoglycans (GAG) and water in the constructs, using multivariate curve resolution (MCR) analysis to extract pure Raman spectra for water, GAG and collagen, based primarily on the peaks at 3400, 1410, and 1245 cm−1, respectively. (B) The constructs were also analyzed by standard histological staining of hematoxylin and eosin (H&E), alcian blue for sulfated GAG, and picrosirius red for collagen, for comparison. (C) The depth profiles of relative content of collagen, GAG and water can also be determined based on the Raman imaging of the engineered constructs.

References

    1. Langer R, Vacanti JP. Science. 1993;260:920–926. - PubMed
    1. U.-U. N. f. O. Sharing. UNOS annual report. https://www.unos.org/about/annual-report/, (accessed June 14 2017, 2017)
    1. Song LJ, Murphy SV, Yang B, Xu YM, Zhang YY, Atala A. Tissue Engineering Part B-Reviews. 2014;20:163–172. - PubMed
    1. Kawecki M, Łabuś W, Klama-Baryla A, Kitala D, Kraut M, Glik J, Misiuga M, Nowak M, Bielecki T, Kasperczyk A. J Biomed Mater Res B Appl Biomater. 2017 - PubMed
    1. Consolo F, Brizzola S, Tremolada G, Grieco V, Riva F, Acocella F, Fiore GB, Soncini M. Journal of Tissue Engineering and Regenerative Medicine. 2016;10:E101–E112. - PubMed

LinkOut - more resources