

Application of single step genomic BLUP under different uncertain paternity scenarios using simulated data
- PMID: 28957330
- PMCID: PMC5619718
- DOI: 10.1371/journal.pone.0181752
Application of single step genomic BLUP under different uncertain paternity scenarios using simulated data
Abstract
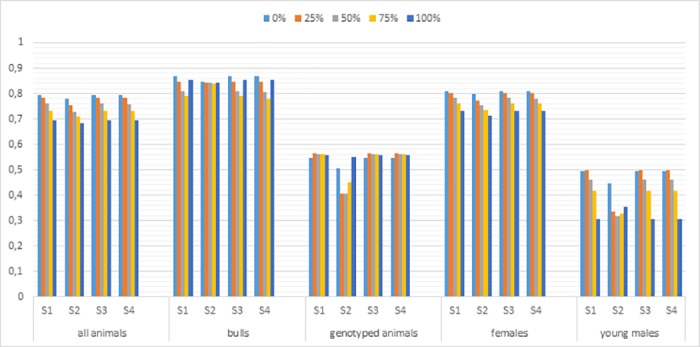
The objective of this study was to investigate the application of BLUP and single step genomic BLUP (ssGBLUP) models in different scenarios of paternity uncertainty with different strategies of scaling the G matrix to match the A22 matrix, using simulated data for beef cattle. Genotypes, pedigree, and phenotypes for age at first calving (AFC) and weight at 550 days (W550) were simulated using heritabilities based on real data (0.12 for AFC and 0.34 for W550). Paternity uncertainty scenarios using 0, 25, 50, 75, and 100% of multiple sires (MS) were studied. The simulated genome had a total length of 2,333 cM, containing 735,293 biallelic markers and 7,000 QTLs randomly distributed over the 29 BTA. It was assumed that QTLs explained 100% of the genetic variance. For QTL, the amount of alleles per loci randomly ranged from two to four. The BLUP model that considers phenotypic and pedigree data, and the ssGBLUP model that combines phenotypic, pedigree and genomic information were used for genetic evaluations. Four ways of scaling the mean of the genomic matrix (G) to match to the mean of the pedigree relationship matrix among genotyped animals (A22) were tested. Accuracy, bias, and inflation were investigated for five groups of animals: ALL = all animals; BULL = only bulls; GEN = genotyped animals; FEM = females; and YOUNG = young males. With the BLUP model, the accuracies of genetic evaluations decreased for both traits as the proportion of unknown sires in the population increased. The EBV accuracy reduction was higher for GEN and YOUNG groups. By analyzing the scenarios for YOUNG (from 0 to 100% of MS), the decrease was 87.8 and 86% for AFC and W550, respectively. When applying the ssGBLUP model, the accuracies of genetic evaluation also decreased as the MS in the pedigree for both traits increased. However, the accuracy reduction was less than those observed for BLUP model. Using the same comparison (scenario 0 to 100% of MS), the accuracies reductions were 38 and 44.6% for AFC and W550, respectively. There were no differences between the strategies for scaling the G matrix for ALL, BULL, and FEM groups under the different scenarios with missing pedigree. These results pointed out that the uninformative part of the A22 matrix and genotyped animals with paternity uncertainty did not influence the scaling of G matrix. On the basis of the results, it is important to have a G matrix in the same scale of the A22 matrix, especially for the evaluation of young animals in situations with missing pedigree information. In these situations, the ssGBLUP model is an appropriate alternative to obtain a more reliable and less biased estimate of breeding values, especially for young animals with few or no phenotypic records. For accurate and unbiased genomic predictions with ssGBLUP, it is necessary to assure that the G matrix is compatible with the A22 matrix, even in situations with paternity uncertainty.
Conflict of interest statement
Figures

References
-
- Tsuruta S, Misztal I, Lourenço DAL, Lawlor TJ. Assigning unknown parent groups to reduce bias in genomic evaluations of final score in US Holsteins. J Dairy Sci. 2014; 97: 5814–5821. doi: 10.3168/jds.2013-7821 - DOI - PubMed
-
- Henderson CR. General flexibility of linear model techniques for sire evaluation. J Dairy Sci. 1974; 57: 963–972.
-
- Kennedy BW. Bias and mean square error from ignoring genetic groups in mixed model sire evaluation. J Dairy Sci. 1981; 64: 689–697.
-
- Westell R, Quaas R, Van Vleck LD. Genetic groups in an animal model. J Dairy Sci. 1988; 71: 1310–1318.
-
- Cardoso FF, Tempelman RJ. Bayesian inference on genetic merit under uncertain paternity. Genet Sel Evol. 2003; 35: 469–487. doi: 10.1186/1297-9686-35-6-469 - DOI - PMC - PubMed
MeSH terms
LinkOut - more resources
Full Text Sources
Other Literature Sources
