

Impact of Recombination on the Base Composition of Bacteria and Archaea
- PMID: 28957503
- PMCID: PMC5850839
- DOI: 10.1093/molbev/msx189
Impact of Recombination on the Base Composition of Bacteria and Archaea
Abstract
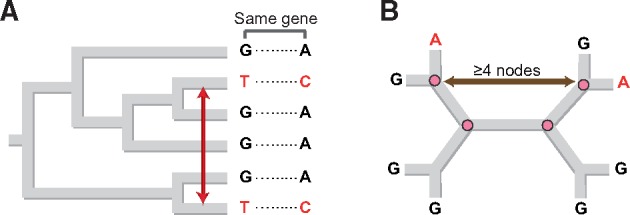
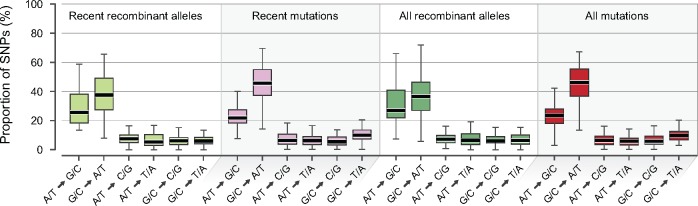
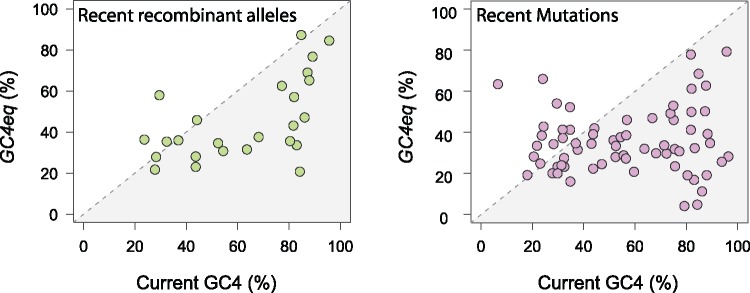
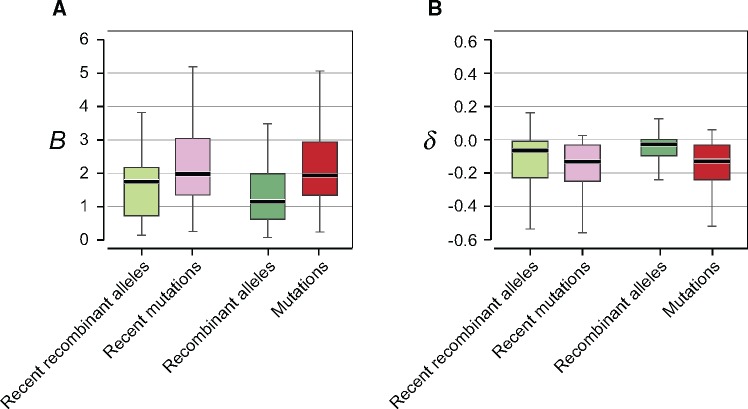
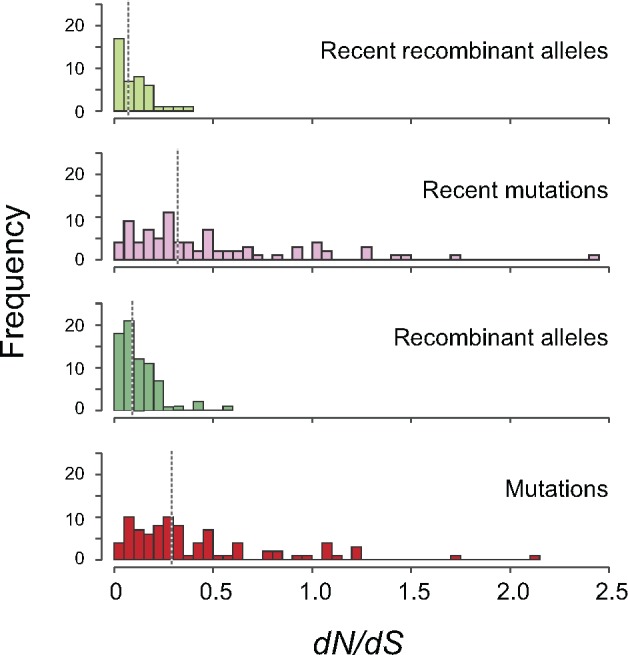
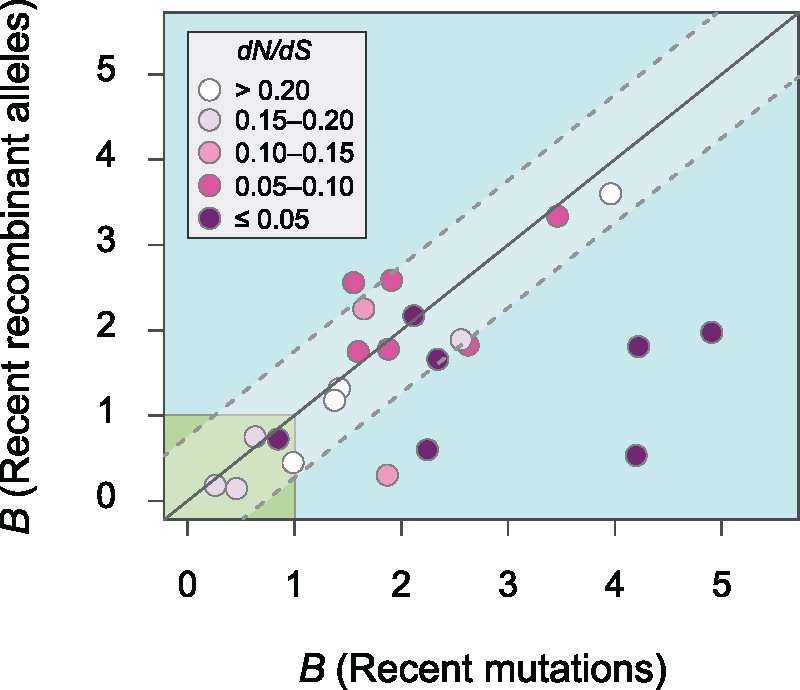
The mutational process in bacteria is biased toward A and T, and most species are GC-rich relative to the mutational input to their genome. It has been proposed that the shift in base composition is an adaptive process-that natural selection operates to increase GC-contents-and there is experimental evidence that bacterial strains with GC-rich versions of genes have higher growth rates than those strains with AT-rich versions expressing identical proteins. Alternatively, a nonadaptive process, GC-biased gene conversion (gBGC), could also increase the GC-content of DNA due to the mechanistic bias of gene conversion events during recombination. To determine what role recombination plays in the base composition of bacterial genomes, we compared the spectrum of nucleotide polymorphisms introduced by recombination in all microbial species represented by large numbers of sequenced strains. We found that recombinant alleles are consistently biased toward A and T, and that the magnitude of AT-bias introduced by recombination is similar to that of mutations. These results indicate that recombination alone, without the intervention of selection, is unlikely to counteract the AT-enrichment of bacterial genomes.
Keywords: G+C contents; bacterial genomes; biased gene conversion; recombination; sequence evolution.
© The Author 2017. Published by Oxford University Press on behalf of the Society for Molecular Biology and Evolution.All rights reserved. For permissions, please e-mail: journals.permissions@oup.com.
Figures
Similar articles
-
GC-biased gene conversion and selection affect GC content in the Oryza genus (rice).Mol Biol Evol. 2011 Sep;28(9):2695-706. doi: 10.1093/molbev/msr104. Epub 2011 Apr 18. Mol Biol Evol. 2011. PMID: 21504892
-
GC-biased gene conversion links the recombination landscape and demography to genomic base composition: GC-biased gene conversion drives genomic base composition across a wide range of species.Bioessays. 2015 Dec;37(12):1317-26. doi: 10.1002/bies.201500058. Epub 2015 Oct 7. Bioessays. 2015. PMID: 26445215 Review.
-
GC-Content evolution in bacterial genomes: the biased gene conversion hypothesis expands.PLoS Genet. 2015 Feb 6;11(2):e1004941. doi: 10.1371/journal.pgen.1004941. eCollection 2015 Feb. PLoS Genet. 2015. PMID: 25659072 Free PMC article.
-
Recombination Rate Variation Modulates Gene Sequence Evolution Mainly via GC-Biased Gene Conversion, Not Hill-Robertson Interference, in an Avian System.Mol Biol Evol. 2016 Jan;33(1):216-27. doi: 10.1093/molbev/msv214. Epub 2015 Oct 6. Mol Biol Evol. 2016. PMID: 26446902 Free PMC article.
-
Biased gene conversion and the evolution of mammalian genomic landscapes.Annu Rev Genomics Hum Genet. 2009;10:285-311. doi: 10.1146/annurev-genom-082908-150001. Annu Rev Genomics Hum Genet. 2009. PMID: 19630562 Review.
Cited by
-
Dynamics of Insect-Microbiome Interaction Influence Host and Microbial Symbiont.Front Microbiol. 2020 Jun 26;11:1357. doi: 10.3389/fmicb.2020.01357. eCollection 2020. Front Microbiol. 2020. PMID: 32676060 Free PMC article. Review.
-
Characterization and description of Gabonibacter chumensis sp. nov., isolated from feces of a patient with non-small cell lung cancer treated with immunotherapy.Arch Microbiol. 2023 Sep 24;205(10):338. doi: 10.1007/s00203-023-03671-0. Arch Microbiol. 2023. PMID: 37742282 Free PMC article.
-
Impacts of local population history and ecology on the evolution of a globally dispersed pathogen.BMC Genomics. 2020 May 20;21(1):369. doi: 10.1186/s12864-020-06778-6. BMC Genomics. 2020. PMID: 32434538 Free PMC article.
-
Unifying the global phylogeny and environmental distribution of ammonia-oxidising archaea based on amoA genes.Nat Commun. 2018 Apr 17;9(1):1517. doi: 10.1038/s41467-018-03861-1. Nat Commun. 2018. PMID: 29666365 Free PMC article.
-
Systems-Based Approach for Optimization of Assembly-Free Bacterial MLST Mapping.Life (Basel). 2022 Apr 30;12(5):670. doi: 10.3390/life12050670. Life (Basel). 2022. PMID: 35629339 Free PMC article.
References
Publication types
MeSH terms
Grants and funding
LinkOut - more resources
Full Text Sources
Other Literature Sources
Molecular Biology Databases
Miscellaneous
