. 2017 Sep 27;96(1):160-176.e8.
doi: 10.1016/j.neuron.2017.09.009.

Heterophilic Type II Cadherins Are Required for High-Magnitude Synaptic Potentiation in the Hippocampus

Affiliations

Heterophilic Type II Cadherins Are Required for High-Magnitude Synaptic Potentiation in the Hippocampus

Raunak Basu et al. Neuron. .

Erratum in

Abstract

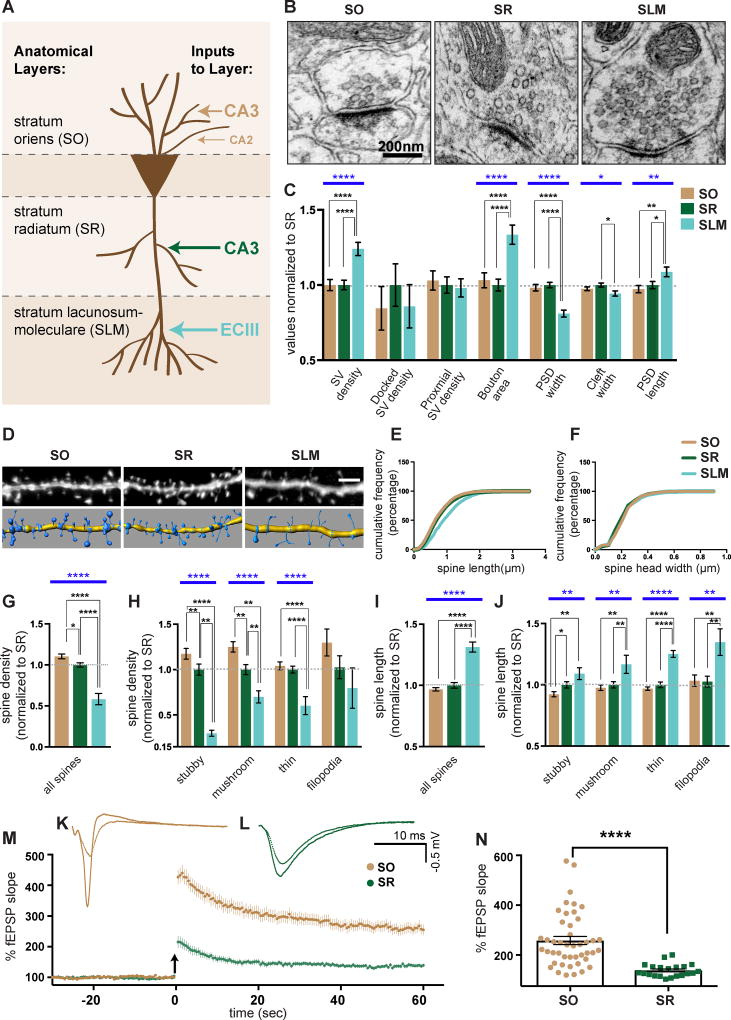
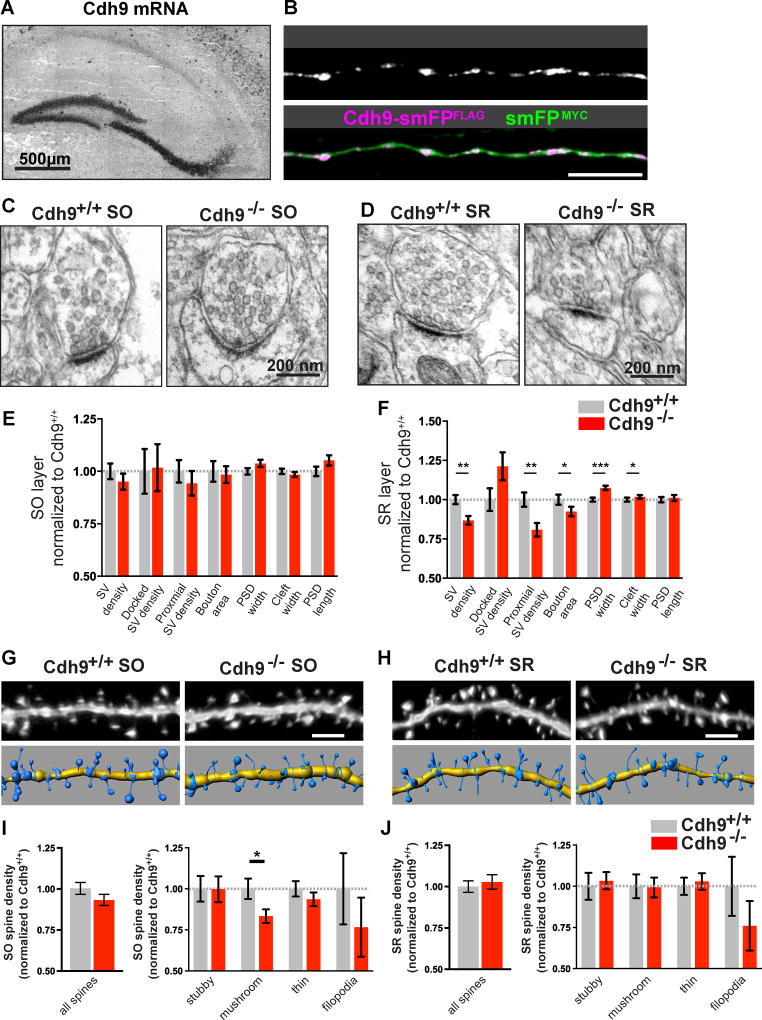
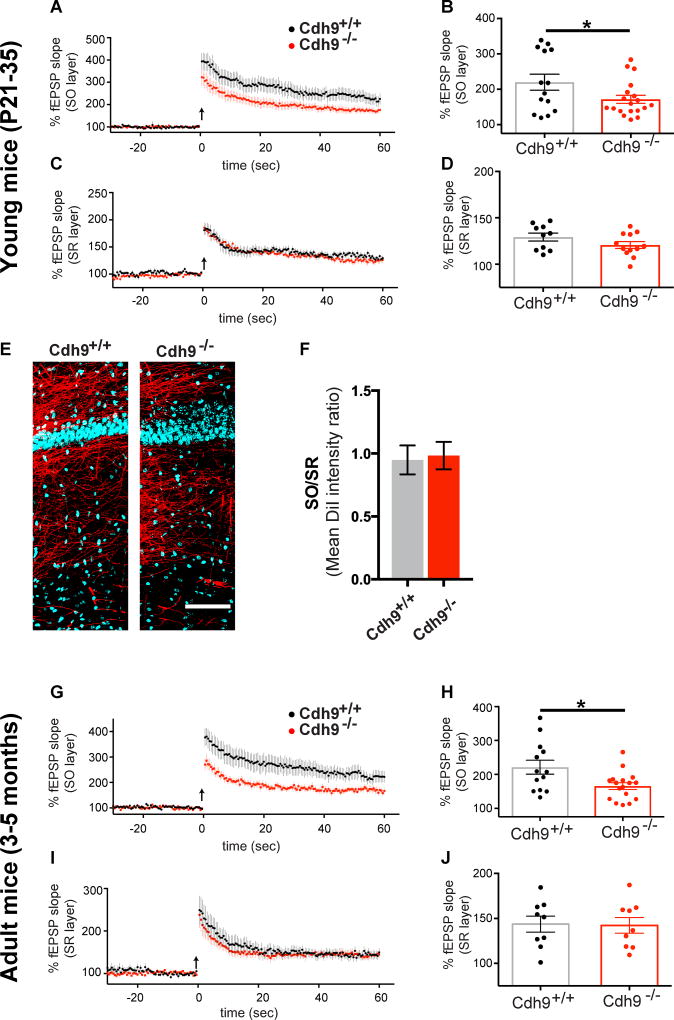
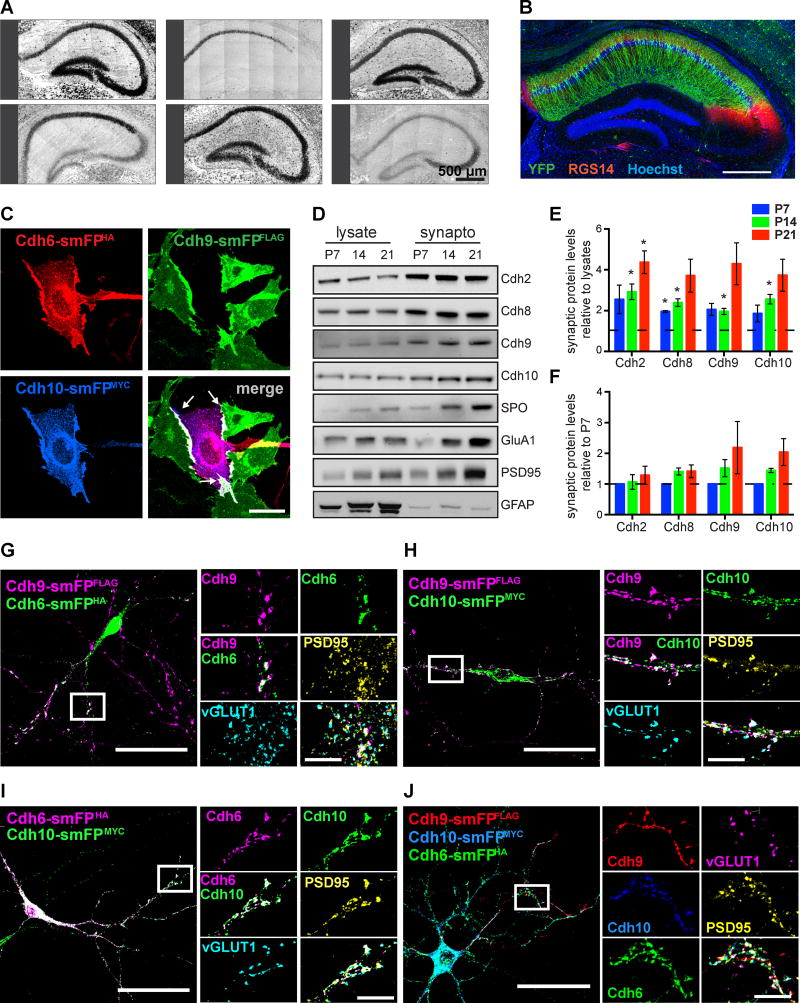
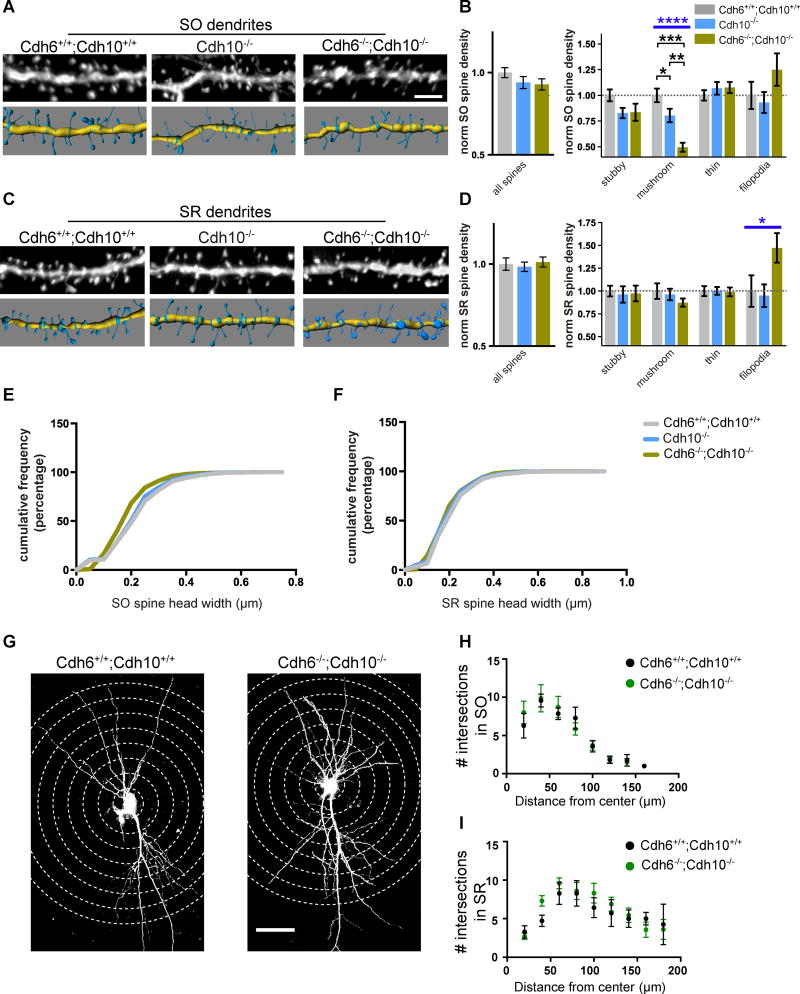
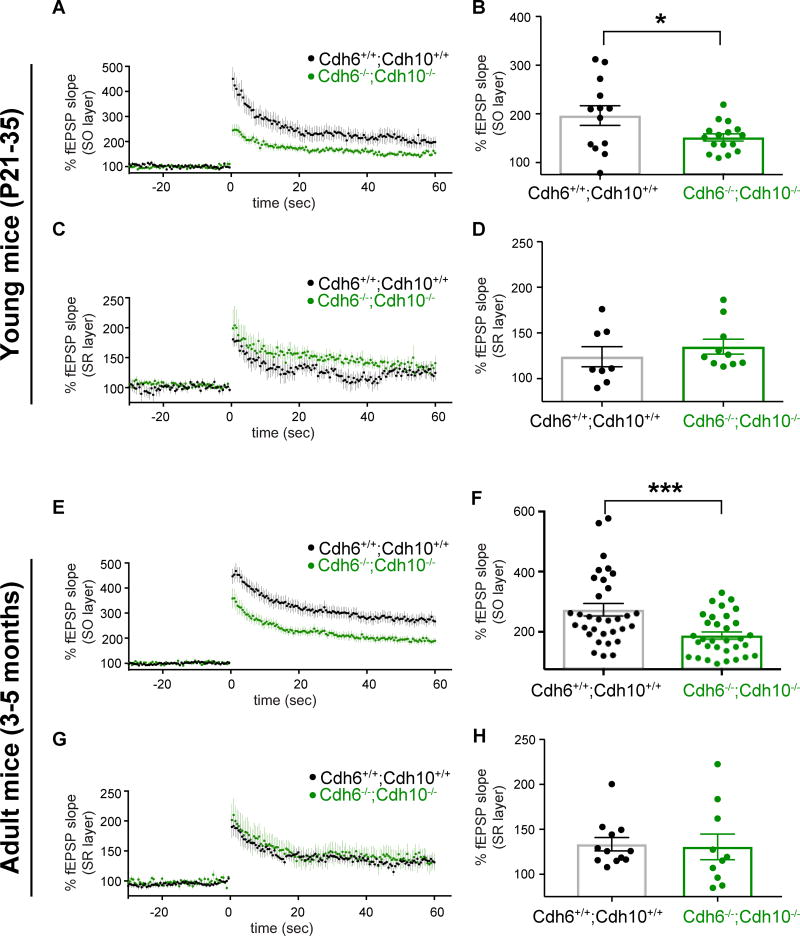
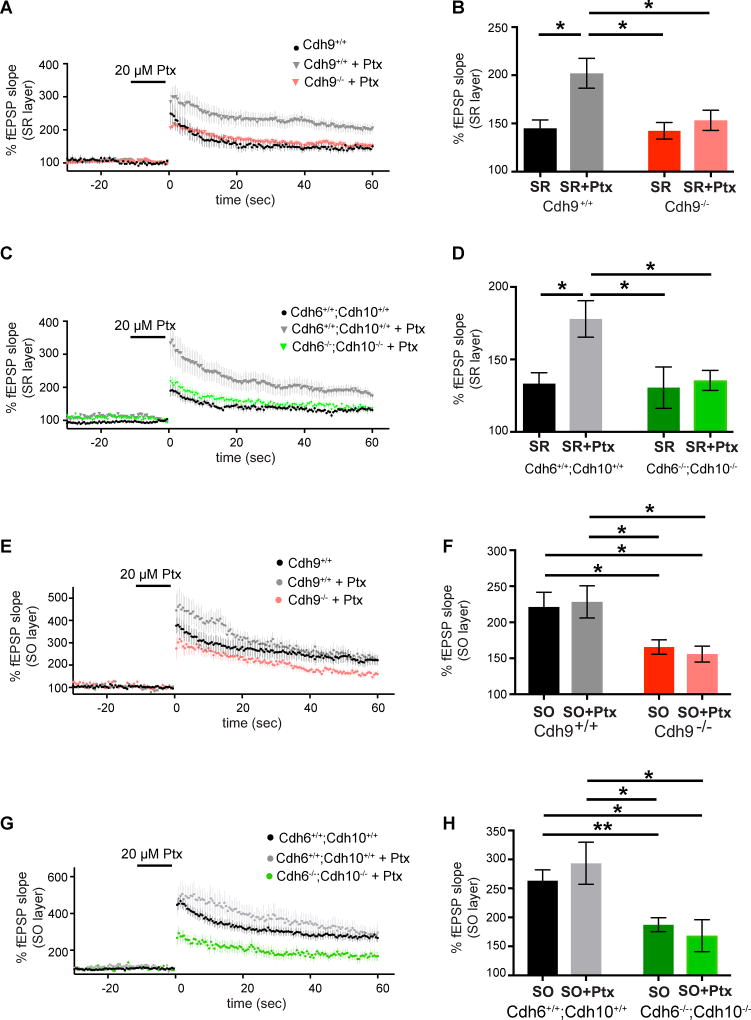
Hippocampal CA3 neurons form synapses with CA1 neurons in two layers, stratum oriens (SO) and stratum radiatum (SR). Each layer develops unique synaptic properties but molecular mechanisms that mediate these differences are unknown. Here, we show that SO synapses normally have significantly more mushroom spines and higher-magnitude long-term potentiation (LTP) than SR synapses. Further, we discovered that these differences require the Type II classic cadherins, cadherins-6, -9, and -10. Though cadherins typically function via trans-cellular homophilic interactions, our results suggest presynaptic cadherin-9 binds postsynaptic cadherins-6 and -10 to regulate mushroom spine density and high-magnitude LTP in the SO layer. Loss of these cadherins has no effect on the lower-magnitude LTP typically observed in the SR layer, demonstrating that cadherins-6, -9, and -10 are gatekeepers for high-magnitude LTP. Thus, Type II cadherins may uniquely contribute to the specificity and strength of synaptic changes associated with learning and memory.

Keywords: Cadherin; cadherin-10; cadherin-6; cadherin-9; hippocampus; long-term plasticity; mushroom spine; stratum oriens; synapse specificity.


Figures

Figure 1
Figure 1. CA1 excitatory synapses have layer-specific properties
(A) Schematic of excitatory inputs to CA1 neurons. (B) Representative EM images of CA1 synapses. (C) Quantification of EM parameters. All values are normalized to mean SR values. n = 181 (SR), 149 (SO), and 134 (SLM) synapses evenly sampled from 3 mice aged P23. (D) Representative confocal images of Lucifer Yellow filled CA1 dendrites (top) and corresponding 3D models (bottom). (E and F) Cumulative distribution of spine length (E) and spine head width (F) from SO, SR, and SLM spines. Sample sizes: 6028 spines (SO), 7731 spines (SR), 884 spines (SLM). (G–J) Quantification of average spine density (G-H) and spine length (I-J) of indicated spine classes. All values are normalized to mean SR values. n = 49 (SO), 39 (SR), and 11 (SLM) cells from 6, 6, and 3 mice respectively aged P21-P23. (K and L) Representative LTP traces from CA1 SO (K) and CA1 SR (L) layer. (M) Mean LTP time course induced in CA1 SO and SR. Arrow indicates TBS. (N) Mean LTP amplitudes defined as average percentage of fEPSP slope 58.5–60 minutes after TBS in SO and SR layers. n = 45 SO and 21 SR slices from 16 and 9 wildtype mice aged 3–5 months. Statistics for LTP quantification were calculated using the Mann-Whitney test. Statistical differences between SO, SR, and SLM for EM and spine analyses were calculated using one-way ANOVA followed by pairwise Holm-Šidák multiple comparison tests. Blue bars represent one-way ANOVA p-values. Black bars represent pairwise post-test p values. p<0.05, p<0.01, p<0.001, and p<0.0001 is denoted by *, **, ***, and **** respectively, otherwise p>0.05. All data shown as mean ± s.e.m. Data on wildtype mice reported here is a combination of data from Cdh9+/+ and Cdh6+/+;Cdh10+/+ mice introduced in figures 2 ,3, 5, and 6.
Figure 2
Figure 2. Cadherin-9 regulates mushroom spines in the CA1 SO layer
(A) In situ hybridization shows Cdh9 mRNA is expressed in DG and CA3 neurons. (B) Immunostaining of a P14 CA3 axon in utero electroporated with Cdh9-smFPFLAG (purple) and smFPMYC (green) at embryonic age 14.5 days. smFPMYC was used to fill the axon. Composite image shown in lower panel. (C–D) Representative EM images of synapses from the SO (C) and SR (D) of Cdh9+/+ and Cdh9−/− mice. (E–F) Quantification of synapses from the SO (E) and SR (F) layers imaged by EM. n = 190 Cdh9+/+ and 170 Cdh9−/− synapses in SO and 314 Cdh9+/+ and 316 Cdh9−/− synapses in SR. All analyses were evenly sampled from 3 mice aged P21 and done blind to genotype. pvalues were calculated using Mann-Whitney test. (G,H) Representative images of SO (G) and SR (H) dendrites analyzed in Cdh9+/+ and Cdh9−/− mice (top) and corresponding 3D models (bottom). (I,J) Quantification of average spine density of total spines (left) and indicated spine classes (right) from the SO (I) and SR (J) layers. All data is normalized to Cdh9+/+. Absolute values are shown in Figure S2. n = 28 Cdh9+/+ and 25 Cdh9−/− cells for SO and 23 Cdh9+/+ and 18 Cdh9−/− cells from SR. All analyses were evenly sampled from 3 mice aged P21-P23 and done blind to genotype. p-values were calculated using students t-test and p<0.05, p<0.01, and p<0.001 is denoted by *, **, and *** respectively, otherwise p>0.05. All data shown as mean ± s.e.m.
Figure 3
Figure 3. Cadherin-9 regulates high magnitude LTP in CA1 SO
(A–D) Mean LTP time course (A,C) and amplitudes (B,D) recorded in CA1 SO and SR of Cdh9+/+ and Cdh9−/− hippocampal slices. n = 14 Cdh9+/+ and 19 Cdh9−/− slices from SO and 10 Cdh9+/+ and 12 Cdh9−/− slices from SR, each from 6–7 animals aged P21–35. (E) Representative composite images of DiI labeled CA3 axons (red) projecting to area CA1 and Hoechst (blue). (F) Quantification of mean DiI staining intensity in SO relative to SR layer of Cdh9+/+ and Cdh9−/− hippocampal slices. n = 9–10 slices from 4–5 animals each. All animals aged P21–P35. Student’s t-test indicates no significant differences. (G–J) Same as A–D except experiments were done on adult Cdh9+/+ and Cdh9−/−mice. n = 13 Cdh9+/+ and 17 Cdh9−/− slices for SO and 9 Cdh9+/+ and 9 Cdh9−/− slices for SR, each from 4–5 animals aged 3–5 months. p-values were calculated using students t-test. p<0.05 is represented by *, otherwise p>0.05. All data shown as mean ± s.e.m.
Figure 4
Figure 4. Cadherin-9 mediates trans-cellular adhesion via cadherins-6 and 10
(A) In situ hybridizations of hippocampal cadherins. All images are tiled. (B) Immunostaining against YFP (green) and the CA2 marker RGS14 (red) in hippocampus from Cdh10-CreERT2+/−;Ai3+/− mice injected with tamoxifen. Hoechst (blue) labels all cell nuclei. (C) CHO cells expressing Cdh9-smFPFLAG (green) were mixed with cells co-expressing Cdh6-smFPHA (red) and Cdh10-smFPMYC (blue). Note that cadherins-6, 9, and 10 co-cluster at the interaction interfaces (white arrows in the merged image). (D) Immunoblots show cadherins-9 and 10 are enriched in hippocampal synaptosomes from P7, P14, and P21 mice. Samples were also probed for cadherins-2 and 8, the presynaptic marker synaptoporin (SPO), the postsynaptic markers PSD95 and GluA1, and a nonsynaptic marker GFAP. (E) Quantification of synaptic enrichment of each indicated cadherin relative to their levels in lysate at each time point. For each time point, a one sample t-test was used to determine if the mean enrichment value is significantly different than 1 (depicted as the dotted line), which would denote no enrichment. (F) Quantification of cadherin levels in synaptosomes over time. Each protein is normalized to its level in synaptosomes at P7. Statistical difference between means were calculated using one-way ANOVA (performed on each cadherin separately) followed by pairwise Holm-Šidák multiple comparison tests. For Figures E and F, 3 independent experiments were done for each age with hippocampi from 3–4 animals pooled per experiment. (G–J) Cultured neurons expressing Cdh9-smFPFLAG were plated with neurons expressing either Cdh6-smFPHA, Cdh10-smFPMYC, or both Cdh6-smFPHA and Cdh10-smFPMYC. Neurons were immunostained for epitope tags to label cadherins and vGLUT1 and PSD95 to label pre- and postsynaptic sites. Boxed regions are shown magnified at right and arrowheads indicate points of co-localization at synapses. All data shown as mean ± s.e.m. All fluorescent images are composite and each channel is indicated.
Figure 5
Figure 5. Cadherins-6 and 10 regulate mushroom spine formation in CA1 SO
(A,C) Representative images of SO (A) and SR (C) dendrites analyzed in wildtype (Cdh6+/+;Cdh10+/+), cadherin-10 knockout (Cdh10−/−), and cadherin-6/10 double knockout (Cdh6−/−;Cdh10−/−) mice (top), and their 3D models (bottom). (B,D) Quantification of average density of total spines (left) and indicated spine classes (right). All measurements are normalized to mean wildtype values. n = 16–21 cells from 3 mice aged P21–P23 for each layer and genotype. Statistical differences calculated using one-way ANOVA followed by pairwise Holm-Šidák multiple comparison tests. (E–F) Cumulative distribution of spine head width from SO (E) and SR (F) layers from Cdh6+/+;Cdh10+/+, Cdh10−/−, and Cdh6−/−;Cdh10−/− mice. n= >1000 spines for each. All spine analyses were evenly sampled from 3 mice aged P21–P23 and conducted blind to genotype. (G) Representative images of Lucifer yellow filled CA1 neurons from Cdh6+/+;Cdh10+/+ and Cdh6−/− ;Cdh10−/− mice for Sholl analysis. Concentric circles used to quantify dendritic branching are indicated by dotted lines. (H, I) Quantification of intersection points of SO (H) and SR (I) dendrites from Cdh6+/+;Cdh10+/+ and Cdh6−/−;Cdh10−/− mice. n= 7–10 neurons from 3 animals for each layer and genotype. p-values were calculated using Holm-Šidák multiple comparison test and no significant differences were found. Blue bars represent ANOVA p-values. Black bars represent post-test p values. p<0.05, p<0.01, p<0.001, and p<0.0001 is denoted by *, **, ***, and **** respectively, otherwise p>0.05. All data shown as mean ± s.e.m.
Figure 6
Figure 6. Cadherins-6 and 10 are required for high magnitude LTP in CA1 SO
(A–B) Mean LTP time course (A) and amplitudes (B) recorded in CA1 SO layer of Cdh6+/+;Cdh10+/+ and Cdh6−/−;Cdh10−/− hippocampal slices. (C–D) Same as figures 6A–B except data from SR layer is shown. n= 13 Cdh6+/+;Cdh10+/+ and 16 Cdh6−/−;Cdh10−/− slices for SO and 8 Cdh6+/+;Cdh10+/+ and 10 Cdh6−/−;Cdh10−/− slices for SR. Data collected from 4 mice aged P21–35. (E–H) Same as in figures 4A–D except recordings were performed in adult mice. n= 32 Cdh6+/+;Cdh10+/+ and 32 Cdh6−/−;Cdh10−/− slices for SO and 12 Cdh6+/+;Cdh10+/+ and 10 Cdh6−/−;Cdh10−/− slices for SR, each from 5–11 animals aged 3–5 months. p-values were calculated using students t-test. *=p<0.05 and ***=p<0.001, otherwise p>0.05. All data shown as mean ± s.e.m.
Figure 7
Figure 7. Cadherins-6, 9, and 10 are required for picrotoxin-induced high magnitude LTP in SR
(A–B) Time course (A) and mean LTP magnitude comparison (B) of SR LTP recorded from Cdh9 wildtype and knockout mice with and without 20 µM picrotoxin (Ptx). n=9–16 slices, each from 3–5 animals aged 3–5 months. (C–D) Time course (C) and mean LTP magnitude comparison (D) of SR LTP recorded from Cdh6/Cdh10 wildtype and double knockout mice with and without 20 µM picrotoxin (Ptx). n= 10–15 slices, each from 3–6 animals aged 3–5 months. (E–F) Time course (E) and mean LTP magnitude comparison (F) of SO LTP recorded from Cdh9 wildtype and knockout mice with and without 20 µM picrotoxin (Ptx). n=8–17 slices, each from 3–5 animals aged 3–5 months. (G–H) Time course (G) and mean LTP magnitude comparison (H) of SO LTP recorded from Cdh6/Cdh10 wildtype and double knockout mice with and without 20 µM picrotoxin (Ptx). n=8–32 slices, each from 3–11 animals aged 3–5 months. Statistical differences were measured using two-way ANOVA followed by pairwise p-value calculation using Holm-Šidák multiple comparison test. Two-way ANOVA p-values are reported in supplementary table 2. p<0.05, p<0.01, p<0.001, and p<0.0001 is denoted by *, **, ***, and **** respectively, otherwise p>0.05. All data shown as mean ± s.e.m. Note: untreated wildtype and knockout data without Ptx is the same data reported in previous figures and shown here again for comparison with Ptx treatment.

References

    1. Aiga M, Levinson JN, Bamji SX. N-cadherin and Neuroligins Cooperate to Regulate Synapse Formation in Hippocampal Cultures. J. Biol. Chem. 2010;286:851–858. - PMC - PubMed
    1. Arai A, Black J, Lynch G. Origins of the variations in long-term potentiation between synapses in the basal versus apical dendrites of hippocampal neurons. Hippocampus. 1994;4:1–9. - PubMed
    1. Bekirov IH, Needleman LA, Zhang W, Benson DL. Identification and localization of multiple classic cadherins in developing rat limbic system. Neuroscience. 2002;115:213–227. - PubMed
    1. Bian W-J, Miao W-Y, He S-J, Qiu Z, Yu X. Coordinated Spine Pruning and Maturation Mediated by Inter-Spine Competition for Cadherin/Catenin Complexes. Cell. 2015:1–39. - PubMed
    1. Bosch M, Hayashi Y. Structural plasticity of dendritic spines. Curr. Opin. Neurobiol. 2012;22:383–388. - PMC - PubMed

MeSH terms