. 2018 Apr 17;73(5):561-570.
doi: 10.1093/gerona/glx047.

Stable Isotope Labeling Reveals Novel Insights Into Ubiquitin-Mediated Protein Aggregation With Age, Calorie Restriction, and Rapamycin Treatment

Affiliations

Stable Isotope Labeling Reveals Novel Insights Into Ubiquitin-Mediated Protein Aggregation With Age, Calorie Restriction, and Rapamycin Treatment

Nathan B Basisty et al. J Gerontol A Biol Sci Med Sci. .

Abstract

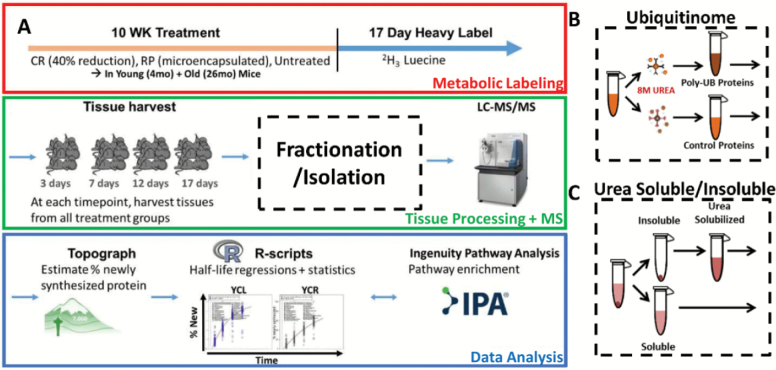
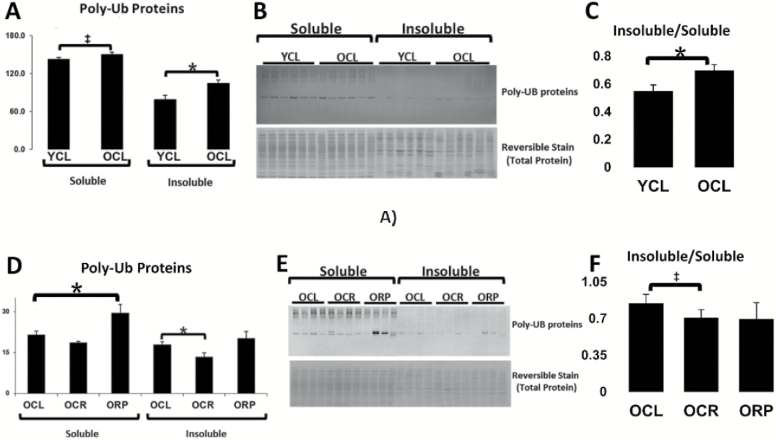
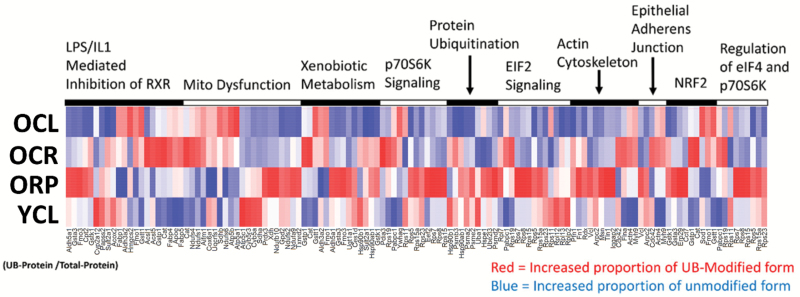
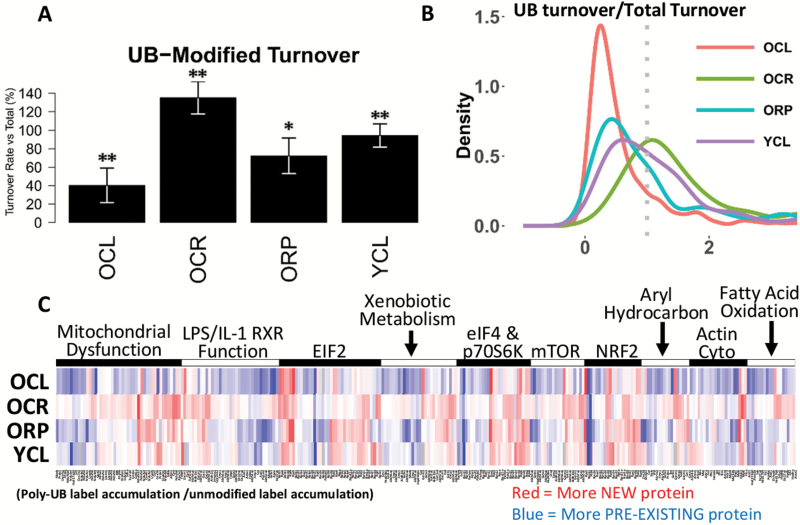
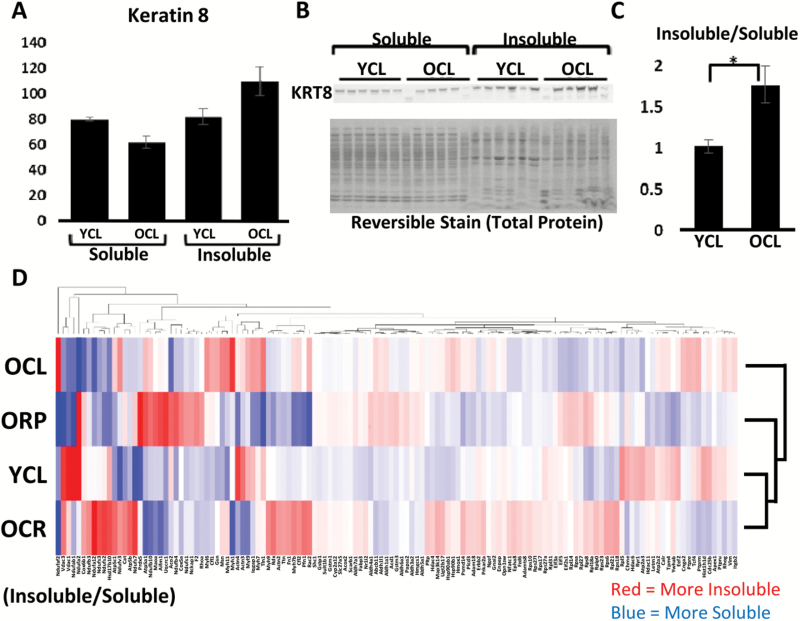
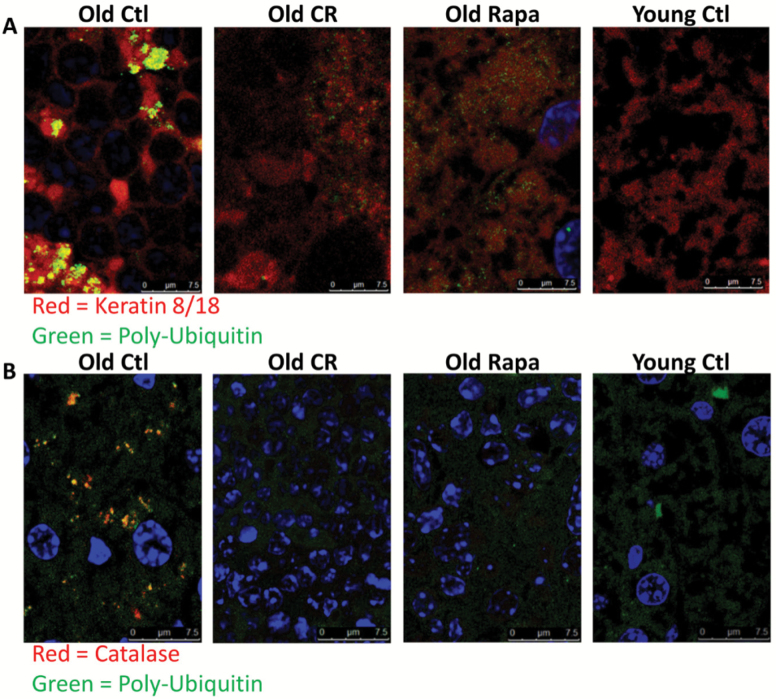
Accumulation of protein aggregates with age was first described in aged human tissue over 150 years ago and has since been described in virtually every human tissue. Ubiquitin modifications are a canonical marker of insoluble protein aggregates; however, the composition of most age-related inclusions remains relatively unknown. To examine the landscape of age-related protein aggregation in vivo, we performed an antibody-based pulldown of ubiquitinated proteins coupled with metabolic labeling and mass spectrometry on young and old mice on calorie restriction (CR), rapamycin (RP)-supplemented, and control diets. We show increased abundance of many ubiquitinated proteins in old mice and greater retention of preexisting (unlabeled) ubiquitinated proteins relative to their unmodified counterparts-fitting the expected profile of age-increased accumulation of long-lived aggregating proteins. Both CR and RP profoundly affected ubiquitinome composition, half-live, and the insolubility of proteins, consistent with their ability to mobilize these age-associated accumulations. Finally, confocal microscopy confirmed the aggregation of two of the top predicted aggregating proteins, keratins 8/18 and catalase, as well as their attenuation by CR and RP. Stable-isotope labeling is a powerful tool to gain novel insights into proteostasis mechanisms, including protein aggregation, and could be used to identify novel therapeutic targets in aging and protein aggregation diseases.


Figures

Figure 1.
Figure 1.
Experimental workflow. (A) Young and old mice are treated for 10 weeks with CR, RP, or ad libitum diet, then dietary leucine is replaced with deuterated “heavy” leucine for 17 days while mice remain on treatments. Tissues are harvested from each treatment group over four time points over the 17-day labeling period, followed by processing of livers into protein fractions and analysis by nLC-MS/MS. Topograph software is used to calculate precursor-pool corrected estimates of percentage of newly synthesized protein as well as perform peak area integration. Statistical analysis and visualizations are performed by in-house R-scripts. Pathway enrichments are performed using commercially available Ingenuity Pathway Analysis (IPA) software. (B) A portion of each liver was homogenized in a highly denaturing buffer for ubiquitinome enrichment. The resulting lysates were then split in half—the first half was used for enrichment of ubiquitin-modified proteins, and the remaining half underwent enrichment with an isotope control antibody. (C) An additional portion of each liver was used to prepare the soluble and insolublomes. The supernatant of a low-speed centrifugation was kept as the soluble portion. The remaining pellet was re-solubilized in urea and both portions were then processed for MS analysis. CR = calorie restriction; RP = rapamycin.
Figure 2.
Figure 2.
Increasingly insoluble UB proteins with age. (A) A significant increase in UB proteins in the insoluble fraction with age and a trending increase in the soluble fraction. (B) Representative Western blot and total protein stain. (C) The ratio of insoluble/soluble protein increases with age. (D) Increased soluble UB-modified proteins in old RP-treated mice compared with untreated controls and a decrease in insoluble UB proteins in mice on CR compared with controls. (E) Representative Western blot and total protein reversible stain. (F) The proportion of insoluble/soluble proteins significantly decreases with CR, and RP treatment appears to move the ratio in the same direction. Values are mean ± SEM. Two-tailed t tests: *p < .05, p < 0.1. CR = calorie restriction; RP = rapamycin; UB = ubiquitinated.
Figure 3.
Figure 3.
Heatmap of top pathways altered in ubiquitination. Heatmap depicting ubiquitin-modified proteins that were significantly altered with age, arranged by the top 10 most significantly enriched pathways and shown for OCL, OCR, ORP, and YCL. Each ubiquitin-modified protein was normalized to changes in its unmodified form in the total protein fraction. A high quality PDF of Figure 3 is available as a supplementary file.
Figure 4.
Figure 4.
Turnover of ubiquitin-modified proteins. (A) Bar plot showing, on average, the percentage of ubiquitin-modified proteins which are newly synthesized when compared with the corresponding unmodified proteins (100%) for OCL, OCR, ORP, and YCL. (B) A probability density plot showing the distribution of percentage of newly synthesized ubiquitinated proteins compared with the equivalent unmodified proteins. The dotted line represents an equivalent percentage of newly synthesized proteins in the ubiquitin-modified and unmodified forms. (C) Heatmap depicting the ratio of newly synthesized ubiquitin-modified proteins over equivalent unmodified proteins, arranged by the top 10 most significantly enriched pathways and shown for OCL, OCR, ORP, and YCL. Red indicates a greater proportion of newly synthesized, labeled protein in the modified form and blue indicated a greater proportion of preexisting protein. **p-value < .001 for all pairwise comparisons. *p-value < .05 versus YCL and p-value < .001 versus OCL and OCR. A high quality PDF of Figure 4C is available as a supplementary file.
Figure 5.
Figure 5.
Soluble and insoluble proteomes. (A) Quantification of keratin 8 in the soluble and insoluble fractions of young and old mice by Western blotting (normalized to total protein reversible stain). (B) Representative Western blot of krt8 and total protein stain. (C) Quantification of the insoluble to soluble intensity ratio of keratin 8 in young and old mice. (D) Heatmap depicting the relative proteomic abundance of proteins in the insoluble fractions versus the soluble fractions for each treatment group, with column and row clustering and dendrograms. Red indicates a greater proportion of insoluble protein and blue indicates a greater proportion of soluble protein. Values are mean ± SEM. Two-tailed t tests: *p < .05. A high quality PDF of Figure 5D is available as a supplementary file.
Figure 6.
Figure 6.
Increasingly insoluble UB proteins with age. (A) Representative images of confocal microscopy of a top candidate “aggregator” keratin 8, shown in red, and ubiquitin, shown in green, in mouse liver sections. Old control mice showed significant co-localization of red and green fluorescence (R = 0.63, p = 1, Costes automatic thresholding (45)), whereas old treated mice showed diminished co-localization (R = 0.41 and 0.44 for old CR and Rapa-treated mice, respectively). (B) Representative confocal images in mouse liver sections probed for catalase (red) and ubiquitin (green) and DNA (DAPI, blue). Old control mice showed significant co-localization of red and green fluorescence (R = 0.42, p = 1, Costes automatic thresholding), whereas other treatment groups did not (R = 0.12, 0.02, and 0.04 for young controls, old CR-treated mice, and old rapamycin-treated mice, respectively). Fluorescence bleed-through from DAPI into the red channel was removed from catalase images by removing red staining within nuclei in Photoshop. The Costes’ p-value from Costes’ randomized analysis was p = 1, or 100%, for all images. This indicates a high probability that the co-localization observed was not the co-localization of pixels due to chance (see Materials and Methods section). CR = calorie restriction; UB = ubiquitinated.

Comment in

  • Identifying ubiquitinated proteins and aggregates.
    Basisty N, Schilling B, Rabinovitch PS. Basisty N, et al. Aging (Albany NY). 2018 Oct 18;10(10):2549-2550. doi: 10.18632/aging.101605. Aging (Albany NY). 2018. PMID: 30335616 Free PMC article. No abstract available.

Similar articles

Cited by

References

    1. Koga H, Kaushik S, Cuervo AM. Protein homeostasis and aging: the importance of exquisite quality control. Ageing Res Rev. 2011;10:205–215. doi: 10.1016/j.arr.2010.02.001 - PMC - PubMed
    1. Douglas PM, Dillin A. Protein homeostasis and aging in neurodegeneration. J Cell Biol. 2010;190:719–729. doi:10.1083/jcb.201005144 - PMC - PubMed
    1. Christians ES, Benjamin IJ. Proteostasis and REDOX state in the heart. Am J Physiol Heart Circ Physiol. 2012;302:H24–H37. doi:10.1152/ajpheart.00903.2011 - PMC - PubMed
    1. Hedhli N, Pelat M, Depre C. Protein turnover in cardiac cell growth and survival. Cardiovasc Res. 2005;68:186–196. doi:10.1016/j.cardiores.2005.06.025 - PubMed
    1. Surguchev A, Surguchov A. Conformational diseases: looking into the eyes. Brain Res Bull. 2010;81:12–24. doi:10.1016/j.brainresbull.2009.09.015 - PubMed

Publication types