

The RAPIDD ebola forecasting challenge: Synthesis and lessons learnt
- PMID: 28958414
- PMCID: PMC5927600
- DOI: 10.1016/j.epidem.2017.08.002
The RAPIDD ebola forecasting challenge: Synthesis and lessons learnt
Abstract
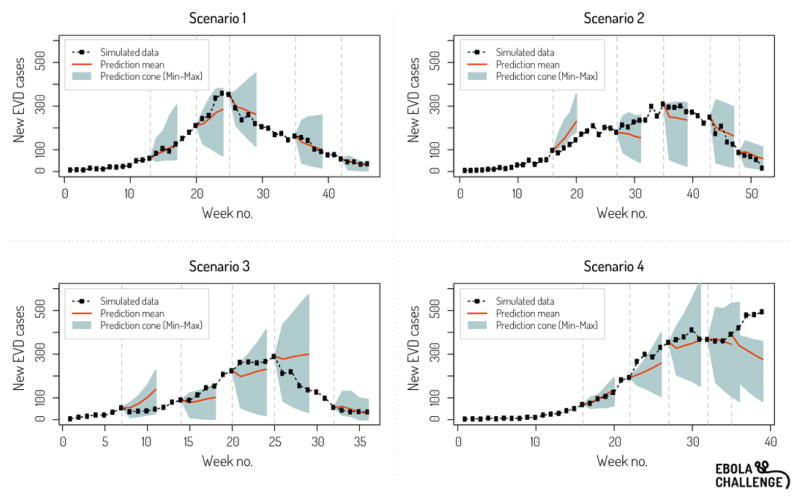
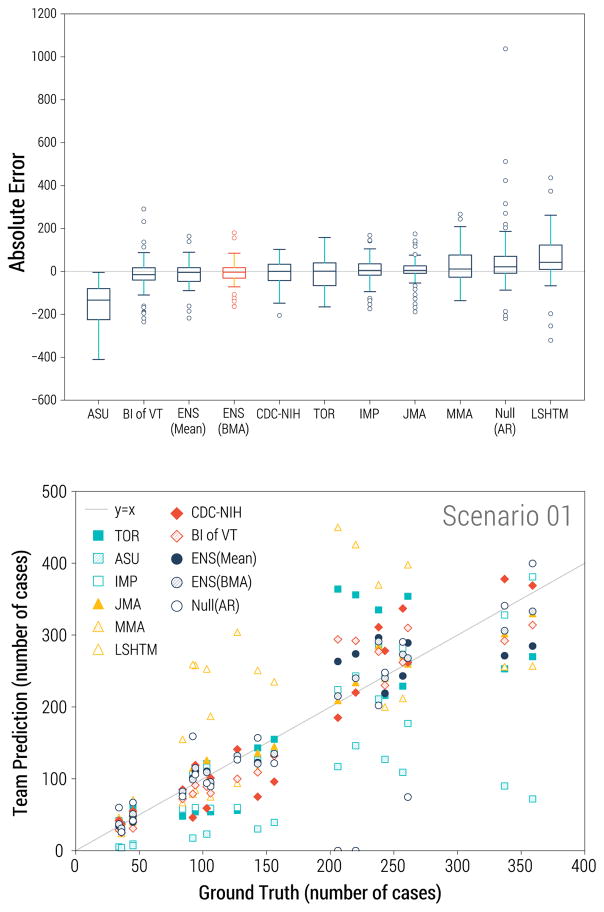
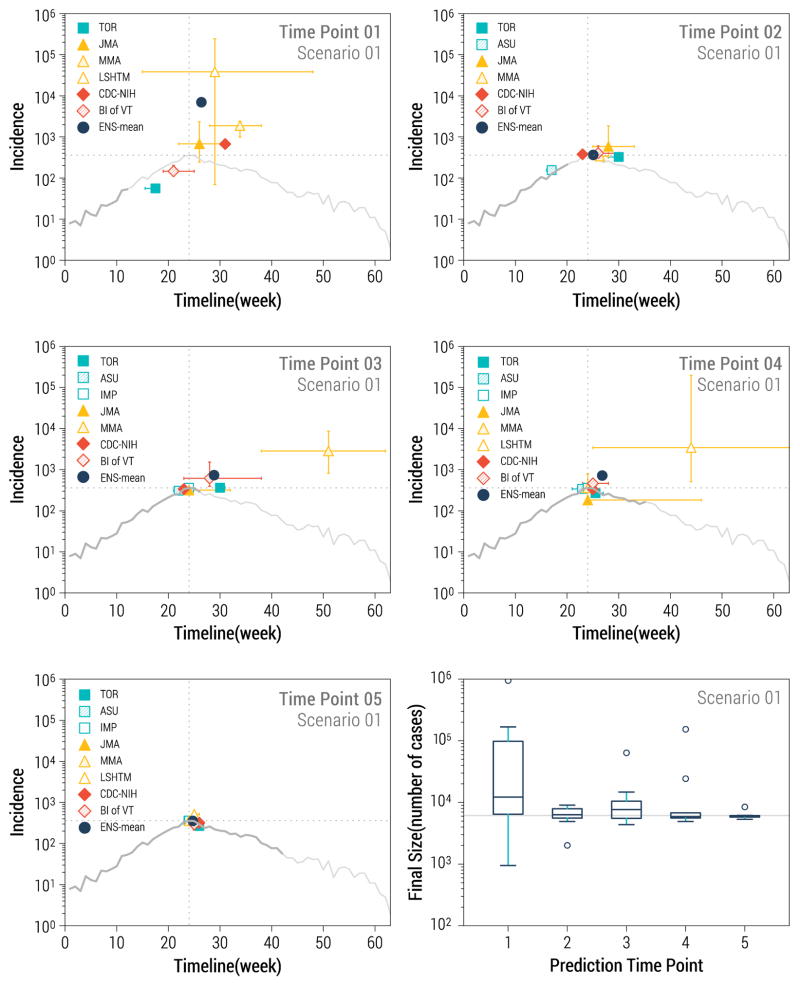
Infectious disease forecasting is gaining traction in the public health community; however, limited systematic comparisons of model performance exist. Here we present the results of a synthetic forecasting challenge inspired by the West African Ebola crisis in 2014-2015 and involving 16 international academic teams and US government agencies, and compare the predictive performance of 8 independent modeling approaches. Challenge participants were invited to predict 140 epidemiological targets across 5 different time points of 4 synthetic Ebola outbreaks, each involving different levels of interventions and "fog of war" in outbreak data made available for predictions. Prediction targets included 1-4 week-ahead case incidences, outbreak size, peak timing, and several natural history parameters. With respect to weekly case incidence targets, ensemble predictions based on a Bayesian average of the 8 participating models outperformed any individual model and did substantially better than a null auto-regressive model. There was no relationship between model complexity and prediction accuracy; however, the top performing models for short-term weekly incidence were reactive models with few parameters, fitted to a short and recent part of the outbreak. Individual model outputs and ensemble predictions improved with data accuracy and availability; by the second time point, just before the peak of the epidemic, estimates of final size were within 20% of the target. The 4th challenge scenario - mirroring an uncontrolled Ebola outbreak with substantial data reporting noise - was poorly predicted by all modeling teams. Overall, this synthetic forecasting challenge provided a deep understanding of model performance under controlled data and epidemiological conditions. We recommend such "peace time" forecasting challenges as key elements to improve coordination and inspire collaboration between modeling groups ahead of the next pandemic threat, and to assess model forecasting accuracy for a variety of known and hypothetical pathogens.
Keywords: Data accuracy; Ebola epidemic; Forecasting challenge; Mathematical modeling; Model comparison; Prediction horizon; Prediction performance; Synthetic data.
Published by Elsevier B.V.
Figures
References
-
- Alex Perkins T, Siraj AS, Ruktanonchai CW, Kraemer MU, Tatem AJ. Model-based projections of Zika virus infections in childbearing women in the Americas. Nat Microbiol. 2016;1(9):16126. - PubMed
-
- Asher J. Forecasting Ebola with a regression transmission model. Epidemics 2017 - PubMed
-
- Biggerstaff M, Alper D, Dredze M, Fox S, Fung IC, Hickmann KS, Lewis B, Rosenfeld R, Shaman J, Tsou MH, Velardi P, Vespignani A, Finelli L G Influenza Forecasting Contest Working. Results from the centers for disease control and prevention’s predict the 2013–2014 Influenza Season Challenge. BMC Infect Dis. 2016;16:357. - PMC - PubMed
Publication types
MeSH terms
Grants and funding
LinkOut - more resources
Full Text Sources
Other Literature Sources
Medical
