. 2018 Jan:45:66-71.
doi: 10.1016/j.mri.2017.09.010. Epub 2017 Sep 27.

Modification of population based arterial input function to incorporate individual variation

Affiliations

Modification of population based arterial input function to incorporate individual variation

Harrison Kim. Magn Reson Imaging. 2018 Jan.

Abstract

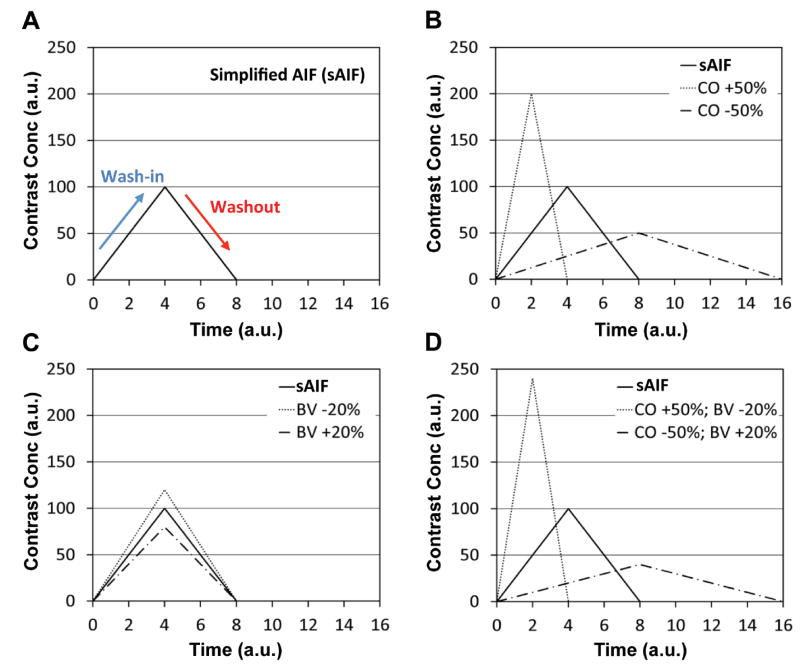
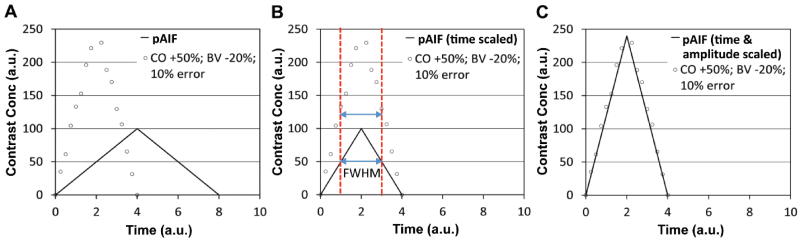
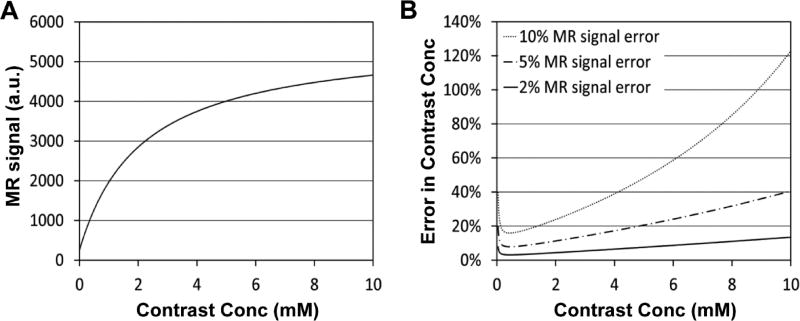
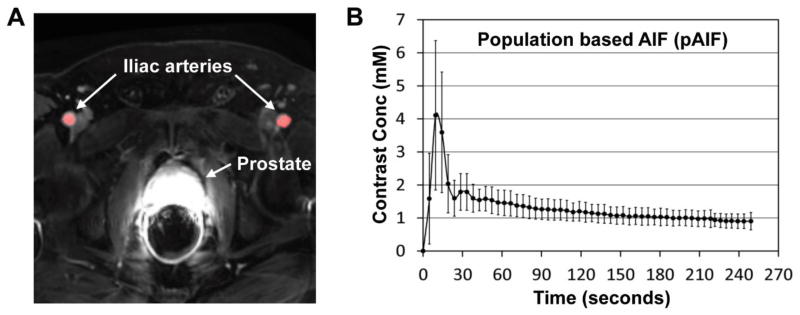
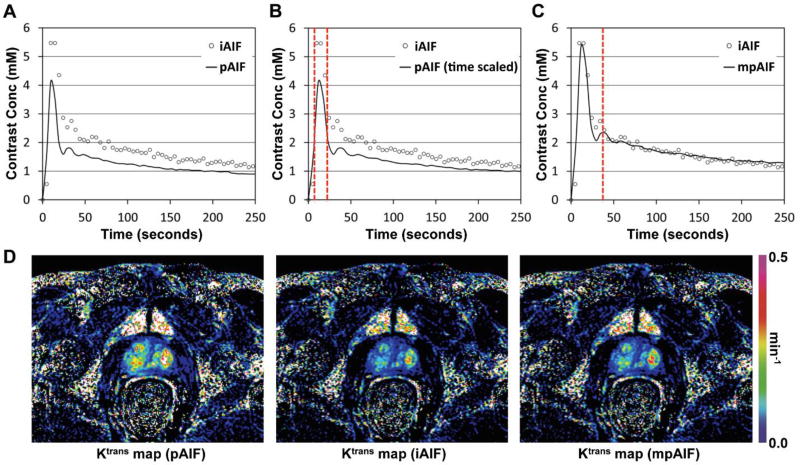
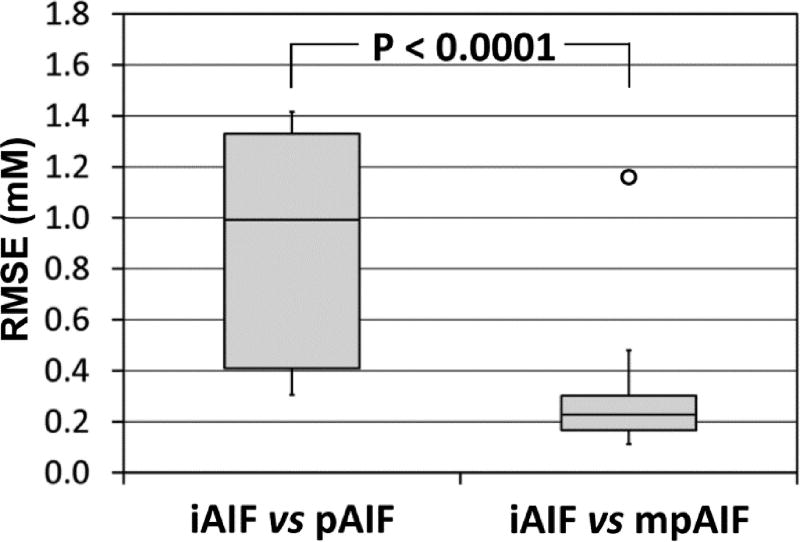
This technical note describes how to modify a population-based arterial input function to incorporate variation among the individuals. In DCE-MRI, an arterial input function (AIF) is often distorted by pulsated inflow effect and noise. A population-based AIF (pAIF) has high signal-to-noise ratio (SNR), but cannot incorporate the individual variation. AIF variation is mainly induced by variation in cardiac output and blood volume of the individuals, which can be detected by the full width at half maximum (FWHM) during the first passage and the amplitude of AIF, respectively. Thus pAIF scaled in time and amplitude fitting to the individual AIF may serve as a high SNR AIF incorporating the individual variation. The proposed method was validated using DCE-MRI images of 18 prostate cancer patients. Root mean square error (RMSE) of pAIF from individual AIFs was 0.88±0.48mM (mean±SD), but it was reduced to 0.25±0.11mM after pAIF modification using the proposed method (p<0.0001).

Keywords: Arterial input function; DCE-MRI.


Conflict of interest statement

DISCLOSURE OF CONFLICTS OF INTEREST

The author has no relevant conflicts of interest to disclose.

Figures

Figure 1
Figure 1
Illustration of AIFs according to the individual variation. (A) An AIF simplified with a triangular function (sAIF). (B) AIFs when cardiac output is 50% higher (CO +50%) or 50% lower (CO −50%) than that of sAIF. (C) AIFs when blood volume is 20% higher (BV +20%) or 20% lower (BV −20%) than that of sAIF. (D) AIFs when cardiac output is 50% higher and blood volume is 20% lower (CO +50%; BV −20%) or when cardiac output is 50% lower and blood volume is 20% higher (CO −50%; BV +20%).
Figure 2
Figure 2
Illustration of modifying a pAIF to incorporate the individual variation. (A) A pAIF (same with sAIF in Fig. 1A) and an individual AIF (iAIF) having 50% higher cardiac output and 20% lower blood volume than the average with random error (10% in average) (CO +50%; BV −20%; 10% error). The pAIF and iAIF are indicated with a solid line and circular dots, respectively. (B) pAIF scaled in time to match its FWHM with that of iAIF. FWHM is indicated with two dotted vertical lines. (C) Time and amplitude scaled pAIF fitting into the iAIF.
Figure 3
Figure 3
Simulation of error in quantitating contrast concentration. (A) MRI signal intensity versus contrast concentration, when a fast spoiled gradient echo sequence is used with 15° flip angle. (B) Error in contrast concentration, when error in MRI signal is 2%, 5% or 10%.
Figure 4
Figure 4
Representative DCE-MRI image and the population based AIF. (A) A representative DCE-MRI image. Two iliac arteries and the prostate are indicated with white arrows. The ROI for AIF determination is highlighted in red. (B) The population based AIF (pAIF) obtained in this study (mean and SD).
Figure 5
Figure 5
Procedure of obtaining the modified population-based AIF (mpAIF). (A) The population-based AIF (pAIF) and an individualized AIF (iAIF) indicated with a solid curve and circular dots. (B) pAIF scaled in time to match its FWHM with that of iAIF, indicated with two dotted vertical lines. (C) Time and amplitude scaled pAIF (mpAIF) fitting into the iAIF after the second peak indicated with a dotted vertical line. (D) Three Ktrans maps of a patient when pAIF, iAIF and mpAIF shown in Figs. 5A–C were used, respectively. The same color scale was applied for all images.
Figure 6
Figure 6
Box plots of root mean square error (RMSE). RMSEs of iAIFs from the pAIF (iAIF vs pAIF) or those from the mpAIFs (iAIF vs mpAIF). The RMSEs of two groups were significantly different (p<0.0001), although one outlier was detected among the RMSEs of iAIFs from mpAIFs.

Similar articles

Cited by

References

    1. Arevalo-Perez J, Kebede AA, Peck KK, Diamond E, Holodny AI, Rosenblum M, et al. Dynamic contrast-enhanced MRI in low-grade versus anapestic oligodendrogliomas. J of Neuroimaging. 2016;26(3):366–71. - PMC - PubMed
    1. Wu J, Gong G, Cui Y, Li R. Intratumor partitioning and texture analysis of dynamic contrast-enhanced (DCE)-MRI identifies relevant tumor subregions to predict pathological response of breast cancer to neoadjuvant chemotherapy. J Magn Reson Imaging. 2016;44(5):1107–15. - PMC - PubMed
    1. Berman RM, Brown AM, Chang SD, Sankineni S, Kadakia M, Wood BJ, et al. DCE MRI of prostate cancer. Abdom Radiol. 2016;41(5):844–53. - PMC - PubMed
    1. Yankeelov TE, Rooney WD, Huang W, Dyke JP, Li X, Tudorica A, et al. Evidence for shutter-speed variation in CR bolus-tracking studies of human pathology. NMR Biomed. 2005;18(3):173–85. - PubMed
    1. Yankeelov TE, Rooney WD, Li X, Springer CS., Jr Variation of the relaxographic "shutter-speed" for transcytolemmal water exchange affects the CR bolus-tracking curve shape. Magn Reson Med. 2003;50(6):1151–69. - PubMed

Publication types