. 2017 Sep 28;7(1):12390.
doi: 10.1038/s41598-017-09435-3.

Endoplasmic reticulum stress preconditioning modifies intracellular mercury content by upregulating membrane transporters

Affiliations

Endoplasmic reticulum stress preconditioning modifies intracellular mercury content by upregulating membrane transporters

Fusako Usuki et al. Sci Rep. .

Abstract

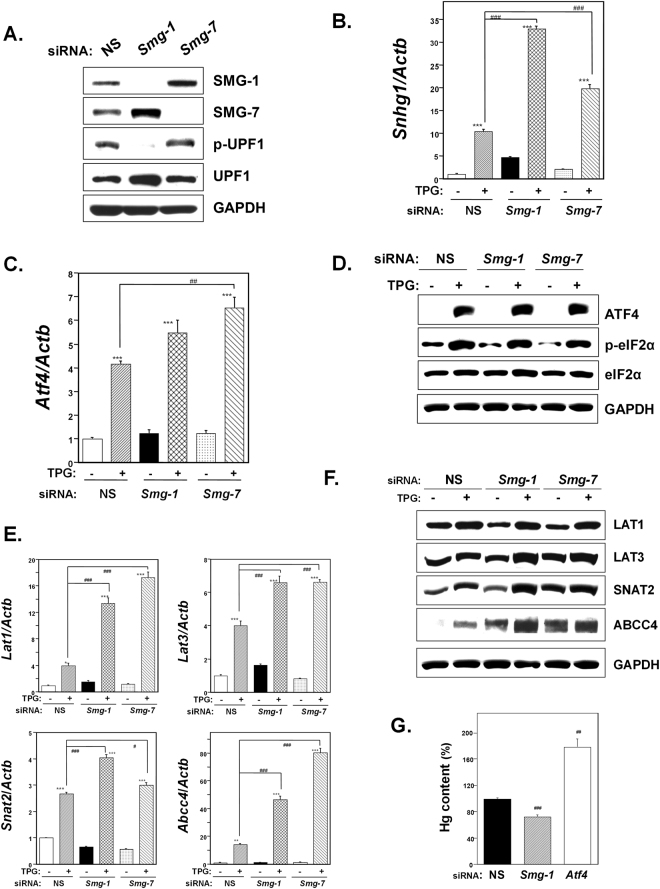
Endoplasmic reticulum (ER) stress preconditioning protects cells against methylmercury (MeHg) cytotoxicity by inducing integrated stress responses such as eIF2α phosphorylation, ATF4 accumulation, and nonsense-mediated mRNA decay (NMD) suppression. Here we demonstrated that ER stress preconditioning results in the upregulation of membrane transporters, leading to a decrease in intracellular mercury content. Our analyses showed that ER stress preconditioning upregulated the expression of methionine transporters that affect the cellular influx of MeHg, LAT1, LAT3, and SNAT2; and a membrane transporter that affects the efflux of MeHg, ABCC4, in MeHg-susceptible myogenic cells. Among these, ABCC4 transporter expression exhibited the greatest elevation. The functional significance of ABCC4 transporter in the efflux of MeHg was shown by the ABCC4 inhibition study. Additionally, we identified the role of phospho-eIF2α/ATF4 pathway in the upregulation of LAT1, SNAT2, and ABCC4 and the role of NMD suppression in LAT3 upregulation. Further, we detected that ER stress preconditioning amplified membrane transporter expression most likely through the translation of the upregulated mRNAs caused by ATF4-dependent transcription and NMD suppression. Taken together, these results suggested that the phospho-eIF2α/ATF4 pathway activation and NMD suppression may represent therapeutic targets for the alleviation of MeHg cytotoxicity by enhancing mercury efflux besides inducing protective stress responses.


Conflict of interest statement

The authors declare that they have no competing interests.

Figures

Figure 1
Figure 1
Effect of ER stress preconditioning on intracellular Hg content and on the expression of membrane transporters following exposure to MeHg. (A) Time course study of intracellular Hg content. C2C12-DMPK160 cells pretreated with TPG (0.3 μg/ml) for 16 h were exposed to 0.5 μM MeHg. Values represent the means ± SE (n = 3). #, ##Significantly different from TPG-untreated cells by a one-way Welch’s t-test (#p < 0.05, ##p < 0.01). (B) Changes in the expression of mRNA following exposure to MeHg. Total RNA was extracted from cells treated with 0.5, 0.8, or 1.0 μM MeHg for 5 or 7 h and membrane transporter mRNA expression was analyzed by RT-qPCR. The histogram depicts the indicated mRNA normalized to Actb mRNA. Values shown are the means ± SE of 3 separate experiments. *, ***Significantly different from MeHg-untreated cells by a one-way ANOVA (*p < 0.05, ***p < 0.001). (C,D) Expression of membrane transporter (C) or the alternative ABCC4 splice-form (Abcc4s) (D) mRNA was analyzed at the times indicated after the exposure to 0.5 μM MeHg using RT-qPCR. The histogram depicts the indicated mRNA normalized to Actb mRNA. Values shown are the means ± SE of 3 separate experiments. *, **, ***Significantly different from TPG- and MeHg-untreated cells by a one-way ANOVA (*p < 0.05, **p < 0.01, ***p < 0.001). (E) Western blotting analyses of membrane transporter expression. Total cell lysates prepared at the times indicated were analyzed using the indicated antibody probes. Cropped blots are shown; all gels were run under the same experimental conditions.
Figure 2
Figure 2
Effect of MeHg exposure and ER stress preconditioning on mTORC1 signaling. (A) Effect of ER stress preconditioning on mTORC1 signaling following exposure to 0.5 μM MeHg. The histogram depicts Mtor mRNA normalized to Actb mRNA analyzed by RT-qPCR. Values shown are the means ± SE of 4 separate experiments. ***Significantly different from TPG-untreated cells by a one-way ANOVA (here p < 0.001). ##, ###Significantly different from TPG-treated and MeHg-untreated cells by a one-way Welch’s t-test (##p < 0.01, ###p < 0.001). §Significantly different from TPG- and MeHg-untreated cells by a one-way Welch’s t-test (here p < 0.05). (B) Western blotting analysis for phospho-4EBP1 (p-4EBP1). Total cell lysates prepared at the times indicated were analyzed using the indicated antibody probes. Cropped blots are shown; all gels were run under the same experimental conditions.
Figure 3
Figure 3
The role of membrane transporter expression for intracellular Hg content following exposure to MeHg. (A) Synthetic siRNA-mediated knockdown of methionine transporter Lat1, Lat3, and Snat2. NS, non-silencing. RT-qPCR data for each methionine transporter was shown. The histogram depicts the indicated mRNA normalized to Actb mRNA. Values shown are the means ± SE of 3 separate experiments. (B) Effect of knockdown of methionine transporters on intracellular Hg content. Cell lysates were prepared 3 h after the exposure to 0.5 μM MeHg. Averaged Hg content of NS siRNA-transfectants was regarded as 100%. Values represent the means ± SE (n = 4). #, ##Significantly different from NS siRNA-transfectants by a one-way Welch’s t-test (#p < 0.05, ##p < 0.01). (C) Effect of the ABCC4 inhibitor Ceefourin 1 on intracellular Hg content. At 5 min prior to MeHg treatment, 2 μM Ceefourin 1 was added followed by 0.5 μM MeHg. ##, ###Significantly different from Ceefourin 1-untreated cells by a one-way Welch’s t-test (##p < 0.01, ###p < 0.001).
Figure 4
Figure 4
Effect of Perk knockdown on membrane transporter expression under ER stress preconditioning. NS, non-silencing. (A) RT-qPCR analysis of Perk mRNA. Total RNA was extracted from untreated cells or following treatment with 0.3 μg/ml TPG for 16 h. The histogram depicts Perk mRNA normalized to Actb mRNA represented as the fold increase over non-pretreated controls. Values shown are the means ± SE of 3 separate experiments. ***Significantly different from TPG-untreated cells by a one-way ANOVA (here p < 0.001). ###Significantly different from TPG-treated NS siRNA-transfectants by a one-way Welch’s t-test (here p < 0.001). (B) Synthetic siRNA-mediated knockdown of Perk. Western blots of C2C12-DMPK160 cells transfected with NS siRNA or Perk siRNA were analyzed using the indicated antibody probes. Cropped blots are shown; all gels were run under the same experimental conditions. (CE) RT-qPCR analysis of membrane transporter (C), Snhg1 (D), or Atf4 (E) mRNA. NS, non-silencing. Total RNA was extracted from untreated cells or following treatment with 0.3 μg/ml TPG for 16 h. The histogram depicts the indicated mRNA normalized to Actb mRNA, represented as the fold increase over non-pretreated controls. Values shown are the means ± SE of 3 separate experiments. *, **, ***Significantly different from TPG-untreated cells by a one-way ANOVA (*p < 0.05, **p < 0.01, ***p < 0.001). #, ##, ###Significantly different from TPG-treated NS siRNA-transfectants by a one-way Welch’s t-test (#p < 0.05, ##p < 0.01, ###p < 0.001).
Figure 5
Figure 5
Effect of eIF2α phosphorylation on membrane transporter expression under ER stress preconditioning. WT, stable cell line transfected with wild-type eIF2α plasmid; SA, stable cell line transfected with mutant eIF2α-SA plasmid. (A) Synthetic siRNA-mediated knockdown of endogenous Eif2α. Western blots of WT and mutant SA cell lines transfected with siRNA against endogenous Eif2α were analyzed using anti-eIF2α antibody probes. NS, non-silencing. Ei, Eif2α siRNA. Representative images of 3 samples are shown. (B) Effect of mutant non-phosphorylatable eIF2α on ATF4, phospho-eIF2α, and eIF2α expression. Western blots of untreated endogenous Eif2α-knockdown WT- or SA-expressing cell lines or pretreated with 0.3 μg/ml TPG for 16 h were analyzed using the indicated antibody probes. Cropped blots shown; all gels were run under the same experimental conditions. Representative images of 3 samples are shown. (CE) Effect of eIF2α phosphorylation on the expression of membrane transporter (C), Snhg1 (D) or Atf4 (E) mRNA was analyzed by RT-qPCR. Total RNA was extracted from untreated cells or following treatment with 0.3 μg/ml TPG for 16 h. The histogram depicts the indicated mRNA normalized to Actb mRNA. Values shown are the means ± SE of 4 separate experiments. **, ***Significantly different from TPG-untreated cells by a one-way ANOVA (**p < 0.01, ***p < 0.001). ##, ###Significantly different from TPG-treated NS siRNA-transfectants by a one-way Welch’s t-test (##p < 0.01, ###p < 0.001).
Figure 6
Figure 6
Effect of Atf4 knockdown on membrane transporter expression under ER stress preconditioning. NS, non-silencing. (A) RT-qPCR analysis of Atf4 mRNA. Total RNA was extracted from untreated cells or following treatment with 0.3 μg/ml TPG for 16 h. The histogram depicts Atf4 mRNA normalized to Actb mRNA, represented as the fold increase over non-pretreated controls. Values shown are the means ± SE of 3 separate experiments. ***Significantly different from TPG-untreated cells by a one-way ANOVA (here p < 0.001). ###Significantly different from TPG-treated NS siRNA-transfectants by a one-way Welch’s t-test (here p < 0.001). (B) Synthetic siRNA-mediated knockdown of Atf4. Western blots of C2C12-DMPK160 cells transfected with NS siRNA or Atf4 siRNA were analyzed using the indicated antibody probes. Cropped blots are shown; all gels were run under the same experimental conditions. (C,E) Effect of Atf4 knockdown on the expression of membrane transporter (C) or Snhg1 (E) mRNA was analyzed by RT-qPCR. Total RNA was extracted from untreated cells or following treatment with 0.3 μg/ml TPG for 16 h. The histogram depicts the indicated mRNA normalized to Actb mRNA. Values shown are the means ± SE of 3 separate experiments. *, ***Significantly different from TPG-untreated cells by a one-way ANOVA (*p < 0.05, ***p < 0.001). ###Significantly different from TPG-treated NS siRNA-transfectants by a one-way Welch’s t-test (here p < 0.001). (D) Western blots of C2C12-DMPK160 cells transfected with NS siRNA or Atf4 siRNA were analyzed using the indicated antibody probes. Cropped blots are shown; all gels were run under the same experimental conditions.
Figure 7
Figure 7
Effect of knockdown of the NMD component Smg-1 or Smg-7 on membrane transporter expression. NS, non-silencing. (A) Western blot analysis for NMD components. Smg-1 or Smg-7 siRNA−transfected cells were analyzed using the indicated antibody probes. Cropped blots are shown; all gels were run under the same experimental conditions. (B,C) RT-qPCR analysis of Snhg1 (B) or Atf4 (C) mRNA. Total RNA was extracted from untreated cells or following treatment with 0.3 μg/ml TPG for 16 h. The histogram depicts each mRNA normalized to Actb mRNA, represented as the fold increase over non-pretreated NS transfectants. Values shown are the means ± SE of 3 separate experiments. ***Significantly different from TPG-untreated cells by a one-way ANOVA (here p < 0.001). ###Significantly different from TPG-treated NS siRNA-transfectants by a one-way Welch’s t-test (here p < 0.001). (D) Western blots of C2C12-DMPK160 cells transfected with NS, Smg-1, or Smg-7 siRNA were analyzed using the indicated antibody probes. Cropped blots are shown; all gels were run under the same experimental conditions. (E) Effect of Smg-1 or Smg-7 knockdown on membrane transporter mRNA expression analyzed by RT-qPCR. Total RNA was extracted from untreated cells or treatment with 0.3 μg/ml TPG for 16 h. The histogram depicts the indicated mRNA normalized to Actb mRNA. Values shown are the means ± SE of 4 separate experiments. *, **, ***Significantly different from TPG-untreated cells by a one-way ANOVA (*p < 0.05, **p < 0.01, ***p < 0.001). #, ###Significantly different from TPG-treated NS siRNA-transfectants by a one-way Welch’s t-test (#p < 0.05, ###p < 0.001). (F) Western blots for membrane transporters of C2C12-DMPK160 cells transfected with NS, Smg-1, or Smg-7 siRNA were analyzed using the indicated antibody probes. Cropped blots are shown; all gels were run under the same experimental conditions. (G) Effect of Smg-1 or Atf4 knockdown on intracellular Hg content. Cells transfected with NS, Smg-1, or Atf4 siRNA were pretreated with TPG (0.2 μg/ml) for 16 h and then exposed to 0.5 μM MeHg. Cell lysates were prepared 1 h after the exposure to MeHg. Averaged Hg content of NS siRNA-transfectants was regarded as 100%. Values represent the means ± SE (n = 4). ##, ###Significantly different from TPG-treated NS siRNA-transfectants by a one-way Welch’s t-test (##p < 0.01, ###p < 0.001).
Figure 8
Figure 8
Summarized membrane transporter upregulation induced by ER stress preconditioning. NMD suppression was related to the upregulation of LAT3 expression and ATF4 accumulation led to upregulated LAT1, SNAT2, and ABCC4 expression. ER stress preconditioning amplified membrane transporter expression most likely through the translation of the upregulated mRNAs caused by ATF4-dependent transcription and NMD suppression.

Similar articles

Cited by

References

    1. Park ST, Lim KT, Chung YT, Kim SU. Methylmercury-induced neurotoxicity in cerebral neuron culture is blocked by antioxidants and NMDA receptor antagonists. Neurotoxicology. 1996;17:37–45. - PubMed
    1. Yee S, Choi BH. Oxidative stress in neurotoxic effects of methylmercury poisoning. Neurotoxicology. 1996;17:17–26. - PubMed
    1. Usuki F, Ishiura S. Expanded CTG repeats in myotonin protein kinase increase susceptibility to oxidative stress. Neuroreport. 1998;9:2291–2296. doi: 10.1097/00001756-199807130-00027. - DOI - PubMed
    1. Usuki F, Maruyama K. Ataxia caused by mutations in the alpha-tocopherol transfer protein gene. J. Neurol. Neurosurg. Psychiatry. 2000;69:254–256. doi: 10.1136/jnnp.69.2.254. - DOI - PMC - PubMed
    1. Usuki F, Fujita E, Sasagawa N. Methylmercury activates ASK1/JNK signaling pathways, leading to apoptosis due to both mitochondria- and endoplasmic reticulum (ER)-generated processes in myogenic cell lines. Neurotoxicology. 2008;29:22–30. doi: 10.1016/j.neuro.2007.08.011. - DOI - PubMed

Publication types

MeSH terms