. 2017 Sep 28;7(1):12387.
doi: 10.1038/s41598-017-11543-z.

Highly diversified expansions shaped the evolution of membrane bound proteins in metazoans

Affiliations

Highly diversified expansions shaped the evolution of membrane bound proteins in metazoans

Misty M Attwood et al. Sci Rep. .

Abstract

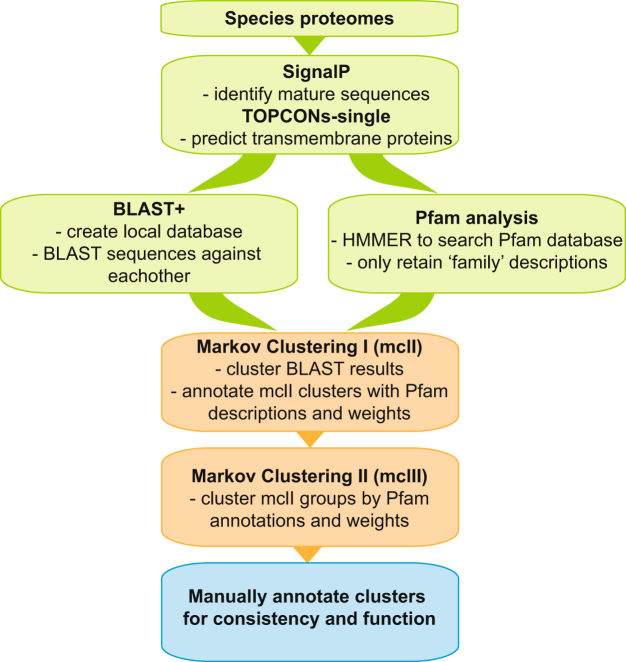
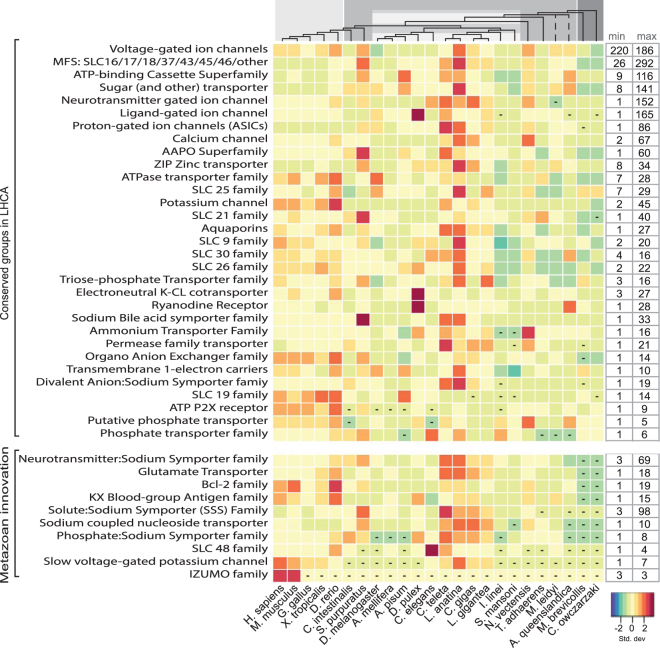
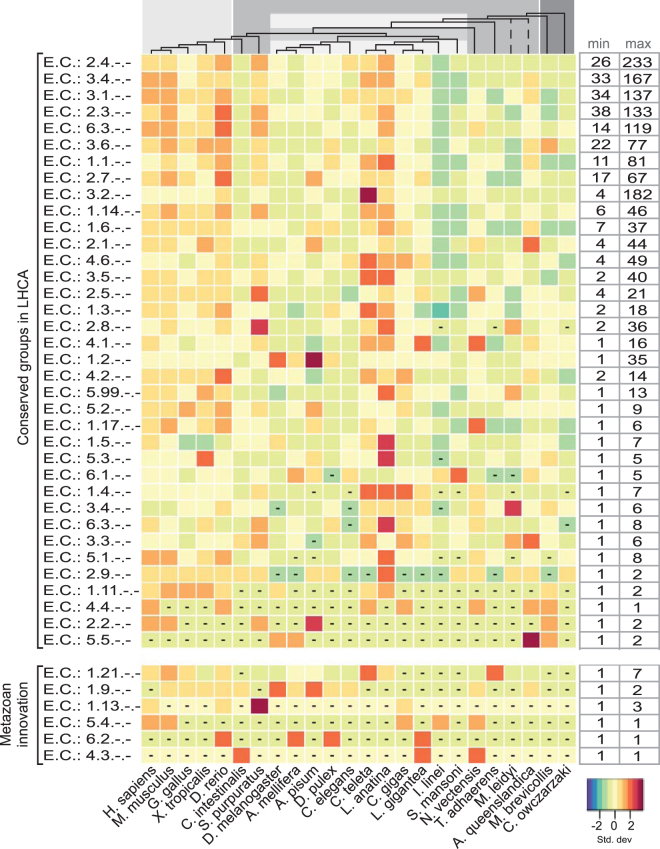
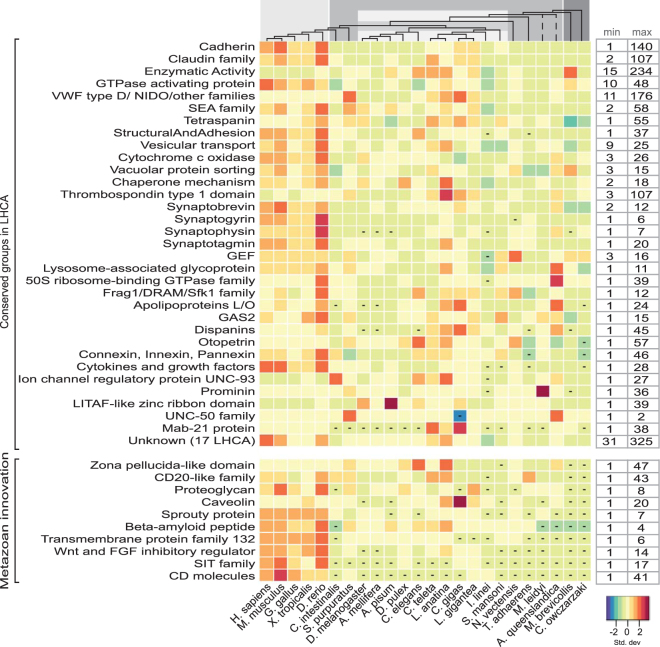
The dramatic increase in membrane proteome complexity is arguably one of the most pivotal evolutionary events that underpins the origin of multicellular animals. However, the origin of a significant number of membrane families involved in metazoan development has not been clarified. In this study, we have manually curated the membrane proteomes of 22 metazoan and 2 unicellular holozoan species. We identify 123,014 membrane proteins in these 24 eukaryotic species and classify 86% of the dataset. We determine 604 functional clusters that are present from the last holozoan common ancestor (LHCA) through many metazoan species. Intriguingly, we show that more than 70% of the metazoan membrane protein families have a premetazoan origin. The data show that enzymes are more highly represented in the LHCA and expand less than threefold throughout metazoan species; in contrast to receptors that are relatively few in the LHCA but expand nearly eight fold within metazoans. Expansions related to cell adhesion, communication, immune defence, and developmental processes are shown in conjunction with emerging biological systems, such as neuronal development, cytoskeleton organization, and the adaptive immune response. This study defines the possible LHCA membrane proteome and describes the fundamental functional clusters that underlie metazoan diversity and innovation.


Conflict of interest statement

The authors declare that they have no competing interests.

Figures

Figure 1
Figure 1
Methods pipeline for dataset. Pipeline of methods used to create dataset for analysis. The 24 species proteomes were downloaded and prepared for analysis. SignalP was used to excise signal peptides and TOPCONs-single consensus software predicted the transmembrane proteins. An all-versus-all BLAST database was created as well Pfam annotations were searched for all sequences. Two-step Markov clustering was performed on first the BLAST results and then on those clusters using the Pfam annotation. The first and second clusters were manually annotated for consistency and function using our human membrane proteome characterizations as well as Pfam descriptions.
Figure 2
Figure 2
Functional Classifications Overview. The functional classification groups are depicted as a bar chart relative to the total size of each species membrane proteome. The last metazoan common ancestor (LMCA) (light gray pentagon) and last holozoan common ancestor (darker gray pentagon) are noted. The dendrogram represents the evolutionary relationship among the investigated organisms. The branch lengths are not relative to evolutionary distance. The dashed lines indicate unresolved lineages. Species topology including I. linei is based on ref. and the A. queenslandica placement is from ref.. The light gray colour box corresponds to vertebrate metazoans, the darker gray represents invertebrate species, the striped gray box is protostomia members, and the dark gray are the two opisthokont unicellular relatives.
Figure 3
Figure 3
Receptors: the evolution of selected receptor families across eukaryotes. The heatmap illustrates the relative content of selected receptor families across species. For each organism, the number of receptors in a specific family was standardized with the standard deviation for that family. According to the key, an increasing red hue indicates more receptors coded as the number of standard deviations from zero (the mean) and an increasing blue colour corresponds with less receptor proteins coded. The boxes with dashes indicate zero members in that cluster. The receptor families are described on the left and functional clusters are grouped according to those identified in the LHCA subset and those clusters that are metazoan innovations. The minimum and maximum values for the selected receptor families are displayed on the right side of the heatmap so that the relative colour differentiation is clarified by the range of proteins present in each transporter family. The dendrogram at the top of the heatmap represents the evolutionary relationship among the investigated organisms. The branch lengths are not relative to evolutionary distance. The dashed lines indicate unresolved lineages. Species topology including I. linei is based on ref. and the A. queenslandica placement is from ref.. The light gray colour corresponds to vertebrate metazoans, the medium gray represents invertebrate species, the striped gray box indicates protostomia species, and the dark gray are the two opisthokont unicellular relatives.
Figure 4
Figure 4
Transporters: the evolution of selected transportation families in eukaryotes. The heatmap presents the relative content of selected transporter families across different metazoan species. For each organism, the number of transporters in a specific family was standardized with the standard deviation for that family. The key indicates that an increasing darker red hue illustrates more transporters coded as the number of standard deviations from zero (the mean) and an increasing blue colour corresponds with less transporter proteins coded. The boxes with dashes indicate no members in that group. The transporter family names are specified on the left side left and functional clusters are grouped according to those identified in the LHCA subset and those clusters that are metazoan innovation. The minimum and maximum values for the selected transporter families are displayed on the right side of the heatmap so that the relative colour differentiation is clarified by the range of proteins present in each transporter family. The dendrogram at the top of the heatmap represents the evolutionary relationship among the investigated organisms. The branch lengths are not relative to evolutionary distance. The dashed lines indicate unresolved lineages. Species topology including I. linei is based on ref. and the A. queenslandica placement is from ref.. The light gray colour corresponds to vertebrate metazoans, the darker gray represents invertebrate species, the striped gray box is protostomia members, and the dark gray are the two opisthokont unicellular relatives.
Figure 5
Figure 5
Enzymes: the evolution of the human enzyme repertoire across eukaryotes. The heatmap illustrates the relative content of transmembrane enzymes throughout different species. For each organism, the number of enzymes in each family was standardized with the standard deviation for that family. The key illustrates that an increasing darker red hue indicates more enzymes coded as the number of standard deviations from zero (the mean) and an increasing blue colour corresponds with less enzyme proteins coded. The boxes with dashes signify no species members were found in the group. The Enzyme Commission (EC) classes are described on the left side. They are grouped according to those identified in the LHCA subset and those clusters that are metazoan innovations. The minimum and maximum values for the selected enzyme families are displayed on the right side of the heatmap so that the relative colour differentiation is clarified through the range of proteins present in each enzyme family. The dendrogram at the top of the heatmap represents the evolutionary relationship among the investigated organisms. The branch lengths are not relative to evolutionary distance. The dashed lines indicate unresolved lineages. Species topology including I. linei is based on ref. and the A. queenslandica placement is from ref.. The light gray colour corresponds to vertebrate metazoans, the darker gray represents invertebrate species, the striped box indicates protostomia species, and the dark gray are the two opisthokont unicellular relatives.
Figure 6
Figure 6
Other functional clusters: the evolution of protein families classified by various functions. The heatmap illustrates the relative content of protein families with functions other than receptors, transporters, or enzymes. For each organism, the number of proteins in a certain family was normalized with the standard deviation for that family. The key indicates an increasing darker red hue as more receptors coded as the number of standard deviations from zero (the mean) and an increasing blue colour corresponds with less proteins. The dashes in boxes indicate that are no species members for that cluster. The family names are indicated on the left side of the heatmap and functional clusters are grouped according to those identified in the LHCA subset and those clusters that are metazoan innovations. The minimum and maximum values for the selected families are displayed on the right side of the heatmap so that the relative colour differentiation is clarified through the range of proteins present in each family. The dendrogram at the top of the heatmap represents the evolutionary relationship among the investigated organisms. The branch lengths are not relative to evolutionary distance. The dashed lines indicate unresolved lineages. Species topology including I. linei is based on ref. and the A. queenslandica placement is from ref.. The light gray colour corresponds to vertebrate metazoans, the darker gray represents invertebrate species, the striped gray box indicate protostomia species, and the dark gray are the two opisthokont unicellular relatives.

References

    1. Nam H-J, Kim I, Bowie JU, Kim S. Metazoans evolved by taking domains from soluble proteins to expand intercellular communication network. Scientific Reports. 2015;5:9576. doi: 10.1038/srep09576. - DOI - PMC - PubMed
    1. Flajnik MF, Kasahara M. Origin and evolution of the adaptive immune system: genetic events and selective pressures. Nat Rev Genet. 2010;11:47–59. doi: 10.1038/nrg2703. - DOI - PMC - PubMed
    1. Barrantes, F. J. The Nicotinic Acetylcholine Receptor: Current Views and Future Trends. (Springer, 2013).
    1. Rask-Andersen M, Almén MS, Schiöth HB. Trends in the exploitation of novel drug targets. Nat Rev Drug Discov. 2011;10:579–590. doi: 10.1038/nrd3478. - DOI - PubMed
    1. Suga H, et al. Genomic survey of premetazoans shows deep conservation of cytoplasmic tyrosine kinases and multiple radiations of receptor tyrosine kinases. Sci Signal. 2012;5:ra35. doi: 10.1126/scisignal.2002733. - DOI - PubMed

Publication types

LinkOut - more resources