

Exposure assessment models for elemental components of particulate matter in an urban environment: A comparison of regression and random forest approaches
- PMID: 28959135
- PMCID: PMC5611888
- DOI: 10.1016/j.atmosenv.2016.11.066
Exposure assessment models for elemental components of particulate matter in an urban environment: A comparison of regression and random forest approaches
Abstract
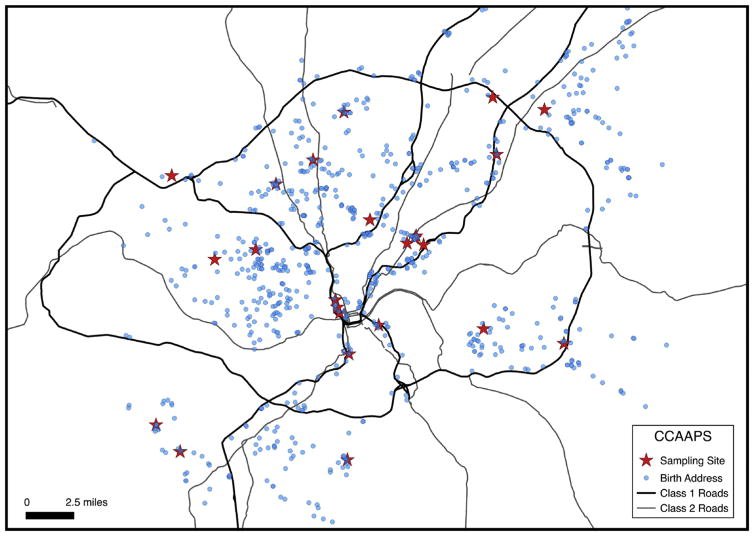
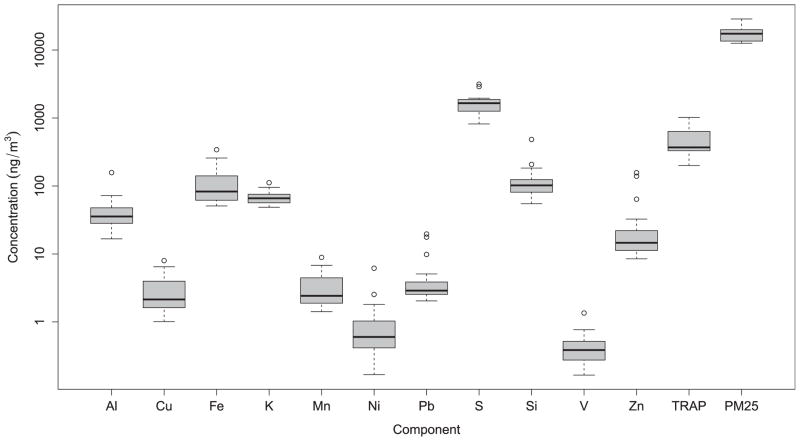
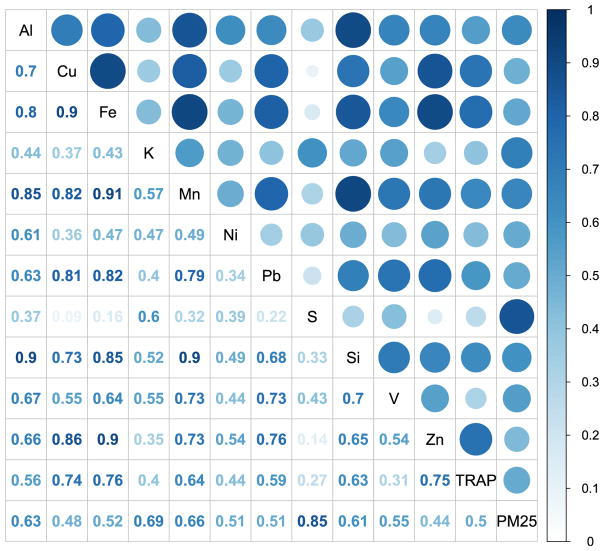
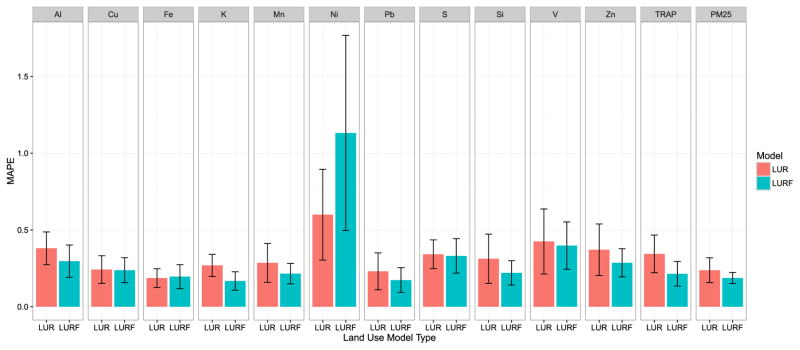
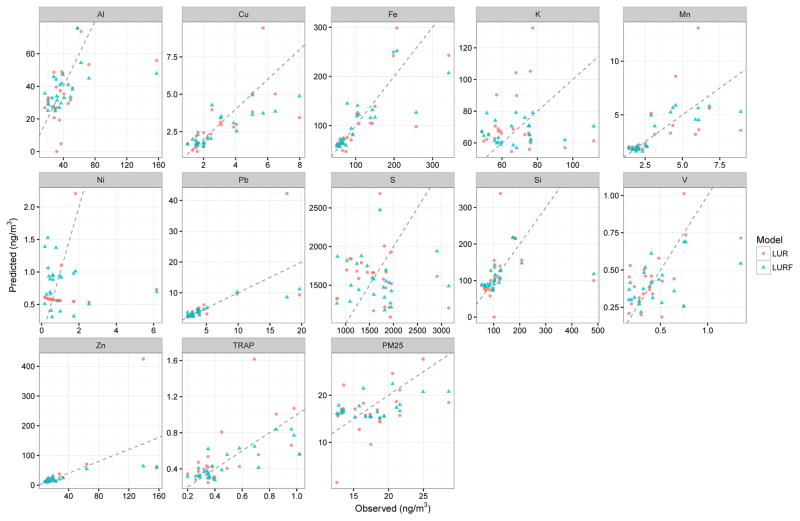
Exposure assessment for elemental components of particulate matter (PM) using land use modeling is a complex problem due to the high spatial and temporal variations in pollutant concentrations at the local scale. Land use regression (LUR) models may fail to capture complex interactions and non-linear relationships between pollutant concentrations and land use variables. The increasing availability of big spatial data and machine learning methods present an opportunity for improvement in PM exposure assessment models. In this manuscript, our objective was to develop a novel land use random forest (LURF) model and compare its accuracy and precision to a LUR model for elemental components of PM in the urban city of Cincinnati, Ohio. PM smaller than 2.5 μm (PM2.5) and eleven elemental components were measured at 24 sampling stations from the Cincinnati Childhood Allergy and Air Pollution Study (CCAAPS). Over 50 different predictors associated with transportation, physical features, community socioeconomic characteristics, greenspace, land cover, and emission point sources were used to construct LUR and LURF models. Cross validation was used to quantify and compare model performance. LURF and LUR models were created for aluminum (Al), copper (Cu), iron (Fe), potassium (K), manganese (Mn), nickel (Ni), lead (Pb), sulfur (S), silicon (Si), vanadium (V), zinc (Zn), and total PM2.5 in the CCAAPS study area. LURF utilized a more diverse and greater number of predictors than LUR and LURF models for Al, K, Mn, Pb, Si, Zn, TRAP, and PM2.5 all showed a decrease in fractional predictive error of at least 5% compared to their LUR models. LURF models for Al, Cu, Fe, K, Mn, Pb, Si, Zn, TRAP, and PM2.5 all had a cross validated fractional predictive error less than 30%. Furthermore, LUR models showed a differential exposure assessment bias and had a higher prediction error variance. Random forest and other machine learning methods may provide more accurate exposure assessment.
Keywords: Elemental PM2.5; Land use regression; Random forest.
Figures
References
-
- Aguilera I, Sunyer J, Fernández-Patier R, Hoek G, Aguirre-Alfaro A, Meliefste K, Bomboi-Mingarro MT, Nieuwenhuijsen MJ, Herce-Garraleta D, Brunekreef B. Estimation of outdoor NO x, NO2, and BTEX exposure in a cohort of pregnant women using land use regression modeling. Environ Sci Technol. 2007;42:815–821. - PubMed
-
- Alvarez S, Diaz-Uriarte R, Osorio A, Barroso A, Melchor L, Paz MF, Honrado E, Rodríguez R, Urioste M, Valle L. A predictor based on the somatic genomic changes of the BRCA1/BRCA2 breast cancer tumors identifies the non-BRCA1/BRCA2 tumors with BRCA1 promoter hypermethylation. Clin Cancer Res. 2005;11:1146–1153. - PubMed
-
- Beckerman BS, Jerrett M, Martin RV, van Donkelaar A, Ross Z, Burnett RT. Application of the deletion/substitution/addition algorithm to selecting land use regression models for interpolating air pollution measurements in California. Atmos Environ. 2013;77:172–177.
-
- Beelen R, Voogt M, Duyzer J, Zandveld P, Hoek G. Comparison of the performances of land use regression modelling and dispersion modelling in estimating small-scale variations in long-term air pollution concentrations in a Dutch urban area. Atmos Environ. 2010;44:4614–4621.
Grants and funding
LinkOut - more resources
Full Text Sources
Other Literature Sources