. 2017 Sep 14:8:1139.
doi: 10.3389/fimmu.2017.01139. eCollection 2017.

Deciphering of the Human Interferon-Regulated Proteome by Mass Spectrometry-Based Quantitative Analysis Reveals Extent and Dynamics of Protein Induction and Repression

Affiliations

Deciphering of the Human Interferon-Regulated Proteome by Mass Spectrometry-Based Quantitative Analysis Reveals Extent and Dynamics of Protein Induction and Repression

Dominik A Megger et al. Front Immunol. .

Abstract

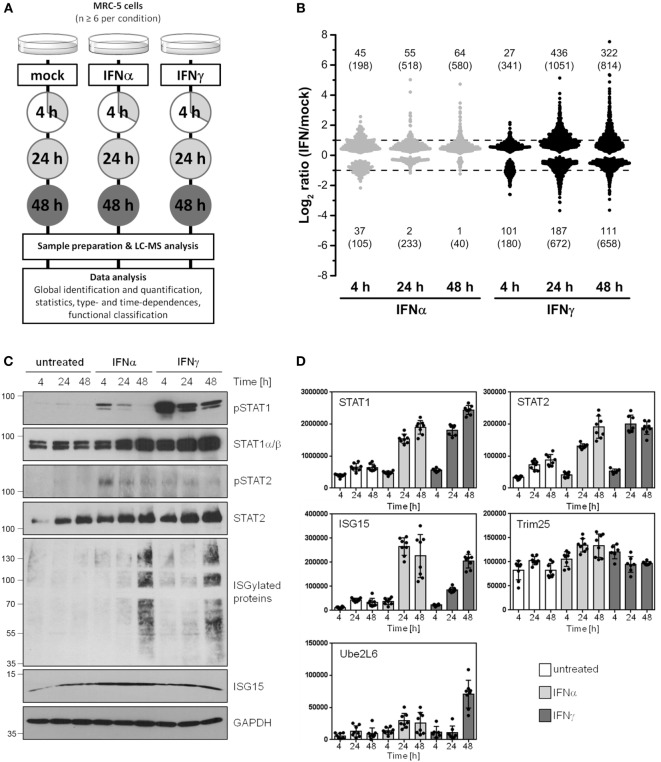
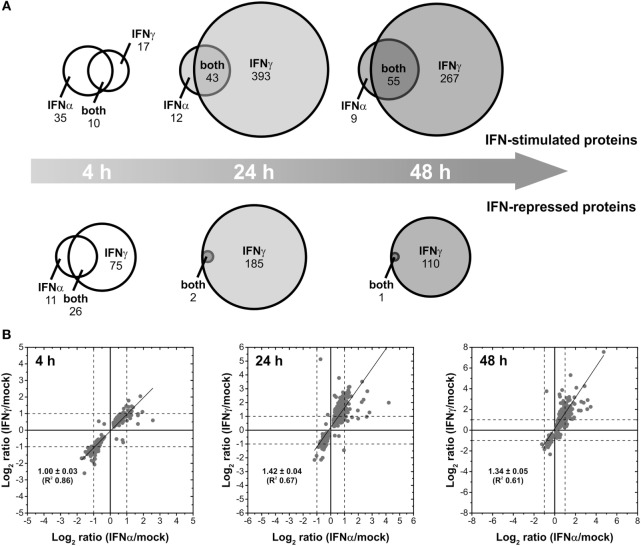
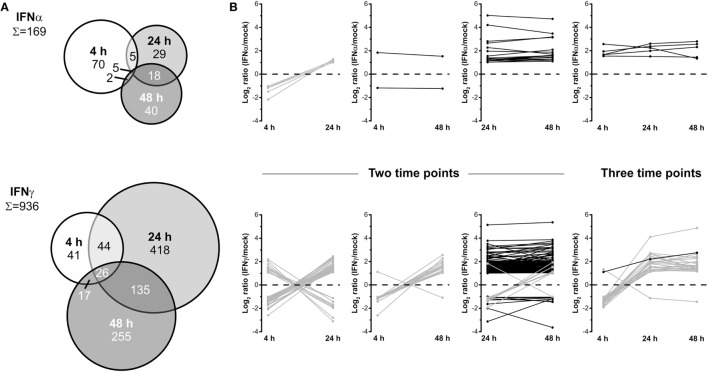
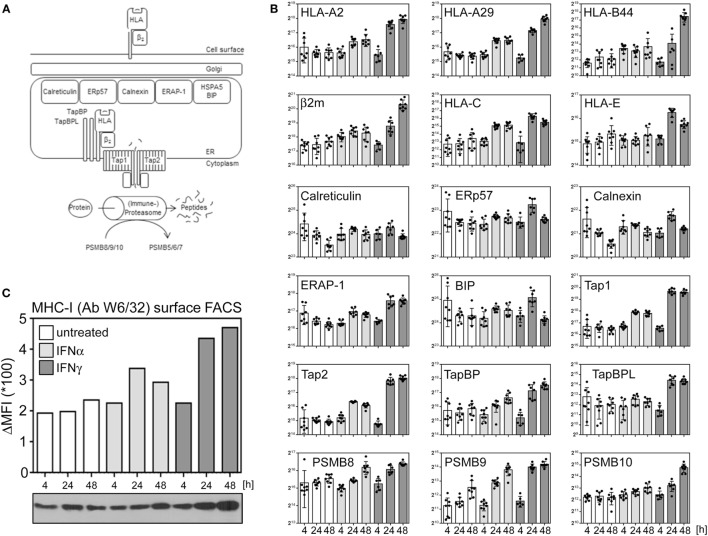
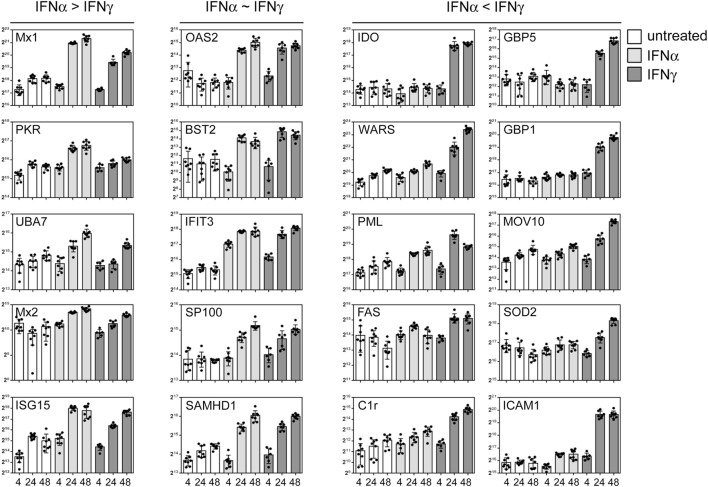
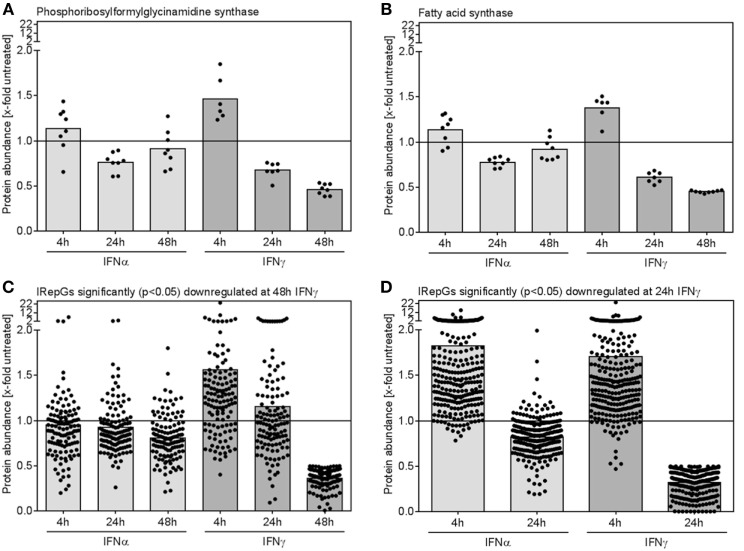
Interferons (IFNs) are pleotropic cytokines secreted upon encounter of pathogens and tumors. Applying their antipathogenic, antiproliferative, and immune stimulatory capacities, recombinant IFNs are frequently prescribed as drugs to treat different diseases. IFNs act by changing the gene expression profile of cells. Due to characteristics such as rapid gene induction and signaling, IFNs also represent prototypical model systems for various aspects of biomedical research (e.g., signal transduction). In regard to the signaling and activated promoters, IFNs can be subdivided into two groups. Here, alterations of the cellular proteome of human cells treated with IFNα and IFNγ were elucidated in a time-resolved manner by quantitative proteome analysis. The majority of protein regulations were strongly IFN type and time dependent. In addition to the expected upregulation of IFN-responsive proteins, an astonishing number of proteins became profoundly repressed especially by IFNγ. Thus, our comprehensive analysis revealed important insights into the human IFN-regulated proteome and its dynamics of protein induction and repression. Interestingly, the new class of IFN-repressed genes comprises known host factors for highly relevant pathogens such as HIV, dengue virus, and hepatitis C virus.

Keywords: IFN-repressed gene; IFN-stimulated gene; IFNalpha; IFNgamma; interferon; mass spectrometry; proteome.


Figures

Figure 1
Figure 1
Global identification and quantification of interferon (IFN)-regulated proteins in human cells. (A) General design of the conducted proteomics study. (B) Overview of significantly regulated proteins (p < 0.05) depending on the IFN type (IFNα: gray, IFNγ: black) and exposure times (4, 24, and 48 h). Fold change thresholds (twofold regulation) are indicated as dashed lines. The number of proteins passing the significance threshold is shown in brackets. The numbers of proteins satisfying significance as well as fold change criteria are indicated without brackets. (C) Experimental conditions as in (A), but cells were harvested and lysed for immunoblot analysis using indicated antibodies. The lines and numbers on the left depict the migration of the marker proteins with indicated molecular weights in kDa. (D) The normalized abundances of the same proteins (or their regulators) shown in (C) calculated by use of the MS data are depicted. As in all analyses, unstimulated controls are depicted in white, IFNα stimulation in light gray, and IFNγ stimulation in dark gray bars, respectively. Individual quantifications (n = 6–8) are indicated as dots, bars depict mean values with SD (error bars).
Figure 2
Figure 2
Differential changes of the proteome induced by different interferons (IFNs). (A) Venn diagrams illustrating the direct comparison of the number of IFNα- and IFNγ-stimulated and repressed proteins (p < 0.05, at least twofold regulation) after different times of exposure. (B) Scatter plots showing the linear correlation of IFNα- and IFNγ-induced protein regulations (log2-transformed ratios of significant regulations with p < 0.05). The calculation of the regression lines reveals stronger IFNγ-induced regulations after prolonged exposure (24 and 48 h).
Figure 3
Figure 3
Dynamics of the human interferon (IFN) proteome. (A) Venn diagrams illustrating the direct comparison of numbers of significantly and at least twofold regulated proteins after different treatment times. (B) Regulation profiles (log2-transformed ratios) for proteins being significantly and at least twofold regulated at more than one individual time point. Proteins showing inconsistent regulations at different time points are shown in gray and those consistently up- or downregulated in black.
Figure 4
Figure 4
Interferon (IFN) responsiveness of the components of peptide loading and antigen MHC presentation. (A) Simplified schema of peptide loading and MHC/human leukocyte antigen (HLA) presentation. See text for more details. (B) Normalized abundances of indicated proteins at indicated time points. The depicted proteins were selected based on their well-known role in peptide generation, peptide loading and/or MHC presentation. Unstimulated controls are depicted in white, IFNα stimulation in light gray, and IFNγ stimulation is indicated in dark gray bars, respectively. Individual quantifications (n = 6–8) are depicted as dots, bars indicate mean values with SD (error bars). (C) MHC-I surface disposition determined by flow cytometric analysis using the W6/32 antibody which recognizes β2m-associated HLA-A, -B, and -C molecules (upper bar chart) and overall protein abundance of the HLA heavy chains as determined by immunoblot using the HC10 antibody (lower panel).
Figure 5
Figure 5
Differential interferon (IFN) responsiveness of effector proteins. Quantifications of indicated proteins are depicted as in Figure 4. The left panel shows selected proteins which are more IFNα responsive. The central panel depicts selected proteins which are similarly IFNα and IFNγ responsive, and the right panel highlights selected proteins which are more responsive to IFNγ. The proteins were chosen according to their previously described role in antiviral activity. The complete set of quantified proteins can be found in the Data Sheet S1 in Supplementary Material.
Figure 6
Figure 6
Dynamics of individual and global regulation of interferon (IFN)-repressed proteins. (A,B) The relative changes of protein abundance when compared with untreated control cells for two representative IFN-repressed genes (IRepGs) are depicted. (C) All proteins significantly (p < 0.05) downregulated at 48 h of IFNγ treatment were examined concerning IFNα- and IFNγ-dependent regulation. (D) The 4 and 24 h regulation of proteins significantly (p < 0.05) downregulated at 24 h of IFNγ treatment is shown. Dots represent individual quantifications (A,B) or individual proteins (C,D), bars depict the mean regulation of the respective group.

Similar articles

Cited by

References

    1. Muller U, Steinhoff U, Reis LF, Hemmi S, Pavlovic J, Zinkernagel RM, et al. Functional role of type I and type II interferons in antiviral defense. Science (1994) 264:1918–21. 10.1126/science.8009221 - DOI - PubMed
    1. Gil MP, Bohn E, O’Guin AK, Ramana CV, Levine B, Stark GR, et al. Biologic consequences of Stat1-independent IFN signaling. Proc Natl Acad Sci U S A (2001) 98:6680–5. 10.1073/pnas.111163898 - DOI - PMC - PubMed
    1. Casanova JL. Severe infectious diseases of childhood as monogenic inborn errors of immunity. Proc Natl Acad Sci U S A (2015) 112:E7128–37. 10.1073/pnas.1521651112 - DOI - PMC - PubMed
    1. Kaplan DH, Shankaran V, Dighe AS, Stockert E, Aguet M, Old LJ, et al. Demonstration of an interferon gamma-dependent tumor surveillance system in immunocompetent mice. Proc Natl Acad Sci U S A (1998) 95:7556–61. 10.1073/pnas.95.13.7556 - DOI - PMC - PubMed
    1. Shankaran V, Ikeda H, Bruce AT, White JM, Swanson PE, Old LJ, et al. IFNgamma and lymphocytes prevent primary tumour development and shape tumour immunogenicity. Nature (2001) 410:1107–11. 10.1038/35074122 - DOI - PubMed