

Dose- and time-dependent changes in tissue levels of tetrabromobisphenol A (TBBPA) and its sulfate and glucuronide conjugates following repeated administration to female Wistar Han Rats
- PMID: 28959539
- PMCID: PMC5615791
- DOI: 10.1016/j.toxrep.2016.01.007
Dose- and time-dependent changes in tissue levels of tetrabromobisphenol A (TBBPA) and its sulfate and glucuronide conjugates following repeated administration to female Wistar Han Rats
Abstract
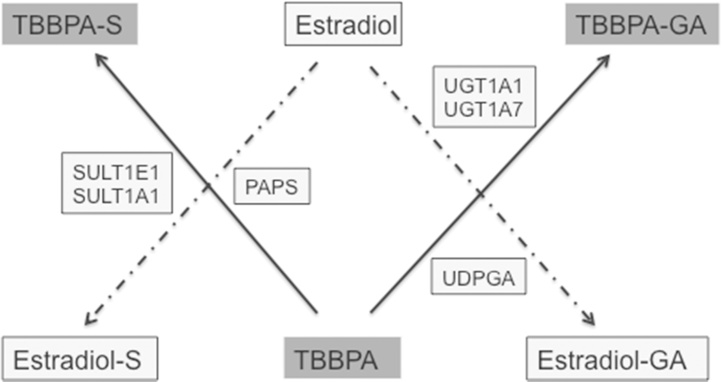
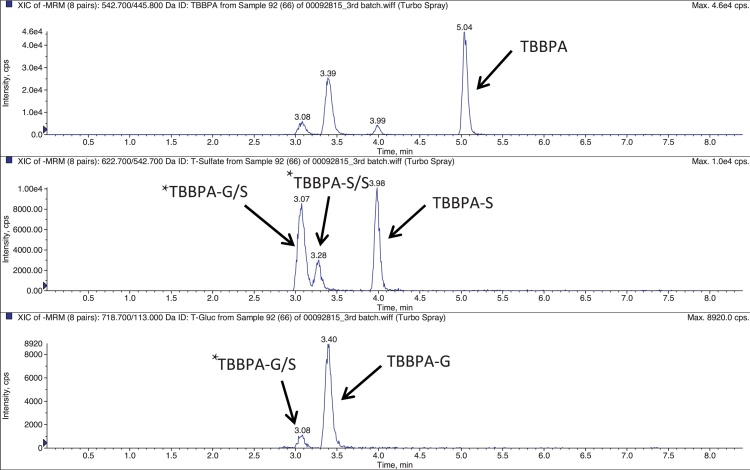
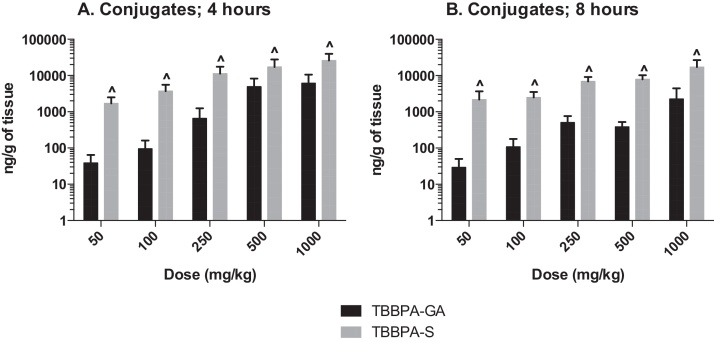
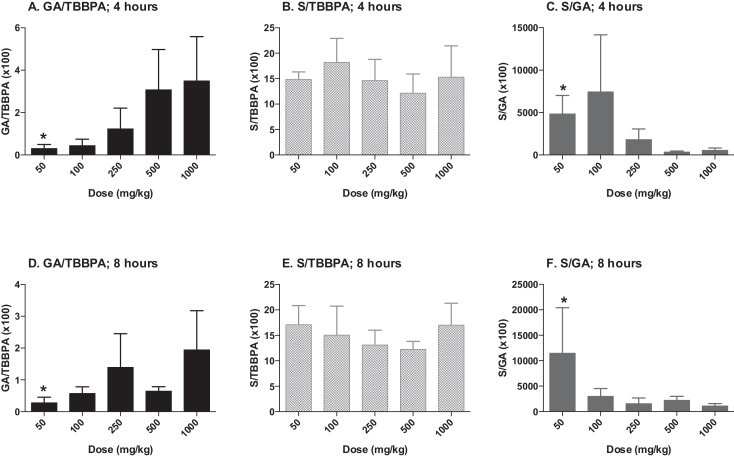
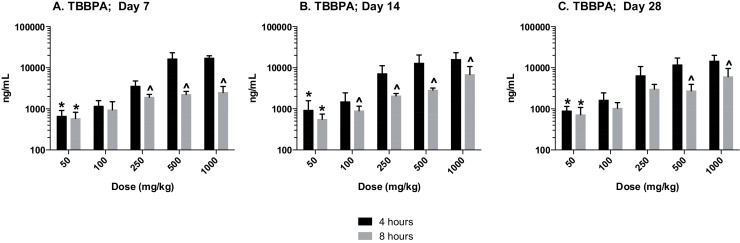
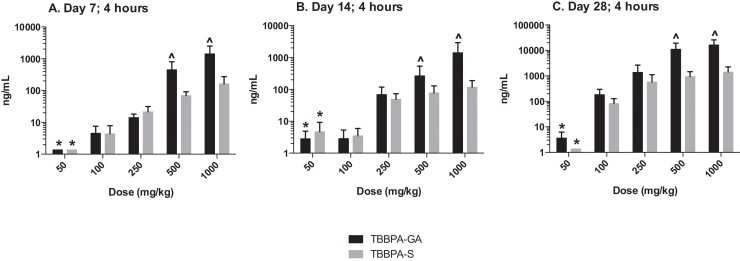
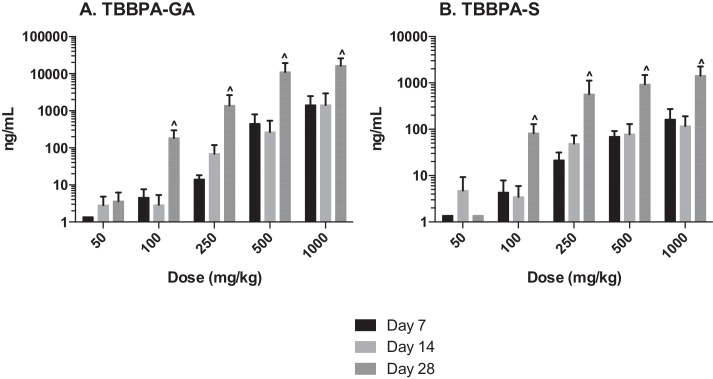
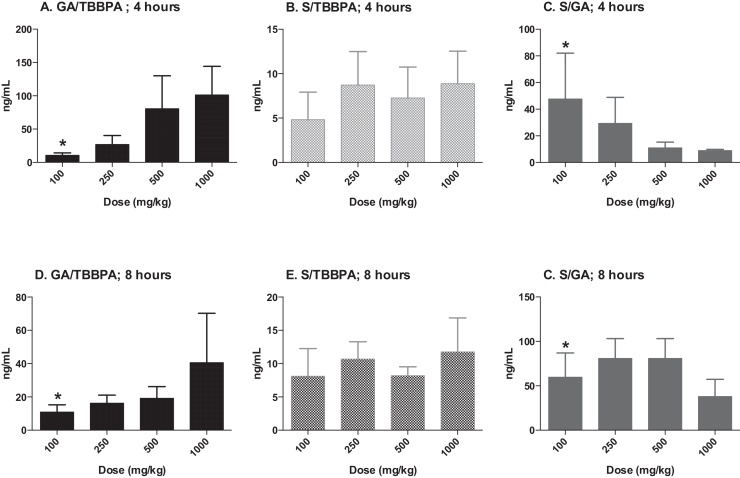
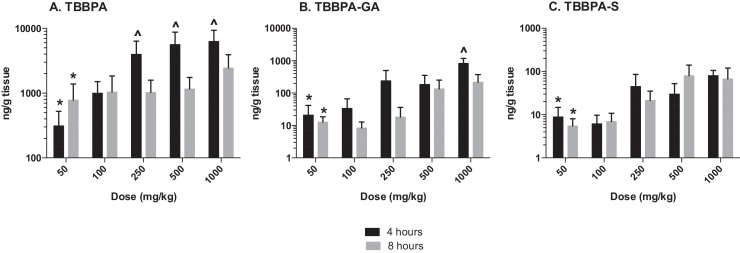
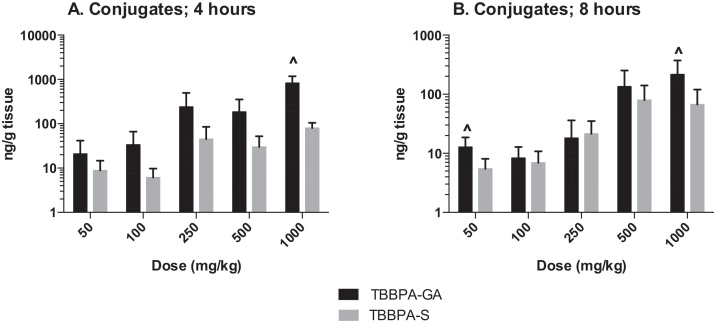
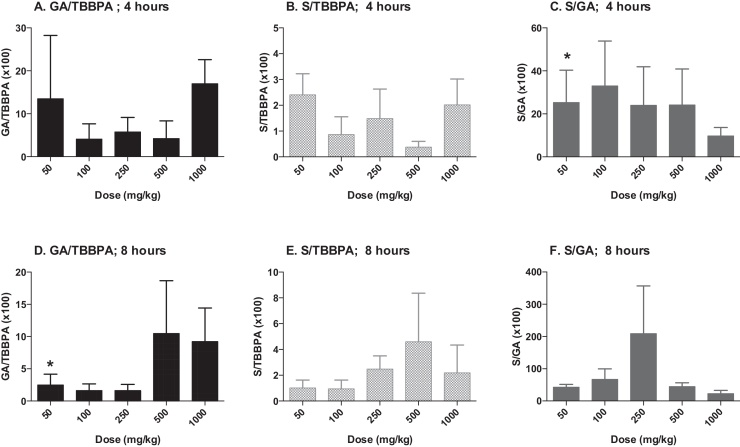
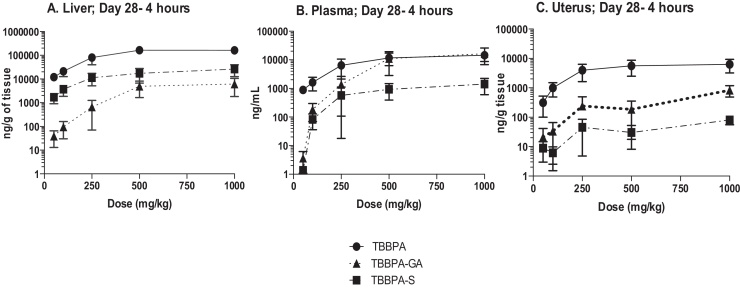
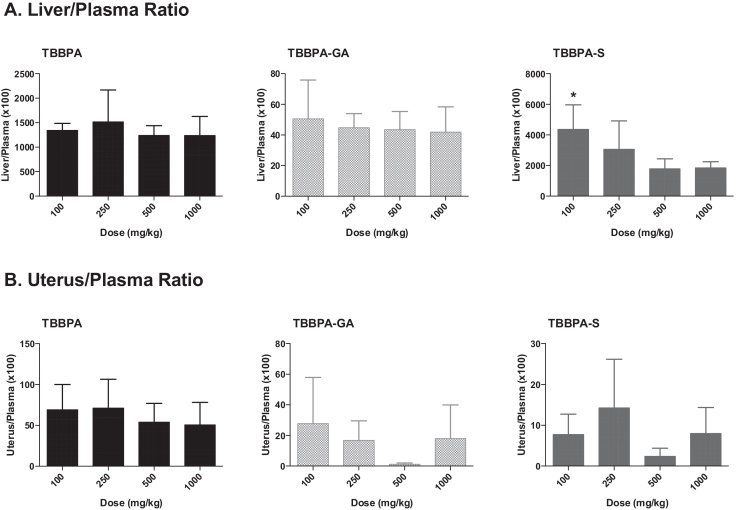
Tetrabromobisphenol A (TBBPA), a nongenotoxic flame retardant, causes uterine tumors in female rats. A proposed mode of action (MoA) for these tumors involves an increase in the bioavailability of estradiol as a result of TBBPA inhibiting estrogen sulfotransferases (ES), the enzymes responsible for inactivating and enhancing the elimination of estradiol. The objective of this study was to evaluate the effect of dose and repeated administration of TBBPA on the level of TBBPA, TBBPA-glucuronide (GA) and TBBPA-sulfate (S) conjugates in plasma, liver and uterus of female Wistar Han rats administered TBBPA (50, 100, 250, 500 or 1000 mg/kg) for 28 consecutive days. In accordance with this objective, TBBPA sulfation was used as a surrogate for evaluating the potential for estradiol sulfation to be limited at high dose levels of TBBPA. Blood samples were collected at 4 and 8 h post-dosing on study day 7, 14, and 28, while liver and uterus were collected at the same time points following 28 days of dosing. Tissue samples were analyzed for TBBPA, TBBPA-GA and TBBPA-S by LC-MS/MS. A dose-related increase in the concentration of all three analytes occurred in plasma (day 7, 14, and 28) as well as liver and uterus tissue (day 28) at both 4 and 8 h post dose. The plasma concentration of TBBPA-GA and TBBPA-S was higher in animals dosed for 28 days compared to those dosed for 7 or 14 days showing an increase in systemic circulation of these conjugates with repeated administration. The balance of these conjugates was also different in tissues with TBBPA-S > TBBPA-GA at high doses in the liver and TBBPA-GA > TBBPA-S in both plasma and uterus. In all three tissues the ratio of TBBPA-S/TBBPA-GA showed a decreasing trend with dose, suggesting that at high TBBPA dose levels sulfation of TBBPA becomes limited. This effect was most apparent in the liver and plasma at 28 days of administration. Together these data show that administration of high doses of TBBPA associated with the induction of uterine tumors, results in a disruption in the balance of conjugates reflected by a decrease in the TBBPA-S/TBBPA-GA ratio. A limitation in the sulfation of TBBPA in vivo supports in vitro data defining TBBPA as an inhibitor of ES activity, thus providing further support that the proposed MoA occurs under conditions of high dose, chronic TBBPA administration to Wistar Han rats. Given that the uterine tumors observed in rats (250-1000 mg/kg-day) only occur at very high doses that perturb homeostatic control, it is unlikely such effects would occur in humans given that current TBBPA exposure levels are approximately eight orders of magnitude lower than these doses that are associated with exceeding the capacity of conjugation pathways in animal studies.
Keywords: Estrogen sulfotransferases; Glucuronidation; Liver; TBBPA; Uterus.
Figures

Similar articles
-
A high dose mode of action for tetrabromobisphenol A-induced uterine adenocarcinomas in Wistar Han rats: A critical evaluation of key events in an adverse outcome pathway framework.Regul Toxicol Pharmacol. 2016 Jun;77:143-59. doi: 10.1016/j.yrtph.2016.01.018. Epub 2016 Jan 28. Regul Toxicol Pharmacol. 2016. PMID: 26828025 Review.
-
TITLE Disposition and kinetics of Tetrabromobisphenol A in female Wistar Han rats.Toxicol Rep. 2014;1:214-223. doi: 10.1016/j.toxrep.2014.03.005. Toxicol Rep. 2014. PMID: 24977115 Free PMC article.
-
Disruption of estrogen homeostasis as a mechanism for uterine toxicity in Wistar Han rats treated with tetrabromobisphenol A.Toxicol Appl Pharmacol. 2016 May 1;298:31-9. doi: 10.1016/j.taap.2016.03.007. Epub 2016 Mar 15. Toxicol Appl Pharmacol. 2016. PMID: 26988606 Free PMC article.
-
Toxicokinetics of tetrabromobisphenol a in humans and rats after oral administration.Toxicol Sci. 2006 May;91(1):49-58. doi: 10.1093/toxsci/kfj132. Epub 2006 Feb 15. Toxicol Sci. 2006. PMID: 16481339
-
Environmental chemical exposure may contribute to uterine cancer development: studies with tetrabromobisphenol A.Toxicol Pathol. 2015 Jun;43(4):464-73. doi: 10.1177/0192623314557335. Epub 2014 Dec 4. Toxicol Pathol. 2015. PMID: 25476797 Free PMC article. Review.
Cited by
-
Recent Review on Selected Xenobiotics and Their Impacts on Gut Microbiome and Metabolome.Trends Analyt Chem. 2023 Sep;166:117155. doi: 10.1016/j.trac.2023.117155. Epub 2023 Jun 28. Trends Analyt Chem. 2023. PMID: 37484879 Free PMC article.
-
Update of the scientific opinion on tetrabromobisphenol A (TBBPA) and its derivatives in food.EFSA J. 2024 Jul 15;22(7):e8859. doi: 10.2903/j.efsa.2024.8859. eCollection 2024 Jul. EFSA J. 2024. PMID: 39010865 Free PMC article.
-
Influence of Tetrabromobisphenol A, with or without Concurrent Triclosan, upon Bisphenol A and Estradiol Concentrations in Mice.Environ Health Perspect. 2017 Aug 21;125(8):087014. doi: 10.1289/EHP1329. Environ Health Perspect. 2017. PMID: 28886593 Free PMC article.
-
Thyroid-disrupting chemicals and brain development: an update.Endocr Connect. 2018 Apr;7(4):R160-R186. doi: 10.1530/EC-18-0029. Epub 2018 Mar 23. Endocr Connect. 2018. PMID: 29572405 Free PMC article. Review.
-
Opportunities and challenges related to saturation of toxicokinetic processes: Implications for risk assessment.Regul Toxicol Pharmacol. 2021 Dec;127:105070. doi: 10.1016/j.yrtph.2021.105070. Epub 2021 Oct 28. Regul Toxicol Pharmacol. 2021. PMID: 34718074 Free PMC article.
References
-
- Blom M.J., Wassink M.G., Kloosterboer H.J., Ederveen A.G., Lambert J.G., Goos H.J. Metabolism of estradiol, ethynylestradiol, and moxestrol in rat uterus, vagina, and aorta: influence of sex steroid treatment. Drug Metab. Dispos. 2001;29:76–81. - PubMed
-
- Bromine Science and Environmental forum (BSEF) Bromine Science and Environmental forum; 2012. TBBPA Factsheet Brominated Flame Retardant In Tetrabromobisphenol A for Printed Circuit Boards and ABS Plastics.http://www.bsef.com
-
- Colnot T., Kacew S., Dekant W. Mammalian toxicology and human exposures to the flame retardant 2,2′,6,6′-tetrabromo-4,4′-isopropylidenediphenol (TBBPA): implications for risk assessment. Arch. Toxicol. 2014;88(3):553–573. - PubMed
-
- Coughtrie M.W.H. Sulfation through the looking glass-recent advances in sulfotransferase research for the curious. Pharmacogenomics J. 2002;2:297–308. - PubMed
-
- Dunn R.T., Klaassen C.D. Tissue-specific expression of rat sulfotransferase messenger RNAs. Drug Metab. Dispos. 1998;26:598–604. - PubMed
LinkOut - more resources
Full Text Sources
Other Literature Sources
