. 2017 Sep 28;549(7673):523-527.
doi: 10.1038/nature24016. Epub 2017 Sep 20.

ApoE4 markedly exacerbates tau-mediated neurodegeneration in a mouse model of tauopathy

Affiliations

ApoE4 markedly exacerbates tau-mediated neurodegeneration in a mouse model of tauopathy

Yang Shi et al. Nature. .

Abstract

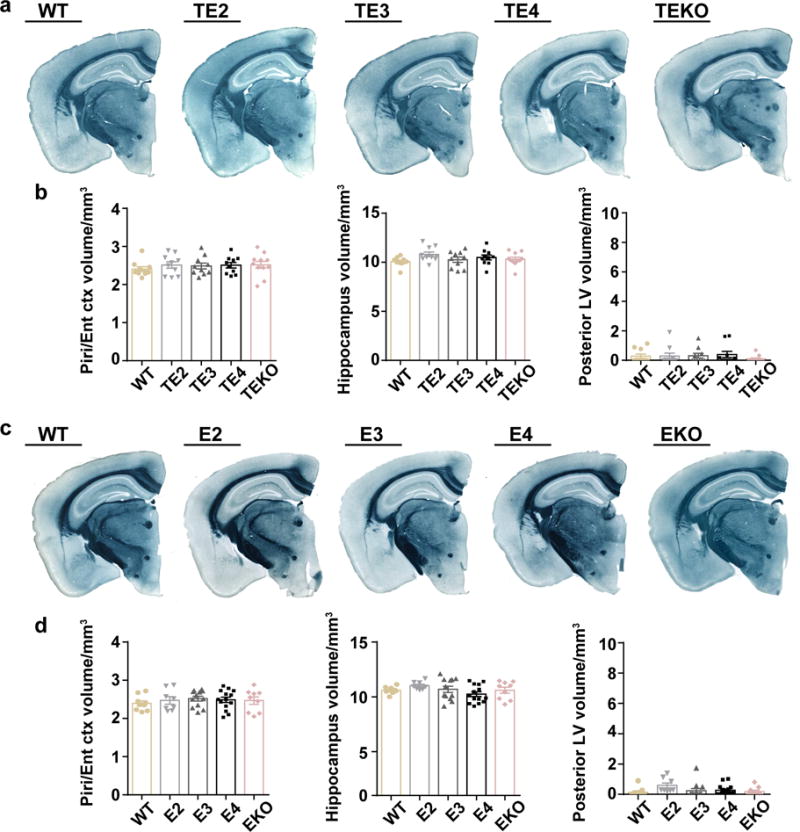
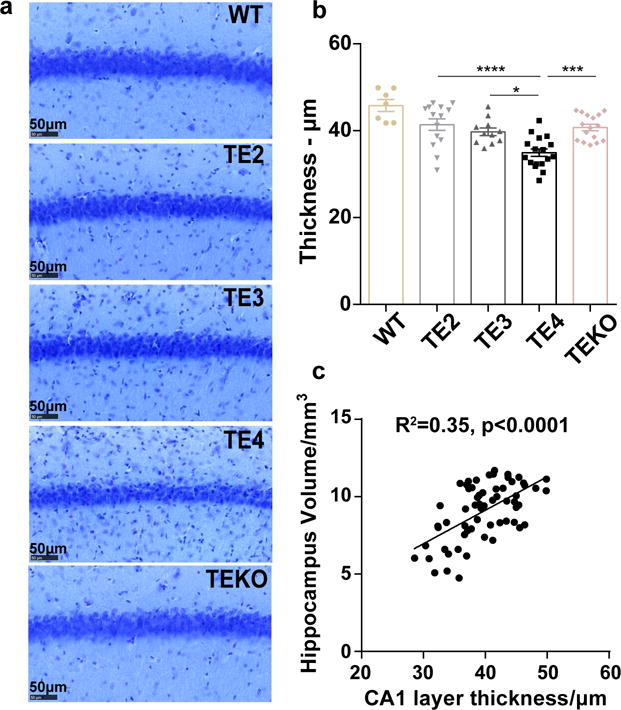
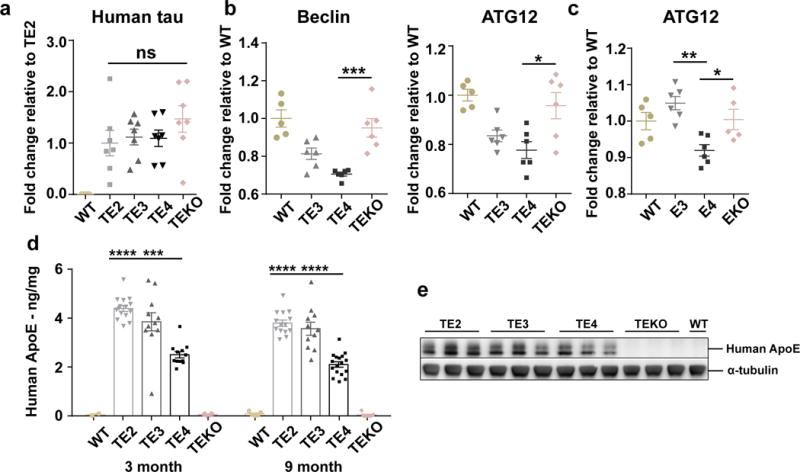
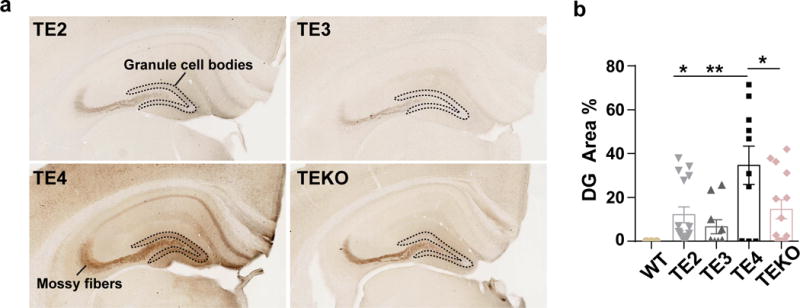
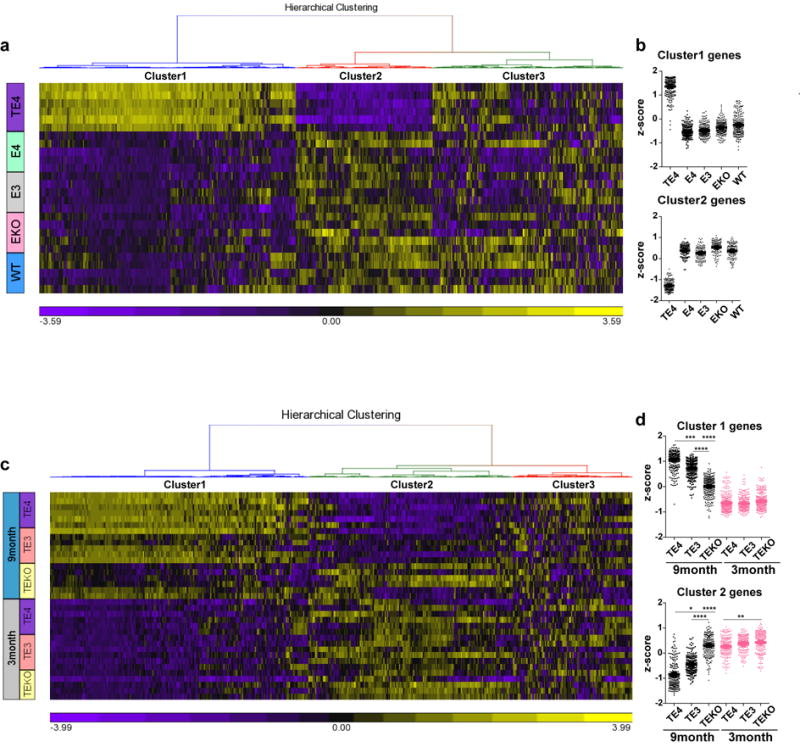
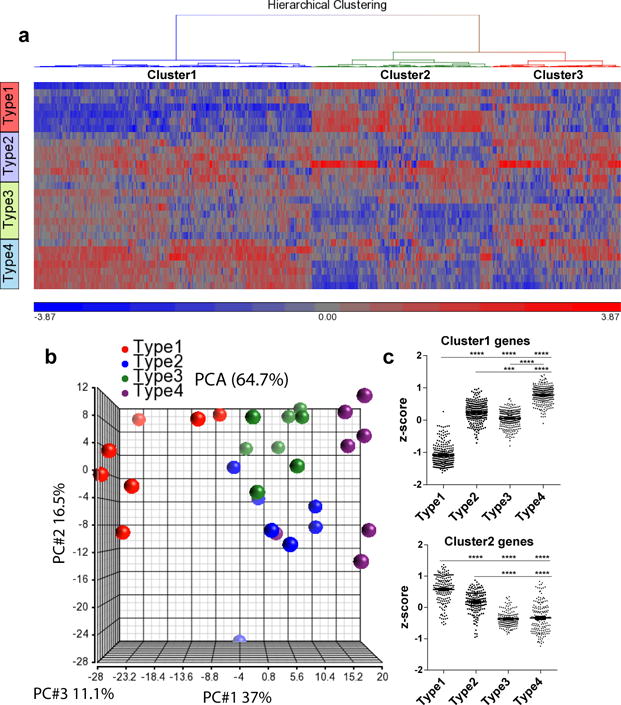
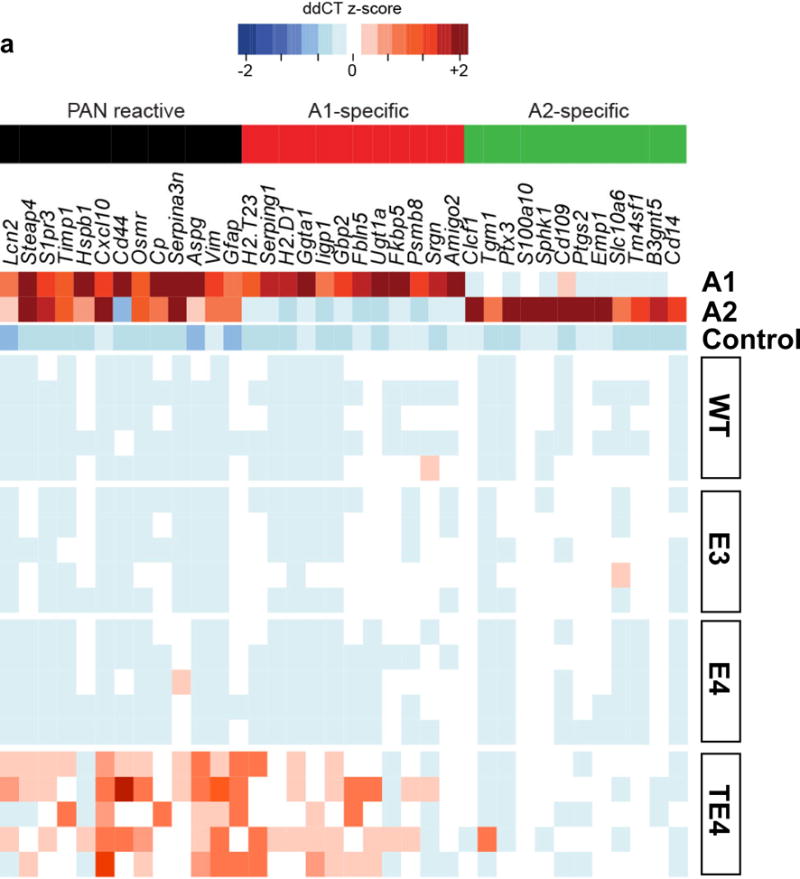
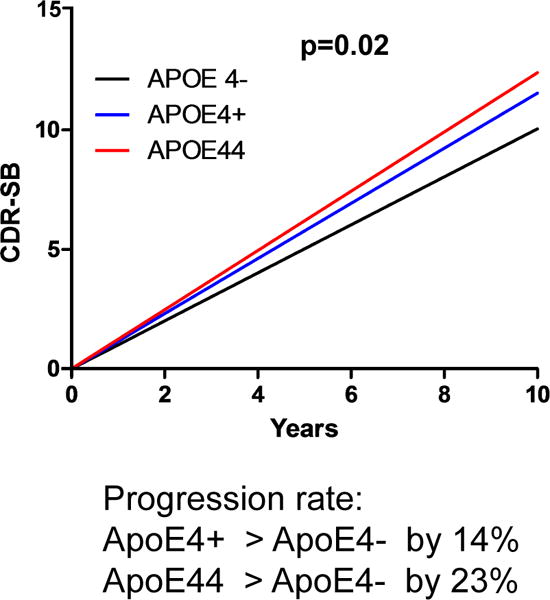
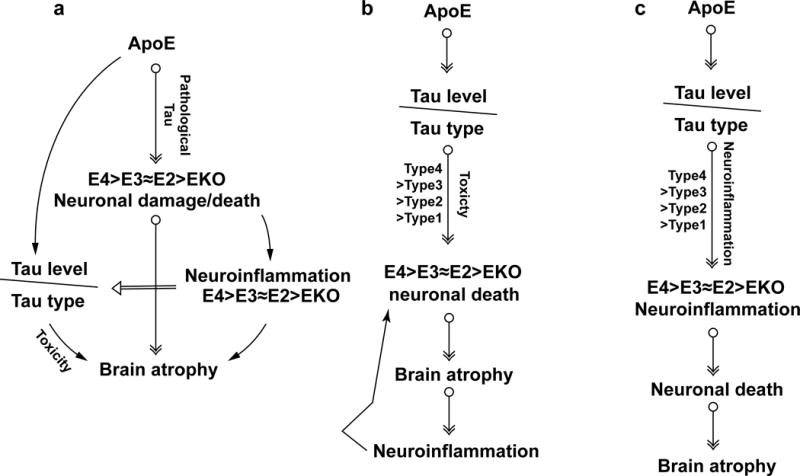
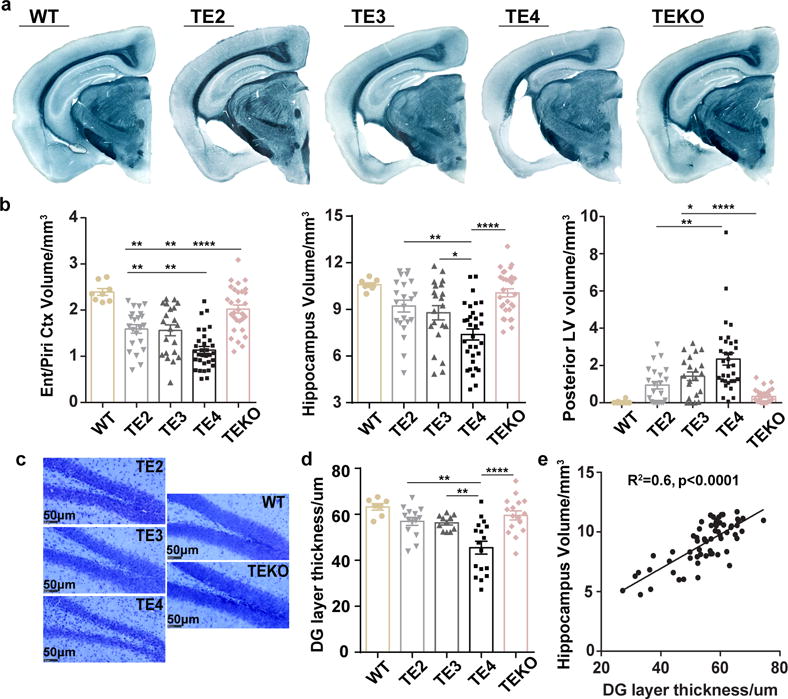
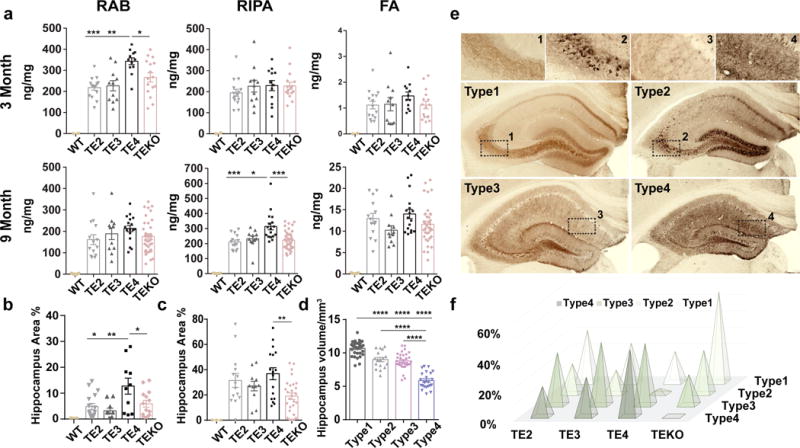
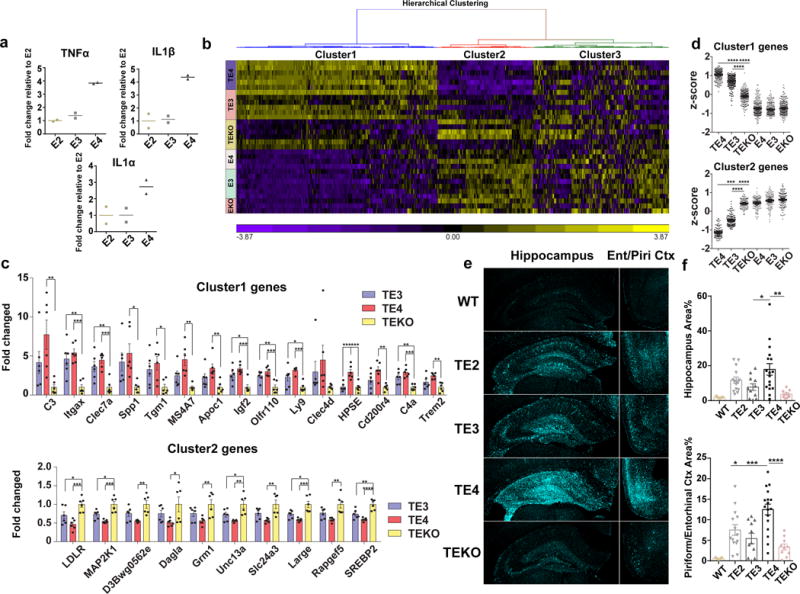
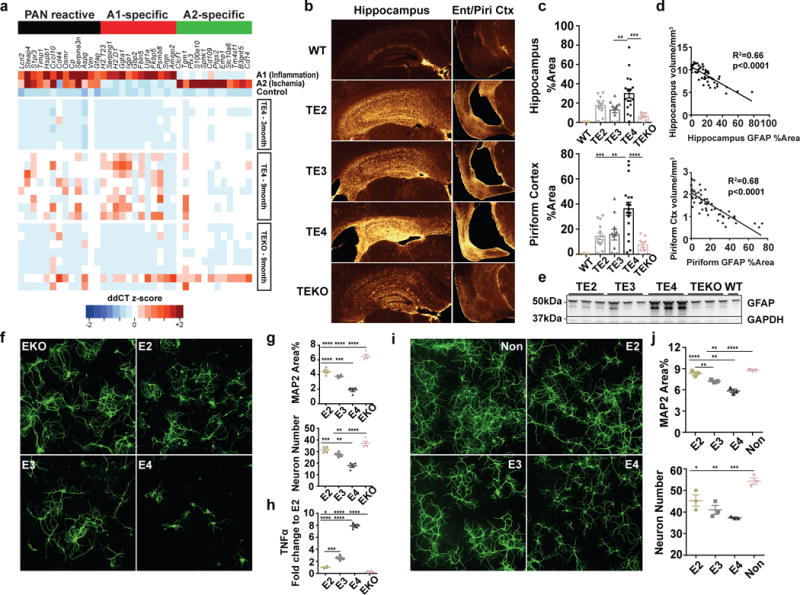
APOE4 is the strongest genetic risk factor for late-onset Alzheimer disease. ApoE4 increases brain amyloid-β pathology relative to other ApoE isoforms. However, whether APOE independently influences tau pathology, the other major proteinopathy of Alzheimer disease and other tauopathies, or tau-mediated neurodegeneration, is not clear. By generating P301S tau transgenic mice on either a human ApoE knock-in (KI) or ApoE knockout (KO) background, here we show that P301S/E4 mice have significantly higher tau levels in the brain and a greater extent of somatodendritic tau redistribution by three months of age compared with P301S/E2, P301S/E3, and P301S/EKO mice. By nine months of age, P301S mice with different ApoE genotypes display distinct phosphorylated tau protein (p-tau) staining patterns. P301S/E4 mice develop markedly more brain atrophy and neuroinflammation than P301S/E2 and P301S/E3 mice, whereas P301S/EKO mice are largely protected from these changes. In vitro, E4-expressing microglia exhibit higher innate immune reactivity after lipopolysaccharide treatment. Co-culturing P301S tau-expressing neurons with E4-expressing mixed glia results in a significantly higher level of tumour-necrosis factor-α (TNF-α) secretion and markedly reduced neuronal viability compared with neuron/E2 and neuron/E3 co-cultures. Neurons co-cultured with EKO glia showed the greatest viability with the lowest level of secreted TNF-α. Treatment of P301S neurons with recombinant ApoE (E2, E3, E4) also leads to some neuronal damage and death compared with the absence of ApoE, with ApoE4 exacerbating the effect. In individuals with a sporadic primary tauopathy, the presence of an ε4 allele is associated with more severe regional neurodegeneration. In individuals who are positive for amyloid-β pathology with symptomatic Alzheimer disease who usually have tau pathology, ε4-carriers demonstrate greater rates of disease progression. Our results demonstrate that ApoE affects tau pathogenesis, neuroinflammation, and tau-mediated neurodegeneration independently of amyloid-β pathology. ApoE4 exerts a 'toxic' gain of function whereas the absence of ApoE is protective.


Figures

Extended Data Figure 1
Extended Data Figure 1. No brain atrophy or brain volume differences in 3-month old TE mice or 9-month old non-tau transgenic mice
a, Representative images of 3-month old TE mouse brains (WT: n=10, TE2: n=10, TE3: n=10, TE4: n=10, TEKO: n=11) b, Quantification of the piriform/entorhinal cortex, hippocampus, posterior lateral ventricle volume in 3-month old TE mice. c, Representative images of 9-month old non-tau transgenic mouse brains (WT: n=9, E2: n=8, E3: n=12, E4: n=14, EKO: n=9). d, Quantification of the piriform/entorhinal cortex, hippocampus, posterior lateral ventricle volume in 9-month old non-tau transgenic mice. Data expressed as mean ± SEM, One-way ANOVA with Tukey’s post hoc test (two-sided) was used for statistical analysis. Kruskal-Wallis test with Dunn’s multiple comparisons test was performed for posterior LV volume analysis.
Extended Data Figure 2
Extended Data Figure 2. ApoE4 leads to more severe neuronal loss in the CA1 region of hippocampus in 9-month old P301S mice
a, Representative images of 9-month old TE mouse brain stained with cresyl violet. b, Thickness of the CA1 pyramidal neuronal layer (WT: n=7, TE2: n=14, TE3: n=11, TE4: n=17, TEKO: n=16). Data expressed as mean ± SEM, One-way ANOVA with Tukey’s post hoc test (two-sided). c, Correlation between CA1 neuronal layer thickness and hippocampal volume. N=62 biologically independent animals. Pearson correlation analysis (two-sided), p<0.0001, r2=0.35. *p<0.05, **p<0.01, ***p<0.001, ****p<0.0001.
Extended Data Figure 3
Extended Data Figure 3. Elevated tau level in TE4 mice is not due to tau synthesis differences, and is likely caused by impairment of autophagy-mediated tau clearance
a, qPCR result for human tau in 9month TE mouse cortex (WT: n=5, TE2, TE3, TE4, TEKO: n=7). b, c Nanostring analysis for autophagy-related gene expression in (b) 9-month old TE mouse hippocampus and (c) 9-month old non-tau transgenic ApoEKI or ApoEKO mouse hippocampus (n=5–6 per group). d, Human ApoE levels in the RAB fraction of 3-month (WT: n=2, TE2: n=15, TE3: n=11, TE4: n=12, TEKO: n=6) and 9-month (WT: n=5, TE2: n=14, TE3: n=11, TE4: n=17, TEKO: n=7) old TE mouse brain lysates were measured by ELISA. e, Nine-month old TE mouse cortex was lysed in RIPA buffer without fractionation and total ApoE level was assessed by western blot (n=3). For gel source data, see Supplementary Figure 2. Data expressed as mean ± SEM, One-way ANOVA with Tukey’s post hoc test (two-sided) was used for statistical analysis. *p<0.05, **p<0.01, ***p<0.001, ****p<0.0001.
Extended Data Figure 4
Extended Data Figure 4. ApoE4 promotes pathological tau redistribution from axons to cell bodies at an early age
a, AT8 staining for 3-month old TE mouse hippocampus. Dotted outline surrounds the dentate gyrus (DG) granule cell bodies. b, Quantification of AT8 covered area in the DG cell body region (TE2: n=16, TE3: n=10, TE4: n=10, TEKO: n=14). Data expressed as mean ± SEM, One-way ANOVA with Tukey’s post hoc test (two-sided). *p<0.05, **p<0.01, ***p<0.001, ****p<0.0001.
Extended Data Figure 5
Extended Data Figure 5. No or minimal change of microglial gene expression in 3-month old TE mice or 9-month old non-tau transgenic mice despite significant changes in 9-month old TE mice
a, Nanostring analysis for microglial gene expression in 9-month old TE4 mice and 9-month old non-tau transgenic mice (n=5–6). Heatmap generated by hierarchical gene clustering based on genotypes (Horizontal: 534 microglial genes, vertical: individual mouse samples) b, Z-score of genes from cluster 1 or cluster 2 category. c, Nanostring analysis for microglial gene expression in 9-month and 3-month old TE mice (n=5–6). d, Z-score of genes from cluster 1 or cluster 2 category. Kruskal-Wallis test with Dunn’s multiple comparisons test was performed for statistical analysis. Data expressed as mean ± SEM. *p<0.05, **p<0.01, ***p<0.001, ****p<0.0001.
Extended Data Figure 6
Extended Data Figure 6. P-tau staining patterns are associated with distinct microglial activation profiles
a, Heatmap generated by hierarchical gene clustering based on p-tau staining types for 9-month old TE mice (n=7–8). b. Principle components analysis (PCA) of microglial gene expression profile for p-tau staining types. c. Z-score of genes from cluster 1 or cluster 2 category. Kruskal-Wallis test with Dunn’s multiple comparisons test was performed for statistical analysis. Data expressed as mean ± SEM. *p<0.05, **p<0.01, ***p<0.001, ****p<0.0001.
Extended Data Figure 7
Extended Data Figure 7. No activation of A1 astrocytic genes in 9-month old non-tau transgenic mice
a, Microfluidic RT-qPCR for activated astrocytic genes in 9-month old TE4 mice and 9-month old non-tau transgenic WT and human ApoE KI mice (n=5). A1-specific: genes activated only by LPS; A2-specific: genes activated only by ischemia; PAN reactive: genes activated by either LPS or ischemia.
Extended Data Figure 8
Extended Data Figure 8. Possession of ε4 allele accelerates the rate of disease progression in AD patients
Disease progression rate in a cohort of 592 CSF biomarker confirmed individuals with symptomatic AD from two different longitudinal studies, the Knight Alzheimer’s Disease Research Center (ADRC) at Washington University and the Alzheimer’s Disease Neuroimaging Initiative (ADNI). Data generated based on the Clinical Dementia Rating Sum of Boxes (CDR-SB) scores. Possession of the ε4 allele significantly accelerated disease progression (p=0.02), with one ε4 allele increasing progression rate by 14% and two ε4 alleles increasing the rate by 23% compared to non-carriers (lineal mixed model, two-sided).
Extended Data Figure 9
Extended Data Figure 9. Schematic summary of hypotheses
a, ApoE is essential for neuronal death under pathological conditions. With pathological tau accumulation, the presence of ApoE, especially ApoE4, renders the neurons more susceptible to degeneration, whereas the absence of ApoE protects neurons from death, resulting in neurodegeneration (E4>E3≈E2>>EKO). Degenerating neurons further induce neuroinflammation, which is augmented by ApoE4 due to its inherent higher innate immune reactivity, thereby exacerbating neurodegeneration furthermore. Neuroinflammation may concomitantly affect tau pathology, resulting in various p-tau staining types that could also contribute to neurodegeneration. b, ApoE affects tau pathogenesis, resulting in different p-tau patterns, which may possess distinct neurotoxicity (type4>type3≈type2>type1), leading to different levels of neuronal death and brain atrophy (E4>E3≈E2>>EKO). Neuroinflammation accompanying neurodegeneration will in turn exacerbate neuronal death. c, ApoE affects tau pathogenesis, resulting in different p-tau patterns that may have different capacities to induce neuroinflammation (type4>type3≈type2>type1), which eventually leads to various degrees of neurodegeneration.
Figure 1
Figure 1. ApoE4 exacerbates neurodegeneration in P301S mice whereas genetic ablation of ApoE is associated with less damage
a, Representative images of 9-month old wild type (WT) and TE mouse brain sections stained with Sudan black b, Volumes of the piriform/entorhinal cortex, hippocampus, and posterior lateral ventricle in 9–10 months old WT and TE mice (WT: n=8, TE2: n=22, TE3: n=21, TE4: n=32, TEKO: n=30). c, d, Thickness of the granule cell layer of the dentate gyrus in 9-month old WT and TE mice with cresyl violet staining (WT: n=7, TE2: n=14, TE3: n=11, TE4: n=17, TEKO: n=16). e, Correlation between granule layer thickness and hippocampal volume, n=62 biologically independent animals. Pearson correlation analysis, r2=0.6, p<0.0001 (two sided). Data expressed as mean ± SEM, One-way ANOVA with Tukey’s post hoc test (two-sided) was used for all statistical analyses except Kruskal-Wallis test with Dunn’s multiple comparisons test (two-sided) was performed for posterior LV volume analysis. *p<0.05, **p<0.01, ***p<0.001, ****p<0.0001. Ent: Entorhinal cortex, Piri: Piriform cortex, LV: Lateral ventricle, DG: Dentate gyrus.
Figure 2
Figure 2. ApoE genotypes differentially regulate tau pathology
a, Human P301S tau levels in TE mice were measured by ELISA in RAB, RIPA and 70% FA fractions respectively at two time points: 3 months (WT: n=2, TE2: n=15, TE3: n=11, TE4: n=12, TEKO: n=16) and 9 months (WT: n=5, TE2: n=14, TE3: n=11, TE4: n=17, TEKO: n=38). b, P-tau (AT8) covered area in 3-month and 9-month old TE mouse hippocampus. c, P-tau staining patterns were associated with different degrees of brain atrophy, n=104 biologically independent animals. a–c, Data expressed as mean ± SEM, One-way ANOVA with Tukey’s post hoc test (two-sided). d, Four distinct p-tau staining patterns were identified based on hippocampal staining features. Type 1 has intense mossy fiber staining as well as diffuse cell body staining in the dentate gyrus granule cell layer and CA1 pyramidal cell layer; type 2 has compact and dense tangle-like cell body staining primarily in the dentate gyrus granule cells and CA3 pyramidal cells, but also has sparse staining in the CA1 region; type 3 has staining primarily in the neuropil of the stratum radiatum of the CA region with clear staining of dendrites from pyramidal neurons and only some staining in the neuronal cell bodies; type 4 has dense staining over the entire hippocampus, unlike other staining patterns, type 4 staining is fragmented, dotted, and grainy. e, Distribution of the four p-tau staining types in 9–10 months old TE mice (TE2: n=22, TE3: n=21, TE4: n=32, TEKO: n=38). Fisher’s exact test, two-sided (All groups: p=3.4e-05, TE2 vs. TEKO: p=0.021, TE3 vs. TEKO: p=0.0016, TE4 vs. TEKO: p=1.9e-07). *p<0.05, **p<0.01, ***p<0.001, ****p<0.0001.
Figure 3
Figure 3. ApoE strongly modulates microglial activation
a, Cultured microglia (E2, E3, E4) derived from human ApoE KI mouse brains were treated with 1 ng/ml LPS for 24h, cytokine levels in the media were measured by ELISA (2 wells/genotype), experiment replicated 3 times. b, Nanostring analysis for microglial gene expression in 9-month old TE or EKI/EKO mouse hippocampus. Heatmap generated by hierarchical gene clustering based on genotypes (Horizontal: 534 microglial genes, vertical: individual mouse samples; TE3, TE4, TEKO, E3: n=6, E4: n=4, EKO: n=3). c, Top differentially expressed cluster1 and cluster2 genes from the heatmap (criteria: fold change TE4 vs. TEKO high to low, p-value <0.01; fold change TE4 vs. TE3>1.2). Cluster1: proinflammatory genes, Cluster2: cellular function-related genes (metabolism, signaling, transcription, etc.), Cluster3: homeostatic genes/genes below detection. d, z-score of genes from cluster 1 or cluster 2 for all groups. Kruskal-Wallis test with Dunn’s multiple comparisons test (two-sided) was performed for statistical analysis. e, f, CD68 (activated microglia) staining and quantification in 9-month old TE mice (WT: n=5, TE2: n=14, TE3: n=11, TE4: n=17, TEKO: n=10). Data expressed as mean ± SEM, One-way ANOVA with Tukey’s post hoc test, two-sided. *p<0.05, **p<0.01, ***p<0.001, ****p<0.0001.
Figure 4
Figure 4. ApoE4 leads to robust astrocytic activation and promotes neuronal death in vitro whereas the absence of ApoE results in less astrocytic activation and preserves neuronal integrity
a, Microfluidic RT-qPCR for activated astrocytic genes in 9-month old TE4 (n=8), TEKO (n=8), and 3-month old TE4 mice (n=6). A1-specific: genes activated only by LPS; A2-specific: genes activated only by ischemia; PAN reactive: genes activated by either LPS or ischemia. b, GFAP staining in 9-month old TE mice (WT: n=5, TE2: n=14, TE3: n=11, TE4 n=17, TEKO: n=10). c, Quantification of area covered by GFAP IR. d, Correlation between GFAP IR and brain volume. N=57 biologically independent animals. Pearson correlation analysis (two-sided). Hippocampus: r2=0.66, p<0.0001; Piriform cortex: r2=0.68, p<0.0001. e, Western blot for GFAP in 9-month old TE mice (n=3). For gel source data, see Supplementary Figure 1. f, Representative images of primary WT neurons infected with AAV2/8-synapsin-P301S human tau co-cultured with mixed glia cells (80–90% astrocyte, 10–20% microglia) derived from human ApoE KI (E2, E3, E4) and ApoE KO mouse brain for 3 weeks. Experiment replicated 5 times g, Quantification of neuron number and area covered by MAP2 IR for co-cultured neurons (4 wells/genotype, 8 random images taken/well). h, TNFα level in the co-culture medium measured by ELISA. i, Representative images of primary WT neurons infected with AAV2/8-synapsin-P301S human tau treated with 10μg/ml recombinant human ApoE for 3 weeks. Experiment replicated twice. j, Quantification of neuron number and area covered by MAP2 staining for ApoE-treated neurons (3 wells/treatment, 8 random images/well). Data expressed as mean ± SEM, One-way ANOVA with Tukey’s post hoc test, two-sided. *p<0.05, **p<0.01, ***p<0.001, ****p<0.0001.

Comment in

References

    1. Holtzman DM, Herz J, Bu G. Apolipoprotein E and apolipoprotein E receptors: normal biology and roles in Alzheimer disease. Cold Spring Harbor perspectives in medicine. 2012;2 doi: 10.1101/cshperspect.a006312. - DOI - PMC - PubMed
    1. Strittmatter WJ, et al. Apolipoprotein E: high-avidity binding to beta-amyloid and increased frequency of type 4 allele in late-onset familial Alzheimer disease. Proceedings of the National Academy of Sciences of the United States of America. 1993;90:1977–1981. doi: 10.1073/pnas.90.5.1977. - DOI - PMC - PubMed
    1. Josephs KA, et al. β-Amyloid Burden Is Not Associated with Rates of Brain Atrophy. Annals of Neurology. 2008;63:204–212. doi: 10.1002/ana.21223. - DOI - PMC - PubMed
    1. Arriagada PV, Growdon JH, Hedleywhyte ET, Hyman BT. Neurofibrillary Tangles But Not Senile Plaques Parallel Duration and Severity of Alzheimers-Disease. Neurology. 1992;42:631–639. doi: 10.1212/WNL.42.3.631. - DOI - PubMed
    1. Williams DR, et al. Pathological tau burden and distribution distinguishes progressive supranuclear palsy-parkinsonism from Richardson’s syndrome. Brain. 2007;130:1566–1576. doi: 10.1093/brain/awm104. - DOI - PubMed

Publication types

MeSH terms