. 2017 Sep 28;549(7673):543-547.
doi: 10.1038/nature23891. Epub 2017 Sep 20.

Epigenetic restriction of extraembryonic lineages mirrors the somatic transition to cancer

Affiliations

Epigenetic restriction of extraembryonic lineages mirrors the somatic transition to cancer

Zachary D Smith et al. Nature. .

Abstract

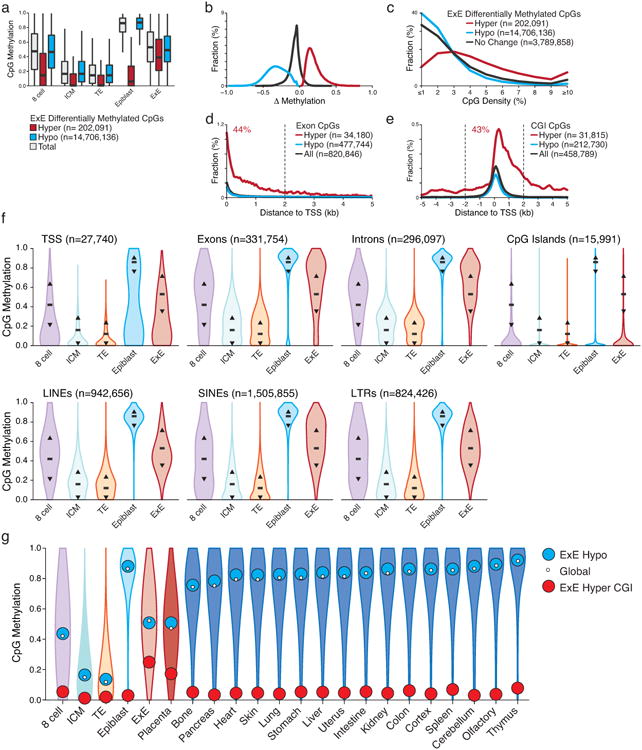
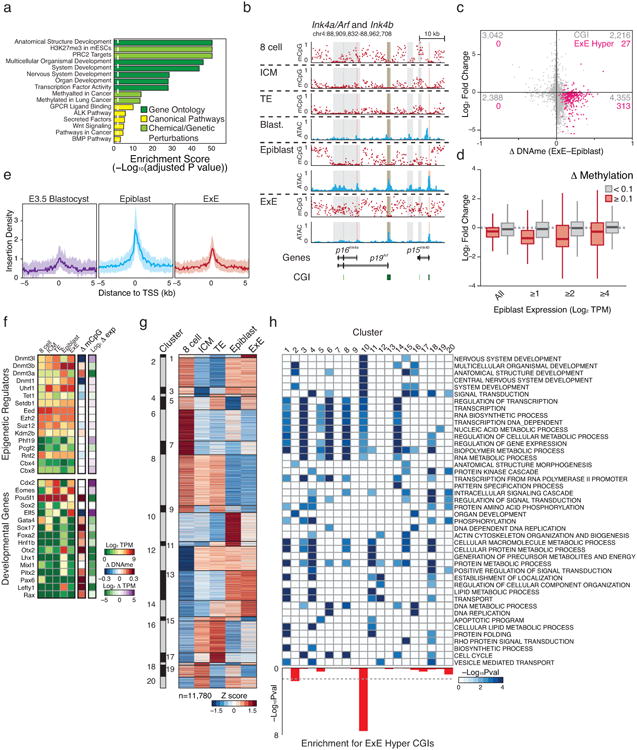
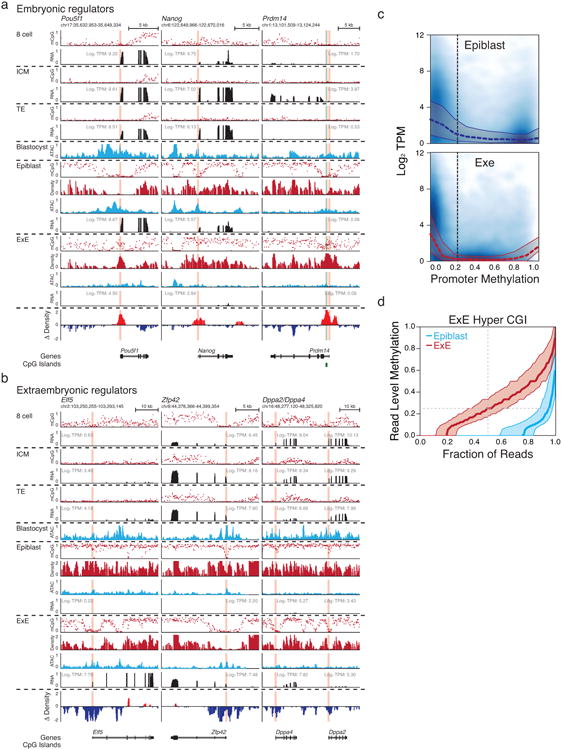
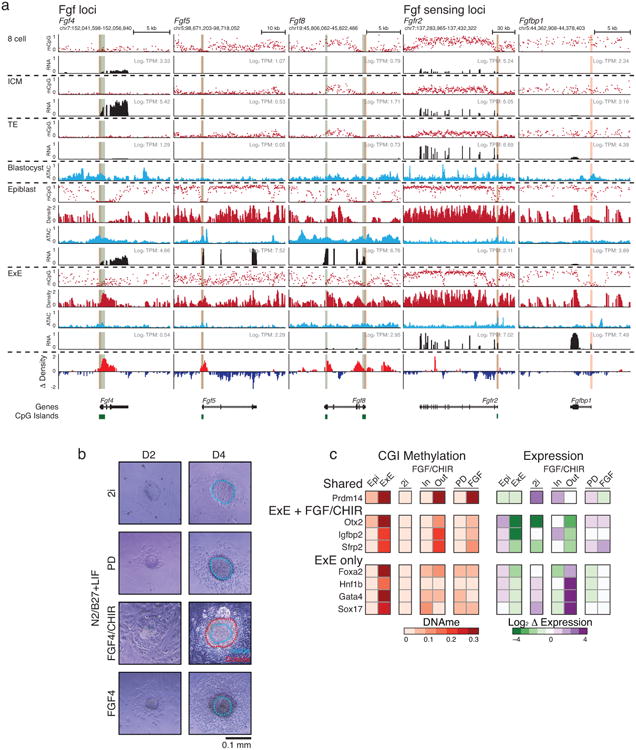
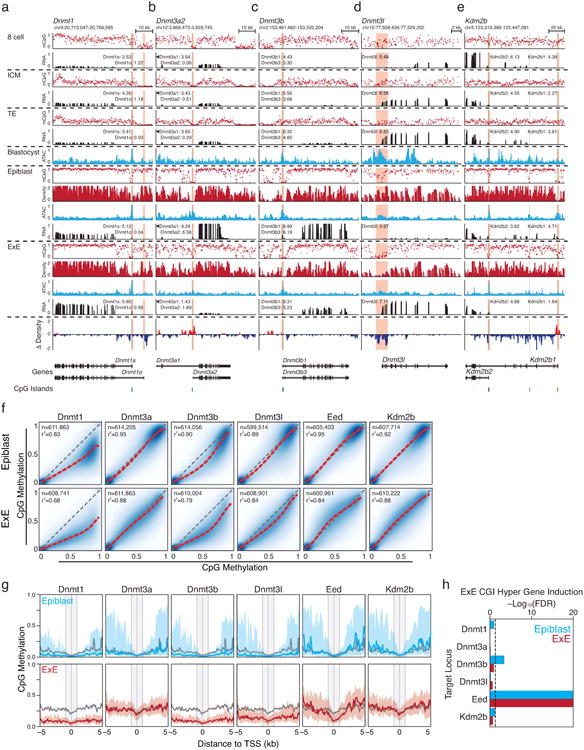
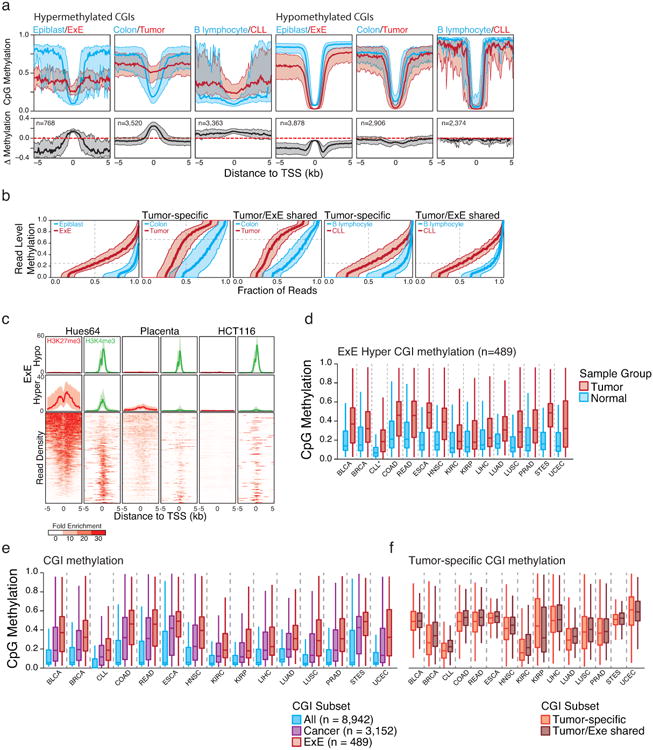
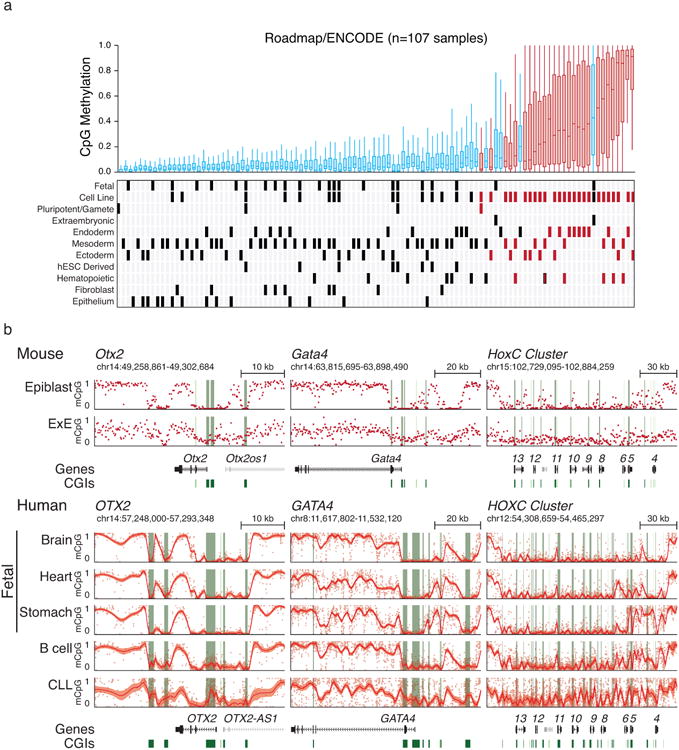
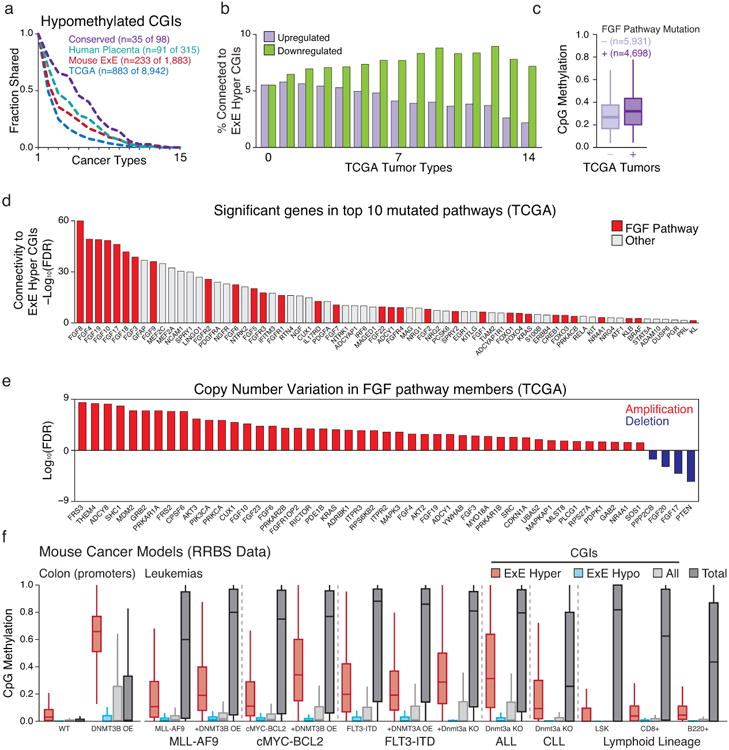
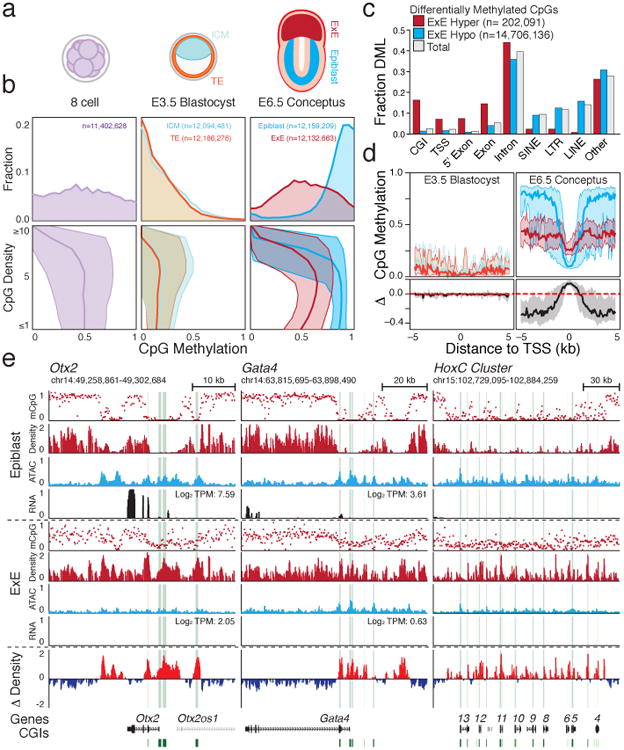
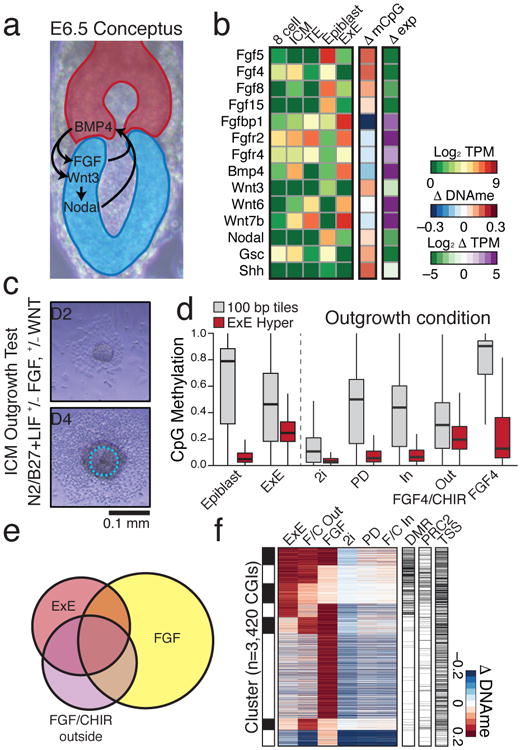
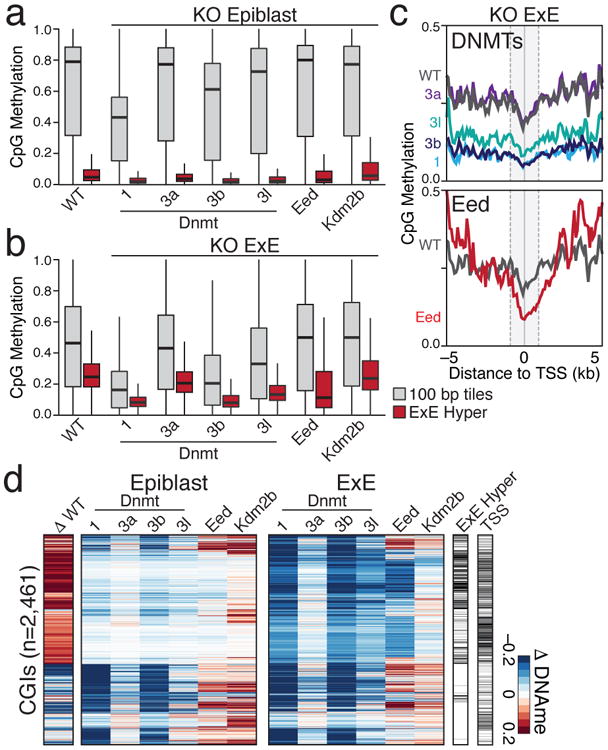
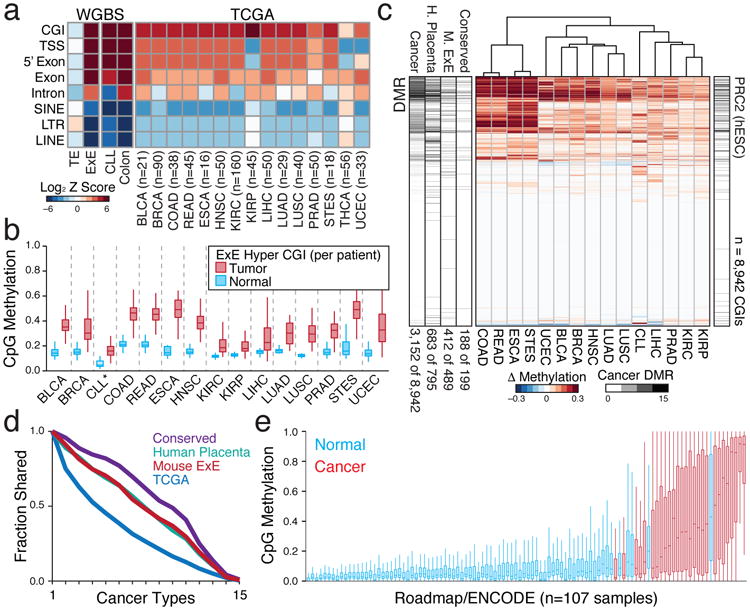
In mammals, the canonical somatic DNA methylation landscape is established upon specification of the embryo proper and subsequently disrupted within many cancer types. However, the underlying mechanisms that direct this genome-scale transformation remain elusive, with no clear model for its systematic acquisition or potential developmental utility. Here, we analysed global remethylation from the mouse preimplantation embryo into the early epiblast and extraembryonic ectoderm. We show that these two states acquire highly divergent genomic distributions with substantial disruption of bimodal, CpG density-dependent methylation in the placental progenitor. The extraembryonic epigenome includes specific de novo methylation at hundreds of embryonically protected CpG island promoters, particularly those that are associated with key developmental regulators and are orthologously methylated across most human cancer types. Our data suggest that the evolutionary innovation of extraembryonic tissues may have required co-option of DNA methylation-based suppression as an alternative to regulation by Polycomb-group proteins, which coordinate embryonic germ-layer formation in response to extraembryonic cues. Moreover, we establish that this decision is made deterministically, downstream of promiscuously used-and frequently oncogenic-signalling pathways, via a novel combination of epigenetic cofactors. Methylation of developmental gene promoters during tumorigenesis may therefore reflect the misappropriation of an innate trajectory and the spontaneous reacquisition of a latent, developmentally encoded epigenetic landscape.


Figures

Extended Data Figure 1
Extended Data Figure 1. Tracking divergence in DNA methylation landscapes during mouse implantation
a-f. Sequencing metrics and coverage information for WGBS, RNA-seq, and ATAC-seq data including hierarchical clustering and Pearson correlation for CpGs, genes, and gene promoters, respectively. WGBS data also includes Euclidean distance, which can be beneficial for examining sample similarity in globally hypomethylated samples, as well as similarity scores for 100 bp tiles, which locally merge the intrinsically higher variance of intermediately methylated CpGs to reduce noise. For RNA-seq and ATAC-seq data, biological replicates cluster together, as do 8 cell and post-implantation WGBS data, while tissues of the E3.5 blastocyst cluster together but not as discrete ICM and TE compartments. In general, there is minimal variation between the methylation status of the ICM and TE, with only slight global deviations around the minimal global value that is reached during this developmental period. g. Isolation of the Epiblast and Extraembryonic Ectoderm (E×E) from the E6.5 post-implantation embryo. The conceptus is first removed from maternal decidual tissue and portioned into Epiblast and E×E fractions, taking care to remove the apical Ectoplacental Cone (EPC). Then, outer visceral endoderm and trophoblast cells are enzymatically digested and mechanically removed using a thin glass capillary.
Extended Data Figure 2
Extended Data Figure 2. Unique features of the extraembryonic methylation landscape
a. CpG methylation boxplots for all covered CpGs (gray) as well as those that are significantly hyper (red) or hypo (blue) methylated within E×E compared to Epiblast. E×E-hypomethylated CpGs largely reflect differential remethylation compared to Epiblast across the genome. Alternatively, E×E hypermethylated CpGs are mostly unmethylated in ICM and TE and remain so in Epiblast, indicating an E×E-specific mechanism. Edges refer to the 25th and 75th percentiles, and whiskers the 2.5th and 97.5th percentiles, respectively. b. Distribution of significantly hypermethylated and hypomethylated CpGs between E×E and Epiblast (E×E hyper and E×E hypo, respectively). Hypomethylation appears to be a global feature of the E×E and deviates from a default hypermethylated state in the Epiblast. Alternatively, increased DNA methylation appears to be directed focally and de novo at regions that are hypomethylated within the Epiblast and subsequent embryonic and adult somatic tissues. c. Alternate CpG density distributions for E×E hypomethylated and hypermethylated CpGs indicate differential enrichment within distinct genomic features. While E×E hypomethylated CpGs resemble the global average, hypermethylated CpGs occur within higher CpG densities. d. The fraction dynamically methylated CpGs that fall within annotated exons as a function of distance to their assigned transcription start site (TSS). 44% of exonal E×E hypermethylated CpGs fall within 2 kb of their associated TSS. e. The fraction of dynamically methylated CpGs that fall within annotated CpG islands based upon their proximity to the nearest TSS. E×E hypermethylated CpGs are generally TSS proximal and skew downstream of the TSS, with 43% falling within + or – 2 kb. f. DNA methylation distribution for different genomic features including those associated with genic (TSS, Exon, Intron and CGI) and repetitive (LINE, SINE, and LTR) sequences. For reference, black bar and arrows highlight the global median and 25th/75th percentiles. Globally, all features exhibit the expected passage through minimal DNA methylation values within the ICM and TE of the E3.5 blastocyst prior to remethylation at implantation. Compared to its global distribution, E×E exhibits higher levels of de novo methylation within Exons and Introns, and lower than global levels within regions of LINE and LTR retrotransposon origin. The Epiblast exhibits nearly complete hyper or hypomethylation depending on the genomic feature, and is bimodal at TSSs, which frequently contain CGIs. N's refer to the number of annotated features of a given type. g. Violin plots of 100 bp methylation data for early embryonic, placental, and adult tissues demonstrate general epigenetic retention of either the somatic Epiblast or extraembryonic E×E architecture throughout subsequent development. White dot highlights the global median, while blue and red reflect the median of E×E-hypomethylated tiles and E×E hyper CGIs, respectively. Notably, extraembryonic placenta largely preserve the hypomethylated global landscape and targeted methylation of otherwise canonically hypomethylated CGI promoters after they are established by E6.5. We show tiles and islands for E×E-specific hypomethylation and hypermethylation respectively to restrict CpGs to a notable feature where they change as a group. WGBS data of adult tissues taken from Ref 11.
Extended Data Figure 3
Extended Data Figure 3. Transcriptional differences between Epiblast and E×E are directed in part through DNA methylation
a. Select gene set enrichment analysis of E×E-hypermethylated transcription start sites including Gene Ontology, Canonical Pathways, and Genetic and Chemical Perturbations. E×E-hypermethylated promoters are highly enriched for transcription factors and signaling pathways involved in patterning the early embryo. Moreover, these CGI regulated genes are canonical targets of PRC2, which coordinates selective expression of key developmental regulators during gastrulation. b. DNA methylation and open chromatin dynamics for the tumor suppressors p16Ink4a, p19Arf, and p15Ink4b. While these loci are either basally or non-transcribed during early development, three regions are dynamically methylated in E×E (highlighted in gray), including a >10 kb region that encompasses the entirety of the p16Ink4a locus and is either wholly unmethylated in Epiblast or extensively methylated in E×E. CpG islands are highlighted in green, and the positions of included TSSs are highlighted in red. c. Scatterplot of Log2 expression dynamics versus differential CGI methylation between Epiblast and E×E. While most dynamically methylated CGI-promoter containing genes have functions in later embryonic development and are not yet highly expressed, de novo methylation in E×E is generally associated with transcriptional repression. E×E hyper CGIs are highlighted in pink. Promoter CGIs are assigned to the most proximal gene within a + or – 2 kb boundary. d. Boxplots demonstrating the relationship between promoter methylation and expression in the restriction of extraembryonic and embryonic compartments. Promoters are defined as + or – 1 kb of an annotated TSS and scored as dynamically methylated in E×E if the difference with Epiblast is ≥0.1. Expression changes between dynamically methylated and background promoter sets are provided over increasing thresholds according to their expression in Epiblast. While many CGI promoters are not dynamically expressed in either Epiblast or E×E and are associated with genes that have downstream developmental functions, transcriptional repression is a consistent feature of promoter methylation, even at this low threshold. e. Median open chromatin signal as measured by ATAC-seq for E×E Hyper CGI-associated TSSs in the transition from pre- to postimplantation. E×E Hyper CGI-associated genes are heavily enriched for roles in patterning the embryo proper and are primarily not expressed until the onset of gastrulation. In the transition from Blastocyst to Epiblast, these promoters gain open chromatin signal, suggesting transcriptional priming or activation, which is not observed within the E×E, where they are de novo methylated. Shaded area reflects the 25th and 75th percentile per fixed 100 bp bin. f. Expression and differential promoter methylation of key epigenetic regulators and master regulators over early embryonic and extraembryonic development. Most epigenetic regulators exhibit minimal expression differences between Epiblast and E×E, with the Dnmts being notable exceptions. Key isoforms of Dnmt3a and Dnmt3b are upregulated in Epiblast in conjunction with global remethylation, while the suppression of Dnmt3a in E×E corresponds with de novo promoter methylation. Alternatively, the maintenance methyltransferase Dnmt1 and the non-catalytic cofactor Dnmt3l are induced within the blastocyst and maintained at higher levels in E×E, with reciprocal methylation of the Dnmt3l promoter in Epiblast. The histone 3 lysine 36 demethylase Kdm2b displays differential expression of catalytically active and inactive isoforms within Epiblast and E×E, respectively, with isoform switching seemingly imposed by de novo methylation around the somatically utilized CGI promoter. The E×E is characterized by persistent expression of the master regulators Cdx2, Eomes, and Elf5 (Refs 47-50), while the still pluripotent epiblast remains Pou5f1 (Oct4) positive. Many additional regulators of subsequent developmental stages are basally expressed within the Epiblast and their promoters de novo methylated in E×E. The difference in promoter methylation refers to the annotated TSS that exhibits the greatest absolute difference between E×E and Epiblast. TPM: Transcripts Per Million. Additional high-resolution genome-browser tracks are displayed for select transcriptional and epigenetic regulators in Extended Data Figure 4 and 7, respectively. g. Unsupervised hierarchical clustering of 11,780 genes over late preimplantation and early post-implantation development, partitioned into 20 distinct dynamics (“clusters”). Cluster 10 includes genes that are specifically induced within the Epiblast but not the E×E. Heatmap intensity reflects the row-normalized Z score. h. Significant Gene Ontology enrichment for the 20 gene expression dynamics characterized in e, including for those regulated by E×E-methylated CGI promoters, as calculated using the binomial test. Cluster 10 is enriched for both developmental functions and E×E promoter methylation.
Extended Data Figure 4
Extended Data Figure 4. Unique bifurcation and epigenetic reinforcement of transcriptional regulators during postimplantation development
a. Genome browser tracks for WGBS, ATAC-seq and RNA-seq data for transcriptional regulators associated with embryonic or extraembryonic development. CGIs are highlighted in green, and the positions of included TSSs are highlighted in red. Embryonic regulators include Pou5f1, Nanog, and Pdrm14, which are progressively expressed over preimplantation and for which Pou5f1 and Nanog remain expressed in the Epiblast. For these genes, repression in E×E is accompanied by differential methylation of their TSSs, which is strikingly apparent as a local hypermethylation “peak” at the Pou5f1 locus within an ∼5kb region that is otherwise hypomethylated in Epiblast. At the Nanog locus, an upstream region remains hypomethylated in both tissues. Finally, de novo methylation of the Prdm14 promoter is representative of the unique E×E-specific target of CGIs promoters that occurs at hundreds of genes with downstream developmental functions. Density refers to the projected number of methylated CpGs per 100 bp of primary sequence and highlights the extensive epigenetic signal present over these regions within E×E specifically (Δ Density refers to the difference compared to epiblast). b. Extraembryonic development is in part directed by the master regulator Elf5, which is not induced until implantation and is reciprocally methylated at its TSS in Epiblast. Intriguingly, many transcriptional regulators associated with pluripotency and germline development persist within the E×E, including Zfp42 and the paralogs Dppa2 and Dppa4. As with Elf5, the promoters for these genes are differentially methylated in Epiblast and frequently characterized by broad kilobase-scale hypomethylation surrounding their TSS in E×E. c. Scatterplots for Log2 Transcripts Per Million (TPM) as a function of promoter methylation reveals a higher sensitivity to low methylation levels in E×E in comparison to epiblast. Median and 25th, 75th percentiles for expression is overlayed over bins of 0.1. The fraction of unmethylated promoters is very similar between each tissue and exhibit comparable expression values. Promoters are calculated as + or – 1 kb of an annotated TSS. d. Read level methylation of E×E Hyper CGIs in E×E and Epiblast. The methylation status for every sequencing read within a given CGI was ranked and binned into percentiles. Plotted are the median and 25th/75th percentile for these ranks across E×E Hyper CGIs for both E×E and Epiblast. In general, ∼80% of reads falling within these regions are methylated in E×E, with a median methylation value of 0.25, very close to the average, unphased measurement for the CGI entirely, indicating that de novo methylation occurs within a high fraction of cells within the E×E and to a similar extent.
Extended Data Figure 5
Extended Data Figure 5. Epigenetic restriction of Fgf production and sensing to embryonic or extraembryonic compartments
a. Genome browser tracks for WGBS, ATAC-seq and RNA-seq data for select Fgf growth factors, receptors, and potentiators that are dynamically regulated during early post-implantation development. Fgf's such as the ICM-specific Fgf4 and Epiblast-specific Fgf5 and Fgf8 are all regulated by CGI containing promoters that are de novo methylated in E×E. Alternatively, Fgf sensing genes such as Fgfr2 the potentiating protein Fgfbp1 become specific to the E×E and are characterized by broad kilobase-scale hypomethylated domains surrounding their respective TSSs in this tissue. Moreover, the asymmetric allocation of FGFR2 expressing cells during the specification of the ICM indicates that this tissue is still sensitive to these growth factors prior to the epigenetic restriction that is imposed by DNA methylation during implantation,. CGIs are highlighted in green, and the positions of included TSSs are highlighted in red. Density refers to the projected number of methylated CpGs per 100 bp of primary sequence and highlights the extensive epigenetic signal present over these regions within E×E specifically (Δ Density refers to the difference compared to epiblast). b. Bright field images of ICM outgrowths after 2 or 4 days under disparate growth factor or small molecule conditions. All ICM were cultured on irradiated feeders in a basal N2/B27 media supplemented with Leukemia Inhibitory Factor (LIF). 2i refers to the canonical FGF-inhibited, WNT-active condition supplemented with the MEK inhibitor PD0325901 and the GSK3β inhibitor CHIR99021, which functions as a WNT agonist. PD refers to culture with PD0325901 alone and represents repressed FGF signaling in the absence of an additional WNT input. FGF4/CHIR represents dual FGF and WNT activity by culture in recombinant FGF4 and CHIR99021 and includes notable interior and exterior tissue structures that emerged during culture and were independently isolated and profiled. Finally, ICM were cultured in FGF4 alone. Outlines highlight the specific components of each outgrowth that were subsequently purified for analysis by dual RRBS and RNA-seq profiling (see Methods). Scale bar shown on the bottom right. c. Differential methylation of CGIs in vitro differs from E×E according to developmental trajectory. Shown are specific TSS-associated CGIs that are either methylated in E×E and both conditions, E×E and FGF/CHIR, or E×E-only and the corresponding mean adjusted Log2 fold change in gene expression, respectively. Shared targets include early developmental genes, such as Prdm14, that are repressed in each case, though often highly expressed in the FGF/CHIR interior. Notably, some of these genes, particularly those associated with the germline, can be de novo methylated later in embryonic development. FGF differs from the E×E and FGF/CHIR conditions in the methylation of CGI's associated with either the epiblast or neuroectoderm, including genes that are expressed in the FGF condition, such as Otx2, Igfbp2, and Sfrp2, though this set encompasses other neuroectodermal master regulators such as Pax6 that are not yet expressed. Finally, E×E and FGF/CHIR diverge in the promoter methylation of endodermal master regulators, such as Foxa2, Hnf1b, Gata4, and Sox17, which are highly expressed in the transition from FGF/CHIR inside to outside. Notably, the bifurcation in CGI methylation corresponds to the expression of Fgfr2 and repression of Fgf4, as is observed in vivo: Fgf4 is highly expressed within the interior and repressed in the exterior (32.0 to 3.5 Transcripts Per Million, TPM) while Fgfr2 is induced (2.3 to 13.5 TPM). PD and FGF/CHIR conditions are also uniquely positive for Dnmt3b and 3l expression, but E×E Hyper CGI methylation is not observed with PD present (TPM = 30.2 and 60.9 for Dnmt3b and Dnmt3l in FGF/CHIR outside, and 61.0 and 41.3 for PD), indicating either the requirement for an additional cofactor or post-translational modification to redirect these enzymes to this feature set.
Extended Data Figure 6
Extended Data Figure 6. Generation of dual expression and methylation libraries from outgrowth and embryonic knockout data
a and b. Sequencing metrics and coverage information for dual RRBS and RNA-seq libraries generated for the evaluation of ICM outgrowths and CRISPR/Cas9 disrupted E6.5 embryos, including similarity metrics between replicates (Euclidean distance and Pearson Correlation for RRBS and Pearson correlation for RNA-seq). Mean and median methylation of 100 bp tiles is also included for the RRBS samples. c. CRISPR/Cas9 disrupted embryos were generated by zygotic injection of three single guide RNA (gRNA) sequences specific to early exons that are shared across different isoforms. The genomic coordinates and protospacer sequences are provided (see Methods).
Extended Data Figure 7
Extended Data Figure 7. Dynamic expression and epigenetic regulation of key epigenetic regulators during early implantation
Genome browser tracks for WGBS, ATAC-seq and RNA-seq data for the Dnmt1, Dnmt3a, and Dnmt3b loci, as well as corresponding RNA-seq data (in Log2 Transcripts Per Million, TPM, to highlight the expression of selected isoforms). CGIs are highlighted in green, and the positions of included TSSs are highlighted in red. a. Dnmt1 is not appreciably expressed in early cleavage, in part due to a transient maternal imprint over the somatically-utilized TSS (Dnmt1s),, but shows moderate induction within the ICM. Then, at implantation, it is induced within both the Epiblast and E×E. Dnmt1 is expressed at higher levels within the E×E and displays persistent focal hypomethylation around the maternal-specific TSS (Dnmt1o) that is not observed in the Epiblast, which resolves an area of preimplantation-specific hypomethylation to the hypermethylated genomic average. b. The short Dnmt3a2 isoform is induced to high levels during implantation and is also expressed within embryonic stem cells (ESCs). Alternatively, the CGI-containing promoter of Dnmt3a2 is methylated in E×E and its transcription is suppressed. c. Like Dnmt1, the Dnmt3b promoter contains a CGI that is maternally imprinted during preimplantation,. Induction is apparent within the blastocyst, but becomes asymmetrically abundant within the epiblast following implantation. d. Dnmt3l is a non-catalytic cofactor that enhances the de novo activity of Dnmt3a and b, with specific functions in the early embryo and germline. During implantation, Dnmt3l is initially expressed in both ICM and TE, but it remains expressed in E×E and is silenced by de novo methylation in the Epiblast. e. The Histone-3 lysine 36 (H3K36) demethylase Kdm2b has specific roles in establishing the boundary between promoters and actively transcribed gene bodies, as well as in PRC2 recruitment and the establishment of facultative heterochromatin-. A catalytically-inactive isoform, Kdm2b2, initiates from an alternate TSS downstream of exons encoding the demethylating Jumonji (JMJ) domain of the catalytically active Kdm2b117. Kdm2b2 is the most prevalent isoform during preimplantation development and remains expressed in the E×E. Alternatively, Kdm2b1 is only induced during implantation within the Epiblast, while its CGI-containing promoter gains methylation in E×E. Like Dnmt1s and Dnmt3b, the CGI promoter of Kdm2b1 is a maternally-methylated imprint that resolves to hypomethylation during implantation,. f. Extraembryonic genome remethylation is highly dependent on Dnmt3b and Dnmt1. Pairwise comparisons of 100 bp tiles as measured by RRBS for wild type Epiblast and E×E (y axis) versus matched CRISPR/Cas9 disrupted tissues (x axis). Extraembryonic methylation levels diminish genome-wide when Dnmt1, Dnmt3b and Dnmt3l are disrupted. The epiblast is only sensitive to Dnmt1 and Dnmt3b disruption, both to a lesser extent than the E×E, presumably because of compensation from Dnmt3a. Intriguingly, the decrease in global methylation levels when Dnmt1 is deleted is greater for E×E than epiblast, indicating a higher dependence on maintenance and less efficient de novo methyltransferase activity in this tissue. The identity line is included in gray and the best fit by LOESS regression in red. The number of 100 bp tiles used in each comparison and the r2 are included in the upper left of each plot. g. Composite plots of E×E Hyper CGI-containing promoters in CRISPR/Cas9 targeted Epiblast and E×E respectively. In general, only limited effects are observed in epiblast other than a slight increase in the peripheral methylation within the Eed-null sample. Alternatively, both TSS proximal and peripheral methylation is decreased in Dnmt1, 3b, and 3l null samples. Specificity for diminished methylation at the TSS is observed in Eed-null E×E, particularly downstream within the first kilobase. In both Epiblast and E×E, the wild type median is included in gray for comparison. Line represents the median and shaded area the 25th/75th percentiles, respectively. For RRBS data, composite plots are of the median for 200 bp windows, taken at intervals of 50 bp. h. Statistical test for the derepression of E×E Hyper CGI associated genes demonstrates a comparable requirement for Eed in both epiblast and E×E. Gene expression of KO samples were compared to matched WT samples using DESeq2 with raw counts as input. Enrichment for E×E Hyper CGI associated genes were evaluated by Wilcoxon rank-sum test and represented as Z-scores, which were converted to p-values assuming a normal distribution. Bonferroni correction for multiple testing was applied to derive the FDR.
Extended Data Figure 8
Extended Data Figure 8. General features of the cancer methylome and of CGI DMRs
a. Median methylation of differentially regulated CGI-containing promoters in a primary colon tumor isolate and Chronic Lymphocytic Leukemia (CLL) compared to colon and B lymphocytes, respectively. E×E Hyper CGIs as identified in this study and shown in Figure 1 are included for reference. The median methylation difference between extraembryonic or cancerous tissue compared to Epiblast or normal tissue is also included. The general features of both cancer methylomes are similar to that of the E×E, with a maximal increase in DNA methylation centered at the TSS that steadily diminishes within the periphery. Alternatively, hypomethylated CGIs in extraembryonic or tumorigenic contexts are maximally different a distance away from the TSS, within the boundary or “CpG island shore,” as previously reported for cancer. Shaded area represents the 25th and 75th percentiles per 100 bp bin. b. Read level methylation of hypermethylated CGIs in E×E vs Epiblast, Colon Tumor vs Colon, and CLL vs B lymphocyte, with those islands that share differential methylation status between the cancer and extraembryonic development included as a subset. The methylation status for every sequencing read within a given hypermethylated CGI was ranked and binned into percentiles. Plotted are the median and 25th/75th percentile for these ranks across CGIs called as hypermethylated in each pairwise comparison. The E×E-Epiblast and CLL-B lymphocyte comparisons exhibit very similar distributions that indicate general discordance, meaning similar aggregate methylation across the feature as is observed in phase, which can only be obtained by dispersive de novo methylation across the majority of alleles within the population. Alternatively, Colon Tumor exhibits substantially higher read level methylation, with a median per read methylation of ∼0.7. However, the per-read methylation level of the non-tumorous, matched colon tissue is also quite high, with >50% of reads exhibiting some methylation. This could indicate a transition in the epigenetic status of these loci within colon tissue that precedes tumorigenesis, as has been noted for several other tissues in Extended Data Figure 9. Moreover, the extent to which E×E Hyper CGIs are methylated within each tumor reflects the read-level methylation distribution for the tumor. As such, the targeting to E×E Hyper CGIs is a conserved feature of human cancer types, but the extent to which they are methylated can be specific to the system. c. Data taken from ENCODE samples that reflect embryonic and extraembryonic identities in human in comparison to the well-characterized human cancer cell line HCT116. The human embryonic stem cell line HUES64, a proxy for the pluripotent epiblast, displays notable enrichment for both repressive, PRC2 deposited H3K27me3 and activating H3K4me3 modifications at orthologous E×E Hyper CGIs. Alternatively, human placenta exhibits diminished enrichment for both modifications at these regions, as does HCT116. Both systems display substantial methylation over these islands as presented in Figure 4, Extended Data Figure 9, and Supplementary Table 7. As a control, “E×E hypo” demonstrates uniformly high H3K4me3 levels across all three tissues. Enrichment density heatmaps are provided for the full E×E-hyper set and are ranked across plots according to their enrichment for H3K27me3 in HUES64. Normalized enrichment represents the fold ChIP-enrichment against sample matched Whole Cell Extract (WCE). d. Boxplots of mean methylation for 489 E×E-methylated, orthologous CGIs (E×E Hyper CGIs) across the 14 tissue-matched TCGA tumor types that display disregulated DNA methylation landscapes and for CLL. Note: CLL samples were measured by RRBS (n=119) and represent a comparison between age matched healthy B lymphocytes (n=24). Edges refer to the 25th and 75th percentiles, whiskers the 2.5th and 97.5th percentiles, respectively. e. Boxplots for TCGA data sets and CLL for the absolute methylation values of All orthologously mapped CGIs, those methylated across Cancer, and those that are specifically methylated in mouse E×E. In all 15 cancer types that exhibit general global hypomethylation and CGI methylation as part of their departure from somatic cells, E×E Hyper CGIs are specifically enriched, more so than for CGIs that are observed as hypermethylated in any tumor. f. Boxplots for the same TCGA data for tumor-specific CGIs and those that are also methylated in mouse E×E. Notably, the extent to which mouse E×E Hyper CGIs are methylated reflect the tumor, with some cancer types exhibiting higher absolute methylation values than others. However, in 14 out of 15 cases, the absolute methylation status of tumor-specific CGI DMRs and those that are also methylated in E×E are nearly identical, and often slightly greater. Absolute methylation values therefore appear to be determined by the cancer type, while targeting of extraembryonically methylated CGIs is a general feature.
Extended Data 9
Extended Data 9. Broad conservation of extraembryonic methylation patterns across cancer types and cell lines
a. Boxplots of orthologous E×E Hyper CGIs across 107 ENCODE/Roadmap samples as presented in Figure 4, with notable additional features of each sample highlighted below. Notably, human extraembryonic tissues, including a trophoblastic cell line and primary placenta, also share conserved CGI methylation with mouse. Normal tissues that appear to exhibit higher mean methylation of E×E Hyper CGIs include numerous endodermal lineages, such as colonic mucosa, stomach and liver (mean methylation of 0.275, 0.185 and 0.179, respectively) as well as mature cell types of the adaptive immune system, such as CD8+ and CD4+ T lymphocytes and B lymphocytes (mean methylation of 0.199, 0.173 and 0.173, respectively). In contrast, ectodermal and epithelial cells are comparatively less methylated than other somatic tissues, although cancer cell lines and primary tumors derived from these tissues remain sensitive to hypermethylation. b. Genome browser tracks for orthologous loci as originally presented for mouse development in Figure 1 display high similar transitions during transformation. Loci include OTX2, GATA4, and the entire HOXC cluster in three human fetal tissues that represent each germ layer (Brain, Ectoderm; Heart, Mesoderm; Stomache, Endoderm), primary human B lymphocytes, and a Chronic Lymphocytic Leukemia (CLL) sample. CGIs around these loci are preserved in a hypomethylated state during embryonic development, where the bimodal architecture of the DNA methylation landscape is clearly maintained. In B lymphocytes, some low-level, encroaching methylation is already apparent over developmentally hypomethylated regions, as is also observed in the Roadmap sample in a. However, in the transition to CLL, extensive methylation is observed across these islands while methylation values drop in the surrounding areas. Red line and shaded area reflect the local mean and standardized deviation as calculated by local regression (LOESS) to compensate for the greater number of CpGs within the human orthologs versus mouse, which can complicate visual estimates of local methylation at these scales. CGIs are highlighted in green, and the positions of included TSSs are highlighted in red.
Extended Data Figure 10
Extended Data Figure 10. Genetic features of E×E CGI methylation in cancers
a. Intersection analysis as presented in Figure 4 for cancer-hypomethylated CGIs across the 14 TCGA tumor types and CLL that exhibit global loss of methylation in tandem with CGI hypermethylation. Generally, CGI hypomethylation is more specific, such that the intersection across cancers decays exponentially. Notably, even for hypomethylated CGI, the intersection across cancer types remains higher for those that are also hypomethylated in E×E, human placenta, or both (conserved). b. Intersection analysis for cancer-dysregulated genes across TCGA tumor types. Of genes significantly dysregulated in at least n (0 – 14) TCGA cancer types, the fraction of genes that are functionally related to E×E Hyper CGI-associated genes were predicted by GRAIL, using a global gene-network built by text-mining (see Methods). An FDR of 5% was used as cutoff. As the number of TCGA tumor types increases, the fraction of E×E Hyper CGI-associated genes within the downregulated set generally increases, while those that are upregulated decreases substantially. c. Boxplots of the average methylation for the 489 orthologous E×E Hyper CGI feature set for 10,629 tumors available in TCGA with matched mutational and methylation data, segregated by mutational status of genes that function as part of the FGF signaling pathway. In aggregate, tumors with FGF pathway mutations have a median average E×E Hyper CGI methylation level of 0.328 compared to 0.275 for those that do not (p<10-16, Rank Sum Test). Edges refer to the 25th and 75th percentiles, whiskers the 2.5th and 97.5th percentiles, respectively. d. Among 539 genes that are present in the top 10 recurrently mutated pathways in cancer, 68 are functionally related to E×E Hyper CGI-associated genes (FDR < 5%), as predicted by GRAIL using text-mining database. Genes in FGF-signaling pathway are highlighted in red. In general, FGF signaling pathway genes have high connectivity scores to E×E hyper CGI-associated genes (Enrichment Z score = 3.88 for FGF pathway members within the p-value distribution for all 539 genes). e. Statistical enrichment for FGF pathway genes for either amplification or deletion within the TCGA database is notably skewed towards amplification, indicating a generally oncogenic nature for this pathway in tumorigenesis. f. Methylation status of E×E Hyper CGIs across colonic and hematopoietic mouse cancer models where de novo methyltransferase activity has been perturbed. All samples are measured by RRBS. Data sets include: primary colon tissue in which Dnmt3b has been overexpressed (promoter methylation status reported, Ref 62); genetic models of acute myeloid leukemia (AML) including those transformed by the MLL-AF9 fusion (Ref 63), cMyc and Bcl2 overexpression (Ref 63), and FLT3 internal tandem duplication (FLT3-IDT, Ref 64); and Acute and Chronic Lymphoblastic Leukemia models driven by Dnmt3a knock out alone (Refs 65 and 66). Methylation of E×E Hyper CGIs is observed in both colonic Dnmt3b overexpression and hematopoietic Dnmt3a knockout, though additional oncogenic drivers appear sufficient to induce de novo methylation of these regions in the presence or absence of Dnmt3 expression, indicating the potential of numerous drivers to activate this pathway. Wild type hematopoietic tissues are included for reference and taken from Ref 65 and . Edges refer to the 25th and 75th percentiles, whiskers the 2.5th and 97.5th percentiles, respectively.
Figure 1
Figure 1. Divergent postimplanation DNA methylation landscapes
a. Early developmental time series collected for this study, including precompacted 8 cell stage embryos (2.25 days post fertilization; E2.25), trophectoderm (TE) and Inner Cell Mass (ICM) of the E3.5 blastocyst as well as E6.5 Extraembryonic Ectoderm (E×E) and Epiblast (see Methods). b. Top: CpG methylation distribution for 100 bp tiles. Bottom: Median 100 bp tile methylation as a function of local CpG density. Shaded area represents the 25th and 75th percentiles. c. Feature level enrichment for differentially methylated CpGs compared to genomic background. E×E-hypomethylated CpGs are prevailing found in non-genic sequences, while E×E-hypermethylated CpGs localize to CpG islands (CGI), Transcription Start Sites (TSS) and 5′ Exons. Here, TSS refers to the 1 kb upstream of an annotated TSS only, while 5′ Exon and Exons represent non-overlapping sets. d. Median methylation architecture flanking E×E-hypermethylated TSSs within embryonic and extraembryonic tissues, as well as the relative difference (Δ methylation), which diverges considerably upon implantation. Shaded area represents the 25th and 75th percentiles per 100 bp bin. e. Genome browser tracks for WGBS, ATAC-seq and RNA-seq data capturing three emblematic loci. Density refers to the projected number of methylated CpGs per 100 bp of primary sequence and highlights the extensive epigenetic signal present over these regions within E×E specifically (Δ Density refers to the difference compared to epiblast). For Otx2 and Gata4, E×E-specific methylation and repression are concurrent, while the HoxC cluster is expressed later in embryonic development. CGIs and annotated TSSs are highlighted in green and red, respectively.
Figure 2
Figure 2. De novo methylation of early developmental gene promoters can be modulated by external conditions
a. Schematic of signaling pathway interactions between Epiblast (blue) and E×E (red). Epiblast-produced Fibroblast Growth Factors (FGFs) promote E×E development, which expresses Bone Morphogenic Protein 4 (BMP4) to induce Wingless (WNT) proteins in Epiblast. Epiblast secreted pro-Nodal is processed by the E×E to establish a proximal-distal gradient and the primitive streak. b. Expression and differential promoter methylation of key signaling components. Many FGFs and associated receptors exhibit reciprocal expression and promoter methylation between Epiblast and E×E. Wnt3 induction is apparent in epiblast, while Wnt6 and 7b are highly expressed in both TE and E×E. Differential promoter methylation refers to the annotated TSS (+ or – 1 kb) with the greatest absolute difference (Supplementary Table 2). c. Schematic for the ICM outgrowth test. ICM outgrowths are cultured for 4 days under disparate growth factor or small molecule conditions intended to either stimulate or repress FGF and WNT activity. Outline highlights the purified component (Methods). d. Methylation boxplots for the conditions described in c, including all RRBS-captured 100 bp tiles and E×E-targeted CGIs (E×E Hyper CGIs). Edges refer to the 25th and 75th percentiles, whiskers the 2.5th and 97.5th percentiles, respectively. e. The E×E, FGF/CHIR exterior, and FGF outgrowth all display substantial CGI methylation. Shown is the intersection of methylated CGIs with ≥0.1 increase in comparison to Epiblast (n=3,420). The FGF4 condition has the highest number of methylated CGIs, but fewer intersect with E×E than when CHIR is also present. f. Clustering of differentially methylated CGIs from e, with methylation status in E×E, embryonic regulation by PRC2, and TSS proximity (+/- 2 kb) included. 25% of E×E methylated CGIs overlap with both conditions, while 51% overlap with the FGF/CHIR exterior outgrowth.
Figure 3
Figure 3. A novel configuration of epigenetic regulators contributes to the extraembryonic methylation landscape
a. Boxplots for E6.5 epiblast tissue for wild type and CRISPR/Cas9 disrupted samples, including for 100 bp tiles and E×E Hyper CGIs, as measured by RRBS. Edges refer to the 25th and 75th percentiles, whiskers the 2.5th and 97.5th percentiles, respectively. b. Boxplots as in a for sample-matched E×E. In comparison to the Dnmt3a and 3b-positive epiblast, Dnmt1 or Dnmt3b disruption have far greater effects on global methylation levels and result in a highly depleted genome. c. Composite plots of E×E Hyper CGIs by knockout status. CGI methylation is disrupted in Eed-null E×E, particularly within +1 kb of the TSS, without affecting global levels. Gray line represents the wild type median. Composite plots map the median of 200 bp windows over 50 bp intervals from RRBS data. d. Heatmap of the differential CGI methylation (≥0.1) between CRISPR/Cas9-targeted Epiblast or E×E compared to their wild type counterparts. Differential E×E methylation status and TSS proximity (+/- 2 kb) are included for reference.
Figure 4
Figure 4. Extraembryonically-targeted CpG islands are pervasively methylated across human cancer types
a. Disruption of global methylation creates similar biases for CGIs and promoters between TE/ICM and E×E/Epiblast or patient- or age-matched normal/tumor tissue comparisons. Heatmap shows the log Z score enrichment for features by the binomial test. Of these 16 cancer types, only THCA does not display a notably dysregulated methylome. N's refer to the number of matched tumor/normal tissue isolates for each type. TCGA samples include Bladder Urothelial Carcinoma (BLCA), Breast Invasive Carcinoma (BRCA), Colon Adenocarcinoma (COAD), Colorectal Adenocarcinoma (READ), Esophageal Carcinoma (ESCA), Head and Neck Squamous Cell Carcinoma (HNSC), Kidney Renal Clear Cell Carcinoma (KIRC), Kidney Renal Papillar Cell Carcinoma (KIRP), Liver Hepatocellular Carcinoma (LIHC), Lung Adenocarcinoma (LUAD), Lung Squamous Cell Carcinoma (LUSC), Prostate Adenocarcinoma (PRAD), Stomach and Esophageal Carcinoma (STES), Thyroid Carcinoma (THCA), and Uterine Corpus Endometrial Carcinoma (UCEC). Here, Chronic Lymphocytic Leukemia (CLL) to B lymphocyte comparison is between age-matched samples measured by WGBS. b. Feature level boxplots of 489 E×E Hyper CGIs that preserve their status in human, calculated as a feature per tumor or normal tissue for the 15 cancer types where CGI methylation is generally apparent. Note: CLL samples were measured by RRBS (n=119) and represent a comparison between age-matched healthy B lymphocytes (n=24). Edges refer to the 25th and 75th percentiles, whiskers the 2.5th and 97.5th percentiles, respectively. c. Differential methylation heatmap for 8,942 orthologous CGIs measured in TCGA or by RRBS and clustered by Euclidean Distance. DMR bar includes the cumulative number of cancers a given island is called as differentially methylated, as well as the DMR status in either human placenta compared to human embryonic stem cells (hESCs), mouse E×E compared to Epiblast, or shared between both comparisons (Conserved). PRC2 (hESC) denotes regulation by polycomb in hESCs. Numbers reflect the proportion of each set that is differentially methylated in at least one cancer type. d. Intersection analysis for DMR status across TCGA and CLL samples. Both Placenta and E×E DMRs are similarly enriched for methylation in at least one human cancer type (86% and 84% respectively, compared to 35% for all CGIs) and are more frequently methylated across them. Inter-tumor enrichment for conserved DMRs is greater than for extraembryonic DMRs from each individual species, and 94% are methylated in at least one cancer type. e. Boxplots of orthologous E×E Hyper CGIs across 107 ENCODE/Roadmap samples, ranked by mean methylation and with cancer or cancer-cell line assignment highlighted (red). “Normal” assigned samples that sort with cancer include the trophoblast cell line HTR8svn, primary colon and colonic mucosa, placenta, and CD8+ T lymphocytes, in descending order. Extended Data Fig. 9 or Supplementary Table 7 includes additional sample characteristics.

Comment in

Similar articles

Cited by

References

    1. Smith ZD, Meissner A. DNA methylation: roles in mammalian development. Nat Rev Genet. 2013;14:204–220. doi: 10.1038/nrg3354. - DOI - PubMed
    1. Ohm JE, et al. A stem cell-like chromatin pattern may predispose tumor suppressor genes to DNA hypermethylation and heritable silencing. Nat Genet. 2007;39:237–242. doi: 10.1038/ng1972. - DOI - PMC - PubMed
    1. Schlesinger Y, et al. Polycomb-mediated methylation on Lys27 of histone H3 pre-marks genes for de novo methylation in cancer. Nat Genet. 2007;39:232–236. doi: 10.1038/ng1950. - DOI - PubMed
    1. Widschwendter M, et al. Epigenetic stem cell signature in cancer. Nat Genet. 2007;39:157–158. doi: 10.1038/ng1941. - DOI - PubMed
    1. Feinberg AP, Ohlsson R, Henikoff S. The epigenetic progenitor origin of human cancer. Nat Rev Genet. 2006;7:21–33. doi: 10.1038/nrg1748. - DOI - PubMed

Publication types

MeSH terms