. 2017 Sep 20;549(7673):548-552.
doi: 10.1038/nature24023.

Regulation of DNA repair pathway choice in S and G2 phases by the NHEJ inhibitor CYREN

Affiliations

Regulation of DNA repair pathway choice in S and G2 phases by the NHEJ inhibitor CYREN

Nausica Arnoult et al. Nature. .

Abstract

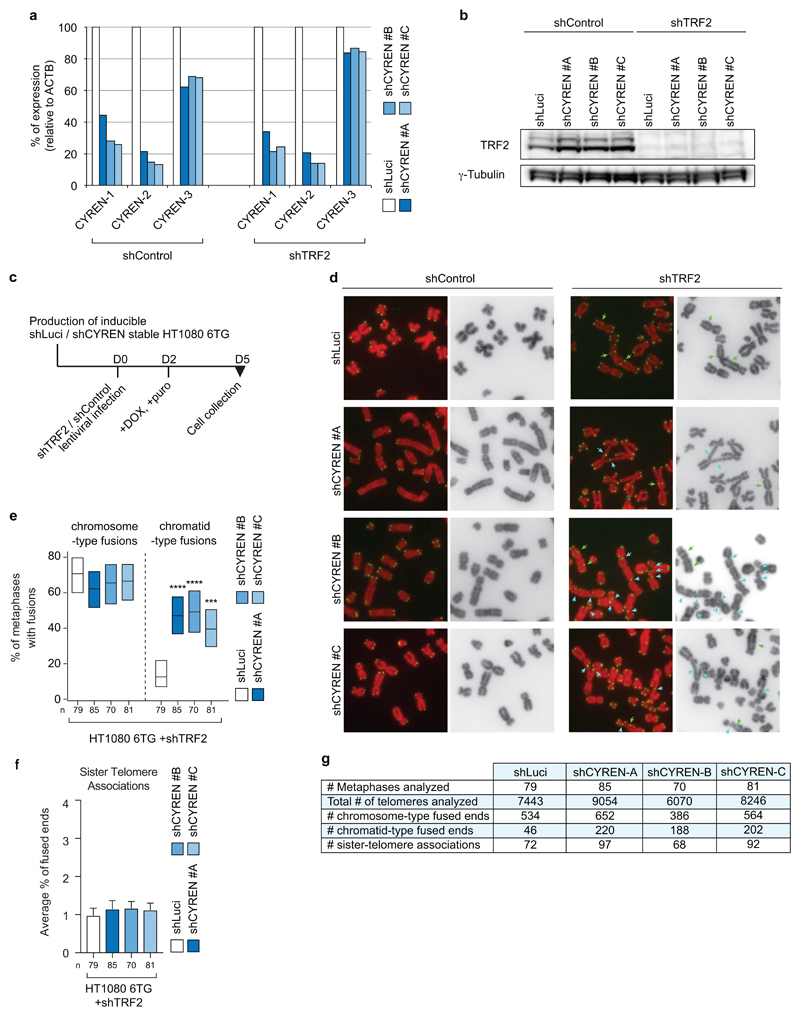
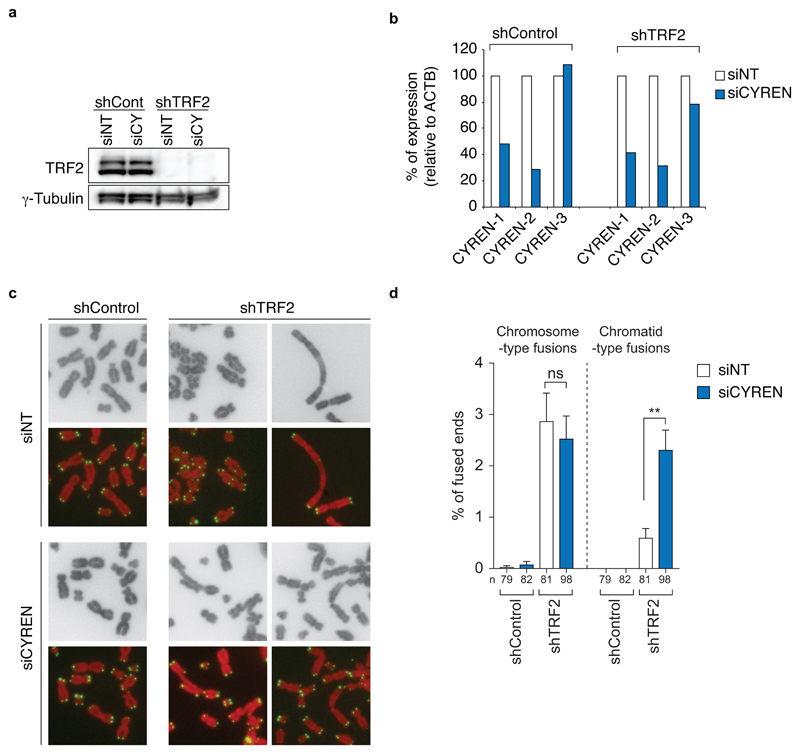
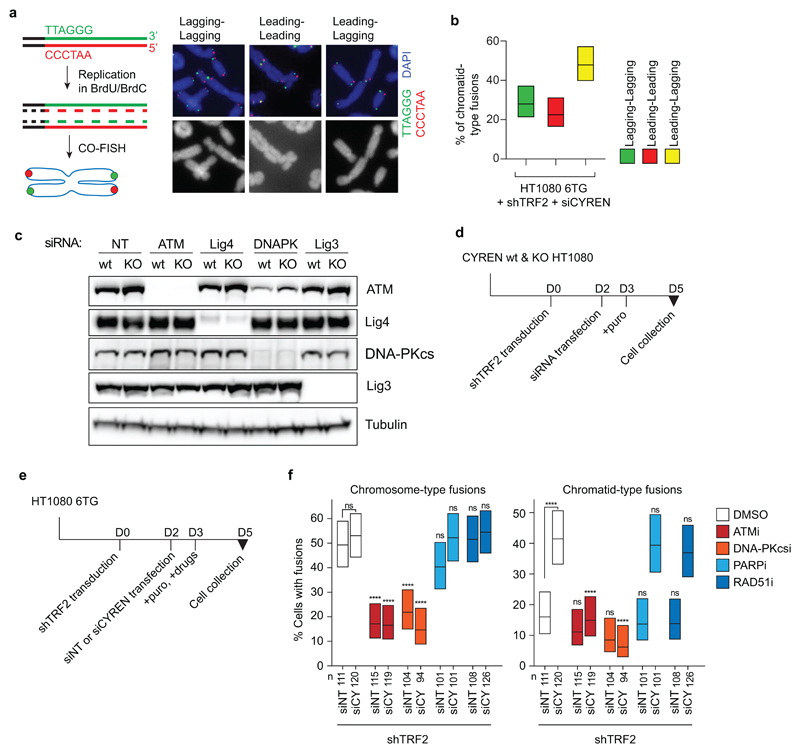
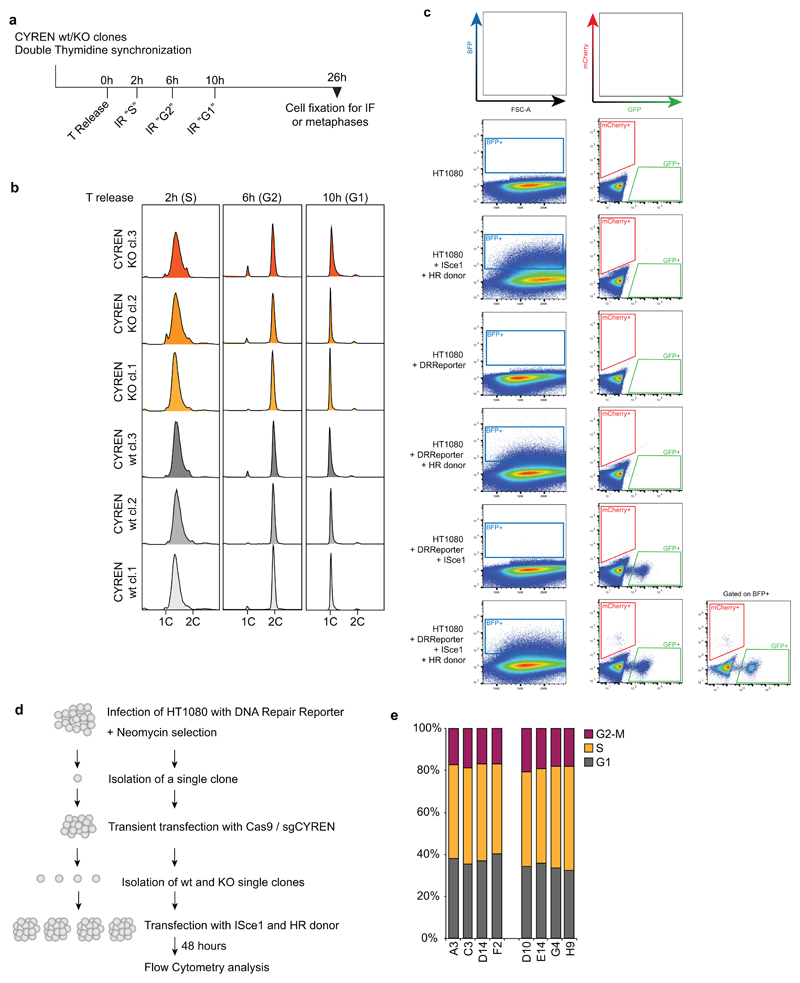
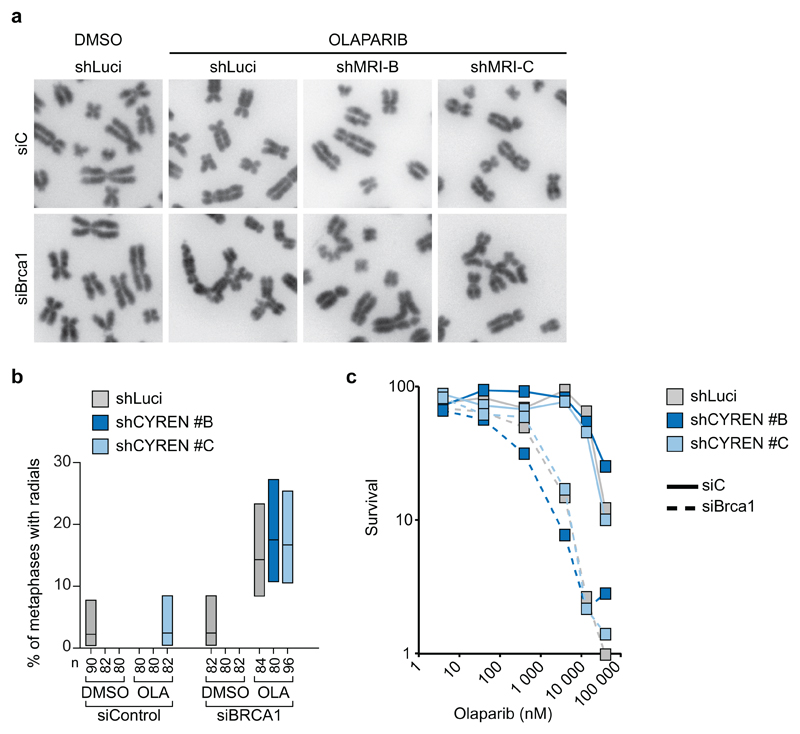
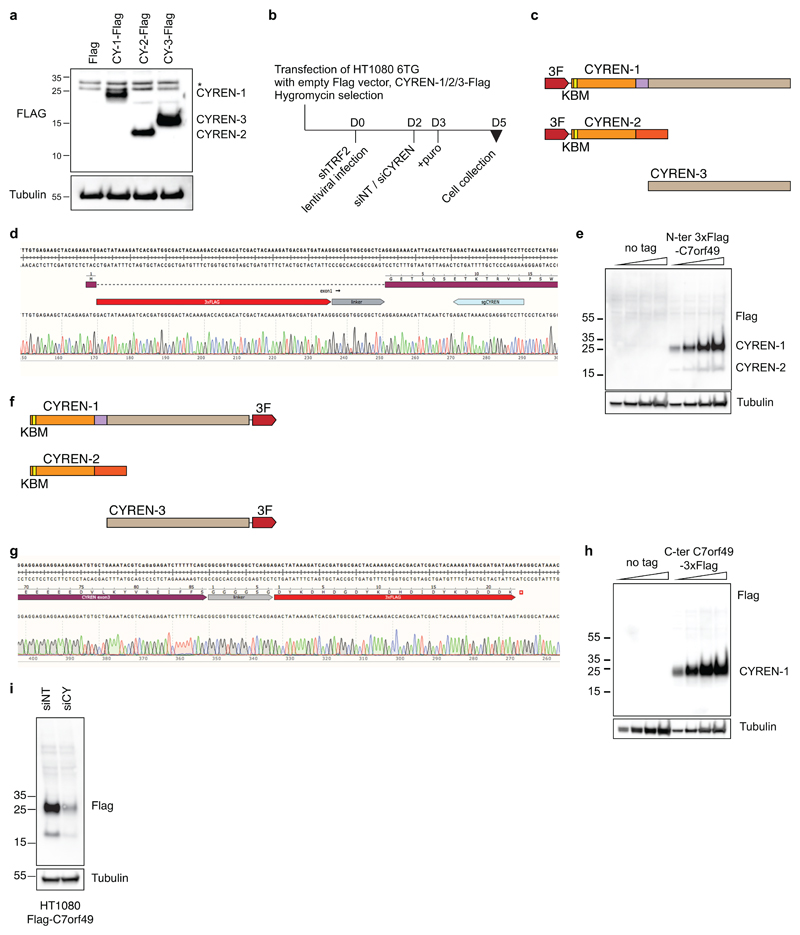
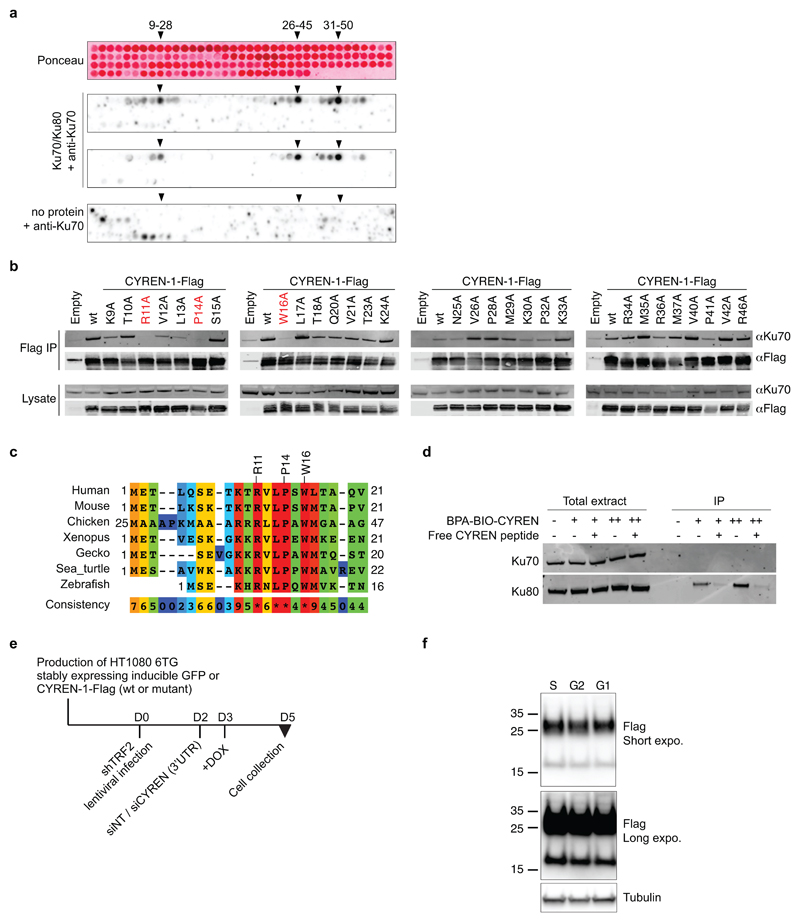
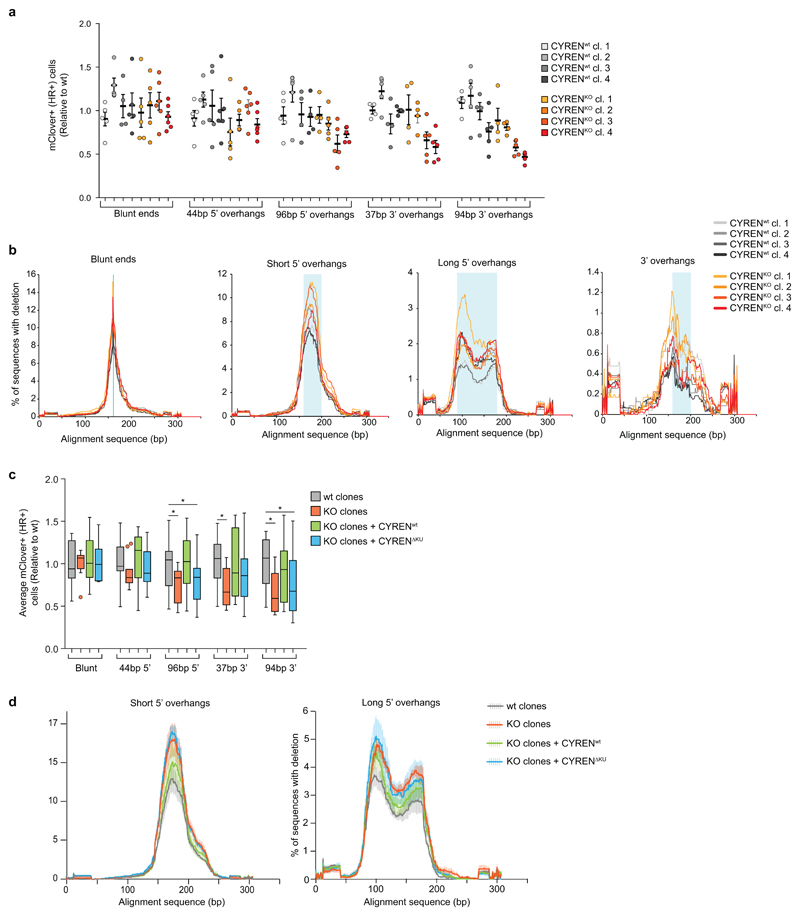
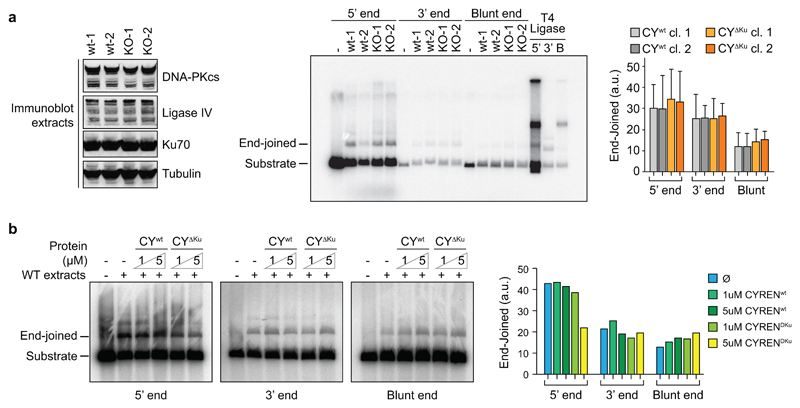
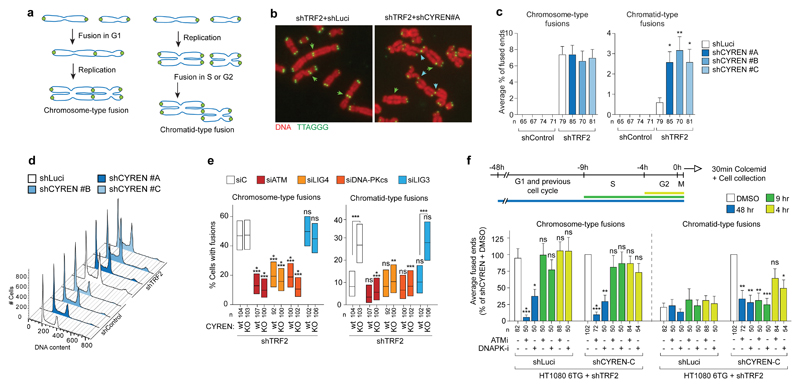
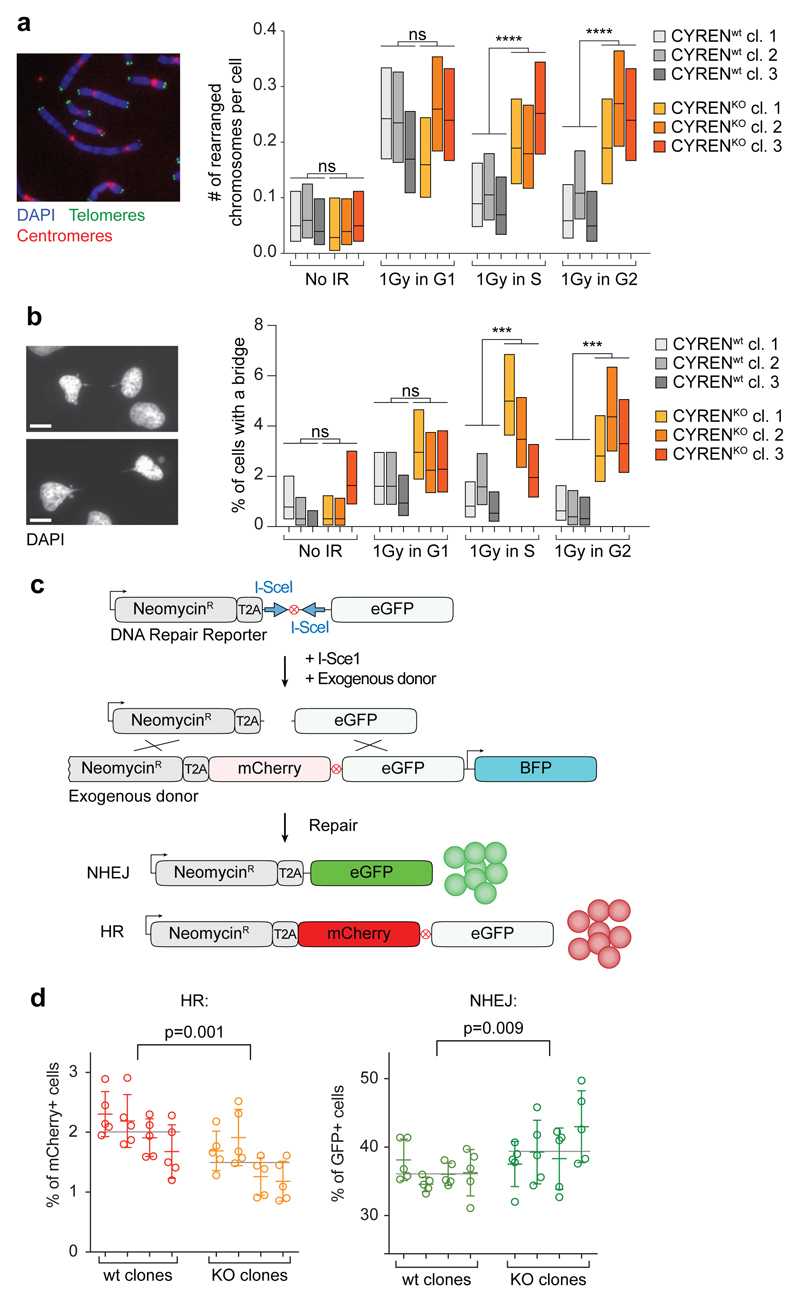
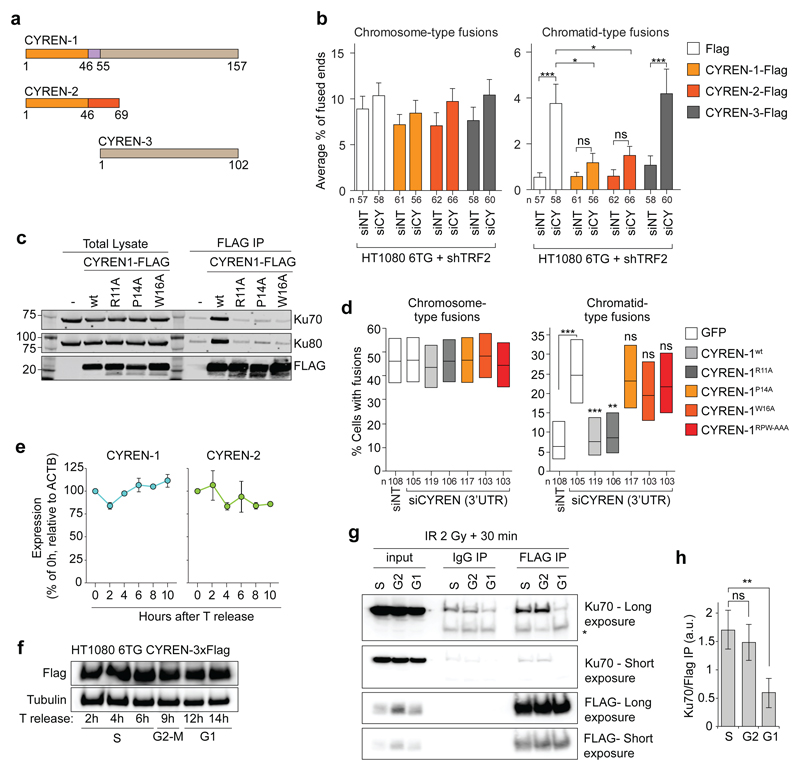
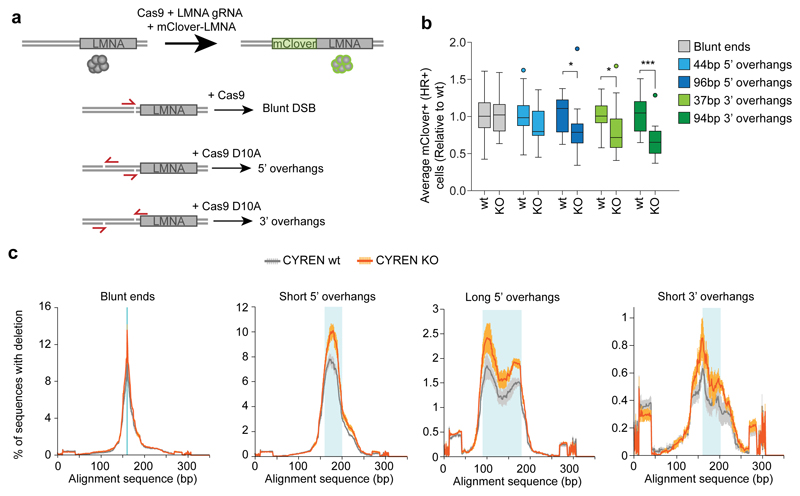
Classical non-homologous end joining (cNHEJ) and homologous recombination compete for the repair of double-stranded DNA breaks during the cell cycle. Homologous recombination is inhibited during the G1 phase of the cell cycle, but both pathways are active in the S and G2 phases. However, it is unclear why cNHEJ does not always outcompete homologous recombination during the S and G2 phases. Here we show that CYREN (cell cycle regulator of NHEJ) is a cell-cycle-specific inhibitor of cNHEJ. Suppression of CYREN allows cNHEJ to occur at telomeres and intrachromosomal breaks during the S and G2 phases, and cells lacking CYREN accumulate chromosomal aberrations upon damage induction, specifically outside the G1 phase. CYREN acts by binding to the Ku70/80 heterodimer and preferentially inhibits cNHEJ at breaks with overhangs by protecting them. We therefore propose that CYREN is a direct cell-cycle-dependent inhibitor of cNHEJ that promotes error-free repair by homologous recombination during cell cycle phases when sister chromatids are present.


Conflict of interest statement

Author Information

The authors declare no competing financial interests.

Figures

Extended data Figure 1
Extended data Figure 1. CYREN depletion leads to chromatid-type fusions at deprotected telomeres.
a, qRT-PCR measurement of CYREN isoforms expression for Figure 1c-e. Normalized to ACTB qRT-PCR. CYREN-1, PCR primers target mRNA transcript variant 1. CYREN-2, PCR primers target mRNA transcript variants 2, 3, 4 and 5. CYREN-3, PCR primers target mRNA transcript variant 7. b, Western blot showing TRF2 depletion. For gel source data, see Supplementary Figure 1. c, Experimental outline of Figure 1c. HT1080 6TG cells stably transduced with an inducible control shLuci or three different shCYREN were infected with shControl or shTRF2 on Day 0. shTRF2 transduced cells were selected with puromycin and shCYREN expression was induced with doxycyclin on Day 2. Cells were collected for fusion analysis on Day 5. d, Partial metaphase spreads of functional (shControl) and deprotected (shTRF2) telomeres after CYREN depletion. Green arrows: Chromosome-type fusions. Blue arrows: Chromatid-type fusions. e, Percentage of cells with fusions ± upper and lower value of 95% confidence intervals, Wilson/Brown test. ****P<0.0001, ***P<0.001. Fisher’s exact test, two-sided. n: number of metaphases analysed. f, Mean percentage of chromosome ends fused by sister telomere associations. Error bars, s.e.m. ns. One-way ANOVA, Sidak’s multiple comparison test. n: number of metaphases analysed. g, Number of metaphases analysed, total telomere and fusions counted.
Extended data Figure 2
Extended data Figure 2. Chromatid-type fusions induced by CYREN depletion in IMR90 fibroblasts.
a, Western blot showing TRF2 depletion. For gel source data, see Supplementary Figure 1. b, qRT-PCR measurement of CYREN isoforms expression after siRNA knock-down. Normalized to ACTB qRT-PCR. CYREN-1, PCR primers target mRNA transcript variant 1. CYREN-2, PCR primers target mRNA transcript variants 2, 3, 4 and 5. CYREN-3, PCR primers target mRNA transcript variant 7. c, Representative images of partial metaphase spreads of functional (shControl) and deprotected (shTRF2) telomeres after CYREN depletion. d, Mean percentage of fused chromosome ends per metaphase. Error bars, s.e.m. **P<0.01. One-way ANOVA, Sidak’s multiple comparison test. n: number of metaphases analysed.
Extended data Figure 3
Extended data Figure 3. CYREN prevents cNHEJ in S and G2 at deprotected telomeres.
a, Schematic of CO-FISH. Chromatid-type fusions involving leading and lagging strands. b, Percentage of fusions ± upper and lower value of 95% confidence intervals, Wilson/Brown test. 126 fusions counted. c, Western blot showing knockdown of ATM, Ligase 4, DNA-PKcs and Ligase 3 in Figure 2c. For gel source data, see Supplementary Figure 1. d, Experimental timeline for Figure 2c. CYRENwt and CYRENKO HT1080 cells were infected with shTRF2 on Day 0, followed by transfection with siRNAs on Day 2. On Day 3, shTRF2 infected cells were selected with Puromycin and cells were collected for fusion analysis on Day 5. e, Experimental timeline for Extended data Figure 3d. HT1080 6TG were stably transduced with shTRF2 on Day 0, followed by transfection with Non-Targetting (NT) or CYREN siRNAs on Day 2. On Day 3, shTRF2 infected cells were selected with Puromycin and inhibitors were added. Cells were collected for fusion analysis on Day 5. f, Percentage of cells with fusions ± upper and lower value of 95% confidence intervals, Wilson/Brown test. Cells were treated for 48 hours with DMSO or the following inhibitors: ATMi (KU-55933) 10µM, DNA-PKcsi (NU-7441) 1µM, PARPi (Olaparib) 10µM, RAD51i (RI-1) 20µM. ****P<0.0001, ns non significant. Fisher’s exact test, two-sided. Experiment shown is representative of two biological replicates.
Extended data Figure 4
Extended data Figure 4. CYREN regulates the DSB pathway choice at intrachromosomal breaks.
a, Experimental timeline for Figure 3a-b. CYRENwt and CYRENKO clonal HT1080 were synchronised by double thymdine block, irradiated at 2 Gray 2 hours, 6 hours and 10 hours after Thymidine release, corresponding to S, G2 and G1 phases of the cell cycle, respectively. Cells were arrested for Immuno-Fluorescence or chromosome spreads 26 hours after thymidine release. b, Cell cycle profiles of cells used in Figure 3a-b, 2 hours, 6 hours and 10 hours after Thymidine release. 20,000 cells were analysed. c, Representative flow cytometry controls for the DSB Repair Reporter. 1 million cells per sample were analysed. d, Experimental outline of Fig. 3d. A single clone of HT1080 transduced with the DSB Repair Reporter was isolated and transfected with Cas9 and sgCYREN. Single clones were isolated and genotype. Selected wt and KO clones were then transfected with ISce1 and the HR donor, followed by flow cytometry analysis 48 hours later. e, Cell cycle distribution of the wt and KO clones obtained by flow cytometry of Propidium Iodide and BrdU labeled cells. 20,000 cells were analysed. 80,000 cells were analysed.
Extended data Figure 5
Extended data Figure 5. CYREN does not regulate repair of replication-induced DSBs.
a, Representative images of chromosomes from b. b. Percentage of metaphases with radial chromosomes ± upper and lower value of 95% confidence intervals, Wilson/Brown test. n: number of metaphases analysed. Experiment shown is representative of 2 biological replicates. c, Percentage of survival to increasing concentrations of PARP inhibitor.
Extended data Figure 6
Extended data Figure 6. CYREN isoforms 1 and 2 inhibit cNHEJ.
a, Anti-Flag western blot on whole cell extracts of HT1080 6TG expressing Flag-CYREN isoforms used in Fig. 4b. * indicates two non specific bands. For gel source data, see Supplementary Figure 1. b, Experimental outline of Fig. 4b. HT1080 6TG were stably transfected with pcDNA3 empty Flag vector or pcDNA3 expressing CYREN-1-Flag, CYREN-2-Flag or CYREN-3-Flag. Cells were selected and infected with shTRF2 on Day 0, followed by transfection with a control pool of Non-targeting (NT) siRNAs or a pool of siRNAs targeting the 3’UTR of CYREN. shTRF2 infected cells were selected on Day 3 and cells were collected for fusion analysis on Day 5. c, Schematic representation of N-terminal 3FLAG endogenous tagging of CYREN-1 and CYREN-2. d, Sequencing of the N-ter 3FLAG-CYREN tagged allele. e, Anti-Flag western blot of whole cells extracts from HT1080 and HT1080 with endogenously N-terminally 3xFLAG tagged exon 1 of C7Orf49. Upper band, CYREN-1. Lower band, CYREN-2. Increasing amounts of protein extracts were loaded (5, 10, 15, 20µl). For gel source data, see Supplementary Figure 1. f, Schematic representation of C-terminal 3FLAG endogenous tagging of CYREN-1 and CYREN-3. g, Sequencing of the C-ter CYREN-3FLAG tagged allele. h, FLAG western blot of HT1080 6TG without and with endogenously tagged C-ter CYREN-3FLAG. Increasing amounts of protein extracts were loaded (5, 10, 15, 20µl). For gel source data, see Supplementary Figure 1. i, FLAG western blot of 3FLAG-CYREN tagged HT1080 following CYREN knockdown by siRNA. For gel source data, see Supplementary Figure 1.
Extended data Figure 7
Extended data Figure 7. CYREN interaction with Ku in S and G2 inhibits cNHEJ.
a, Immunoblotting of a peptide binding array of full length CYREN-1. Each dot represents 20 aa of CYREN-1 with 19 aa overlap with the previous and following peptide. Upper panel, ponceau. Middle panels, duplicate incubation with Ku70/Ku80 recombinant proteins and immunoblotting with anti-Ku70 antibody. Lower panel, control immunoblotting with anti-Ku70 antibody without incubation with recombinant Ku70/80. For gel source data, see Supplementary Figure 1. b, Alanine scan of CYREN-1 on residues 9 to 46. FLAG immunoprecipitation of protein extracts from HEK293T cells transfected with pCDNA3.1 plasmids expressing wt CYREN-1-FLAG or each of the single residues mutated to Alanine. Total lysate and FLAG-IP were then immunoblotted with anti FLAG or Ku70 antibodies. For gel source data, see Supplementary Figure 1. c, Protein alignment of CYREN-1 Ku Binding Motif among vertebrates. d, Photo-crosslinked pull down of a BPA-BIO-CYREN(2-24) peptide in HEK293T protein extract, followed by immunoblotting with anti-Ku70 and Ku80 antibodies. + and ++, 25µM and 50µM of BPA-Bio-CYREN. 100µM of CYREN(2-24) free peptide was used as a competitor. For gel source data, see Supplementary Figure 1. e, Experimental outline of Fig. 4d. HT1080 6TG cells stably expressing an inducible control GFP or wt or mutant CYREN-1-3xFlag were transduced with shTRF2 on Day 0 and transfected with a control (NT) pool of siRNAs or a pool of siRNAs targeting the 3’UTR of CYREN on Day 2. Expression of CYREN-1 wt and mutants was induced on Day 3 and cells were collected on Day 5. f, FLAG western blot of endogenous C-terminal 3FLAG tagged CYREN-1 and CYREN-2 cells following double thymidine synchronisation. For gel source data, see Supplementary Figure 1.
Extended data Figure 8
Extended data Figure 8. CYREN inhibits cNHEJ preferentially at breaks with overhangs by preventing processing.
a, Percentage of cells using HR to repair Cas9-induced breaks. Detail of 4 wt and 4 KO clones used in Fig. 5b. b, Deletion profiles of repair of Cas9-induced breaks. Detail profiles of 4 wt and 4 KO clones used in Fig. 5c. Blue line in blunt ends: break site. Blue area: overhang region created by the pair of sgRNAs. c. Average percentage of mClover+ cells in 4 wt clones, 4 KO clones, 4 KO clones complemented with wt CYREN and 4 KO clones complemented with mutant CYREN (RPW-AAA), in 3 independent experiments, normalized to wt. Whiskers: Tuckey. *P<0.05. Unpaired T test. In each experiment, 100,000 cells per sample were analysed. d, Deletion profiles of repair of Cas9 breaks. Average percentage of deletion in wt, KO clones, and KO clones complemented with wt CYREN or mutant CYREN (RPW-AAA). Error bars, s.e.m.
Extended data Figure 9
Extended data Figure 9. CYREN does not promote cNHEJ in vitro.
a, In vitro cNHEJ assay using CYRENwt and CYRENKO cells. Left panel: Immunoblots of extracts used in the assay. Middle panel: In Vitro ligation assay. Right panel: quantification. Error bars: standard deviation, 3 independent experiments. For gel source data, see Supplementary Figure 1. b, In vitro cNHEJ assay using CYRENwt cells and increasing amounts of recombinant wt CYREN and CYRENΔKu mutant. Right panel: quantification. For gel source data, see Supplementary Figure 1.
Extended data Figure 10
Extended data Figure 10. Maps of plasmids used in Figures 1-2-3-4-5.
Figure 1
Figure 1. CYREN depletion reactivates cNHEJ in S and G2 at deprotected telomeres.
a, Schematic outcome of telomere fusions. b, Partial metaphase spreads of deprotected (shTRF2) telomeres after CYREN depletion. Green arrows: Chromosome-type fusions. Blue arrows: Chromatid-type fusions. c, Mean percentage of fused chromosome ends per metaphase, separated in chromosome-type and chromatid-type fusions. Error bars, s.e.m. **P<0.01, *P<0.05. One-way ANOVA, Sidak’s multiple comparison test. n: number of metaphases analysed. Experiment shown is representative of two biological replicates. d, Cell cycle profiles of cells from c. 12,000 cells were analysed. e, Percentage of cells with fusions ± upper and lower value of 95% confidence intervals, Wilson/Brown test. ****P<0.0001, ***P<0.001, **P<0.01. Fisher’s exact test, two-sided. n: number of metaphases analysed. f, Upper panel, experimental outline. Lower panel, mean percentage of fused ends per metaphase. Error bars, s.e.m. ***P<0.001, **P<0.01, *P<0.05. One-way ANOVA. Sidak’s multiple comparison test. n: number of metaphases analysed. Experiment shown is representative of two biological replicates.
Figure 2
Figure 2. CYREN inhibits NHEJ at intrachromosomal breaks.
a, Average number of rearranged chromosomes per cell ± upper and lower value of 95% confidence intervals, Wilson/Brown test. ****P<0.0001. Two-tailed unpaired t-test. 120 metaphases analysed per condition in 3 biological replicates. b, Percentage of cells with a bridge ± upper and lower value of 95% confidence intervals, Wilson/Brown test. ***P<0.001. Two-tailed unpaired t-test. 300 cells analysed in 3 biological replicates. c, d, Percentage of GFP+ and mCherry+ cells, gated on BFP+, of five biological replicates. Mean ± s.d. is indicated. Gray line, mean of all wt or KO clones. P values, unpaired T test between wt and KO clones. In each experiment, 1 million cells per sample were analysed.
Figure 3
Figure 3. CYREN interaction with Ku in S and G2 inhibits cNHEJ.
a, CYREN isoforms. b, Mean percentage of fused ends per metaphase. Error bars, s.e.m. ***P<0.001, *P<0.05, ns non significant. One-way ANOVA, Sidak’s multiple comparison test. n: number of metaphases analysed. Experiment shown is representative of two biological replicates. c, Co-Immunoprecipitation of CYREN-1-3FLAG with Ku70/80 in HEK293T. For gel source data see Supplementary Figure 1. d, Percentage of fusions ± upper and lower value of 95% confidence intervals, Wilson/Brown test. ***P<0.001, **P<0.01, ns non significant. Fisher’s exact test, two-sided. e, Relative abundance of CYREN-1 and 2 mRNA in double Thymidine synchronized cells. f, Immunoblotting of 3FLAG-CYREN-1 in double Thymidine synchronized cells. g. FLAG immunoprecipitation of CYREN1-3FLAG with 2 Gy irradiation followed by FLAG and Ku70 immunoblotting in double Thymidine synchronized cells. *unspecific band. For gel source data see Supplementary Figure 1. Experiment shown is representative of 4 biological replicates. h, Quantification of g. Error bars, s.e.m. over 4 independent experiments. **P<0.01. Ordinary one-way ANOVA.
Figure 4
Figure 4. CYREN prevents overhang processing.
a, LMNA Cas9 reporter. CRISPR/Cas9 and sgRNAs target the 5’ UTR of LMNA. HR fuses mClover to LMNA for repair. Cas9 with sgRNAs (red arrows) generate different breaks. b, Average percentage of mClover+ cells in 4 wt and 4 KO clones in 5 independent experiments, normalized to wt. Whiskers: Tuckey. ***P<0.001, *P<0.05. Ordinary one-way ANOVA. In each experiment, 250,000 cells per sample were analysed. c, Deletion profiles of repair of Cas9 breaks. Average percentage of deletion in 4 wt and 4 KO clones. Error bars, s.e.m. Blue line in blunt ends: break site. Blue area: overhang region created by the pair of sgRNAs.

References

    1. Lieber MR. The mechanism of double-strand DNA break repair by the nonhomologous DNA end-joining pathway. Annu Rev Biochem. 2010;79:181–211. - PMC - PubMed
    1. Heyer WD, Ehmsen KT, Liu J. Regulation of homologous recombination in eukaryotes. Annu Rev Genet. 2010;44:113–139. - PMC - PubMed
    1. Panier S, Boulton SJ. Double-strand break repair: 53BP1 comes into focus. Nat Rev Mol Cell Biol. 2014;15:7–18. - PubMed
    1. Celli GB, de Lange T. DNA processing is not required for ATM-mediated telomere damage response after TRF2 deletion. Nat Cell Biol. 2005;7:712–718. - PubMed
    1. Konishi A, de Lange T. Cell cycle control of telomere protection and NHEJ revealed by a ts mutation in the DNA-binding domain of TRF2. Genes Dev. 2008;22:1221–1230. - PMC - PubMed

Publication types