

Comparative morphology of snake (Squamata) endocasts: evidence of phylogenetic and ecological signals
- PMID: 28960295
- PMCID: PMC5696132
- DOI: 10.1111/joa.12692
Comparative morphology of snake (Squamata) endocasts: evidence of phylogenetic and ecological signals
Abstract
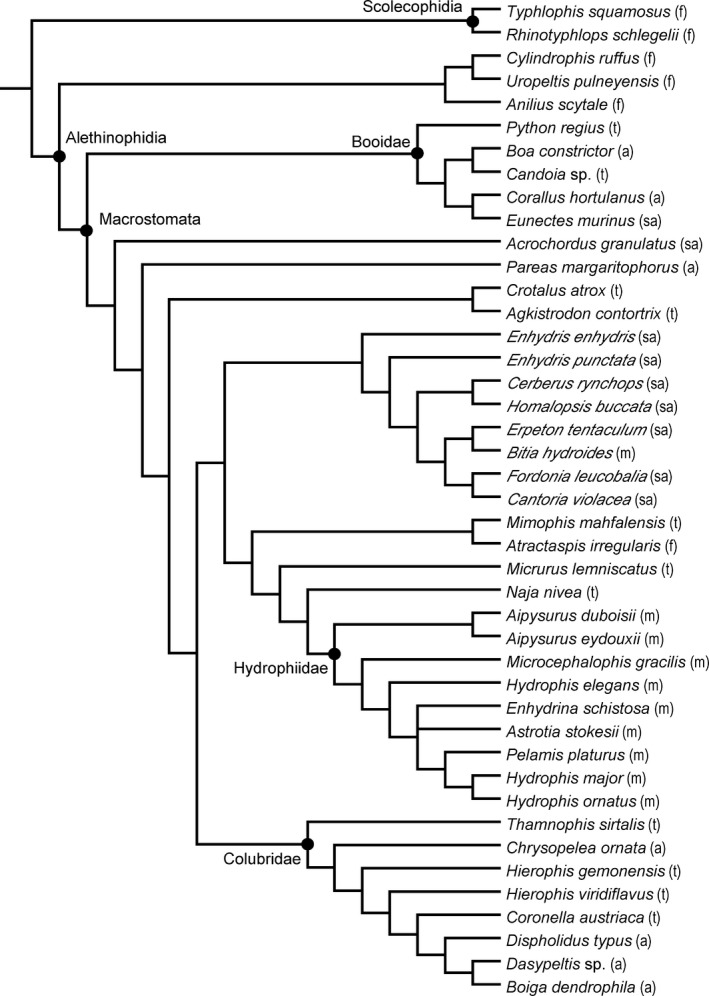
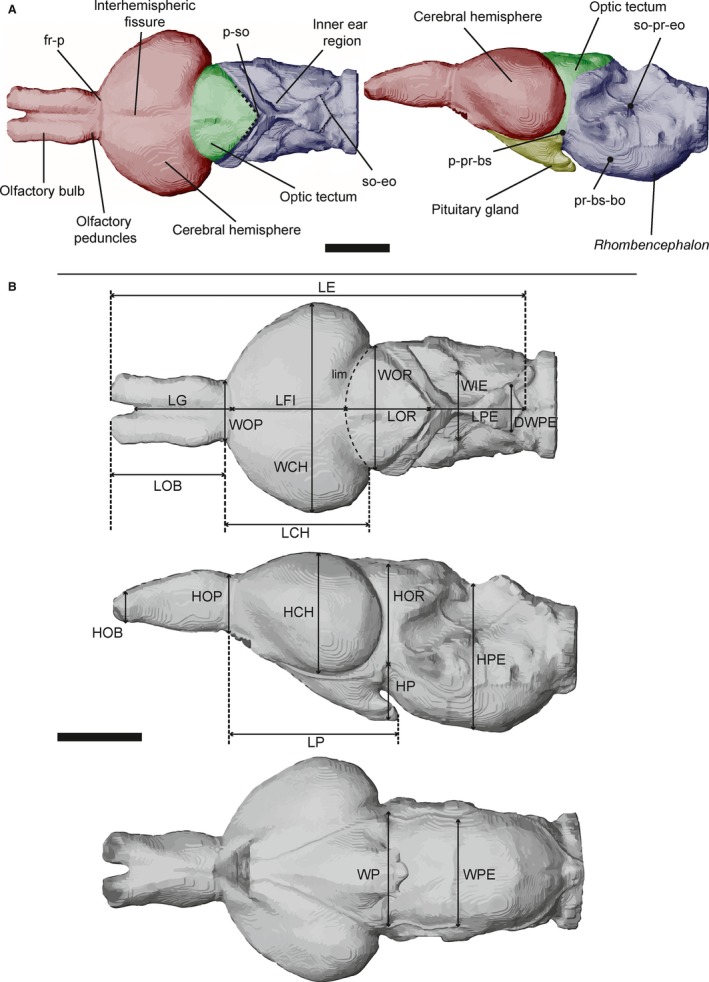
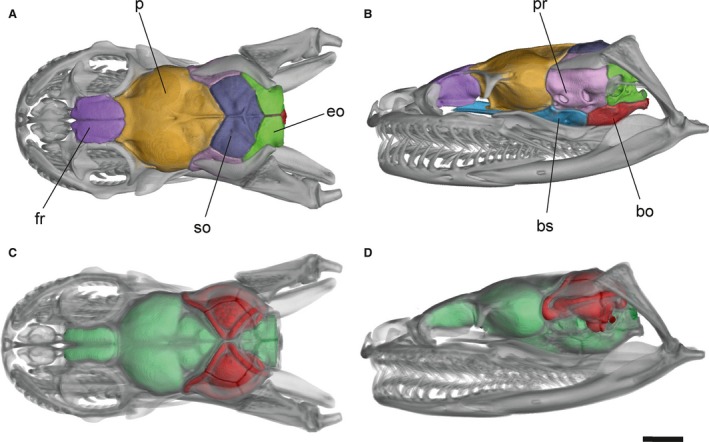
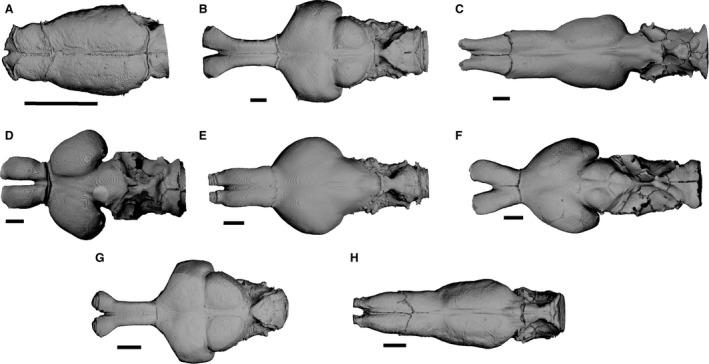
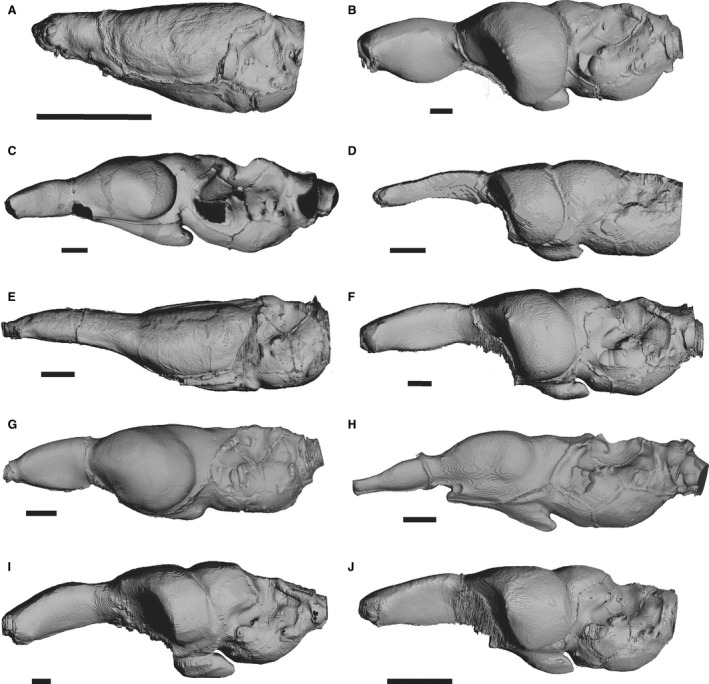
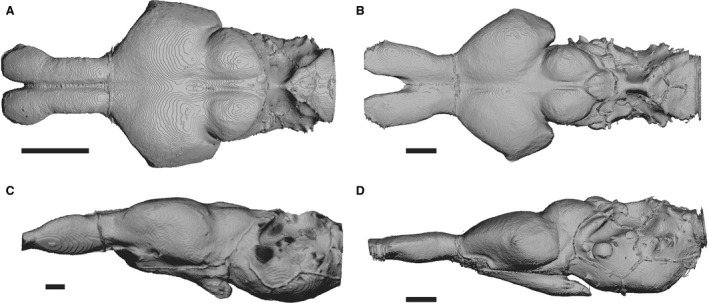
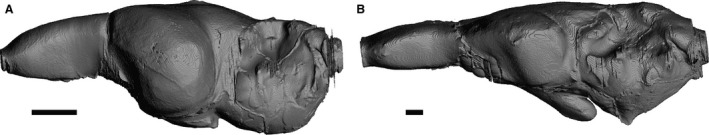
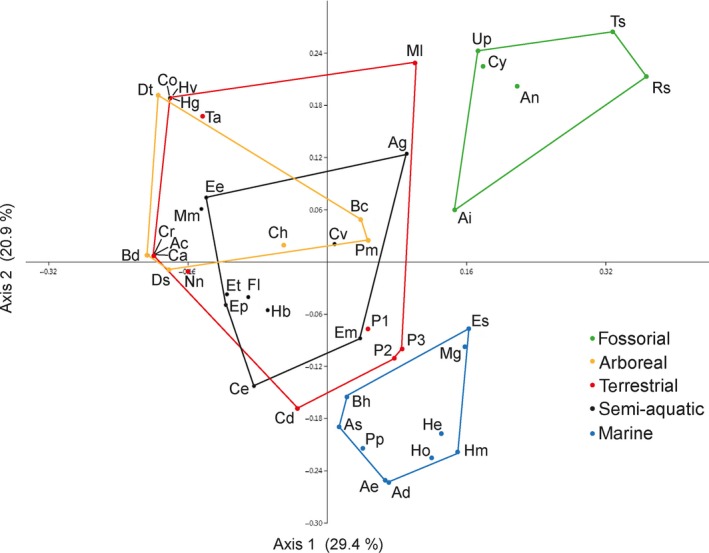
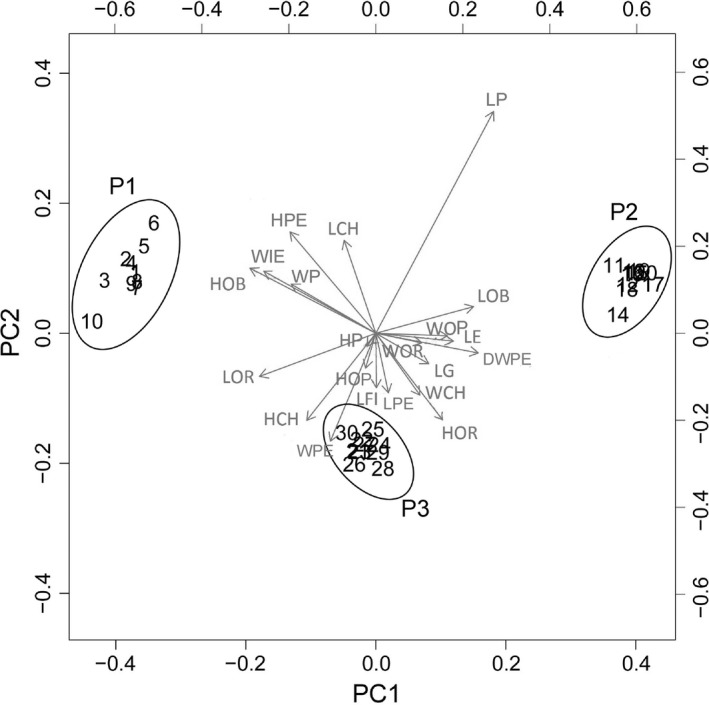
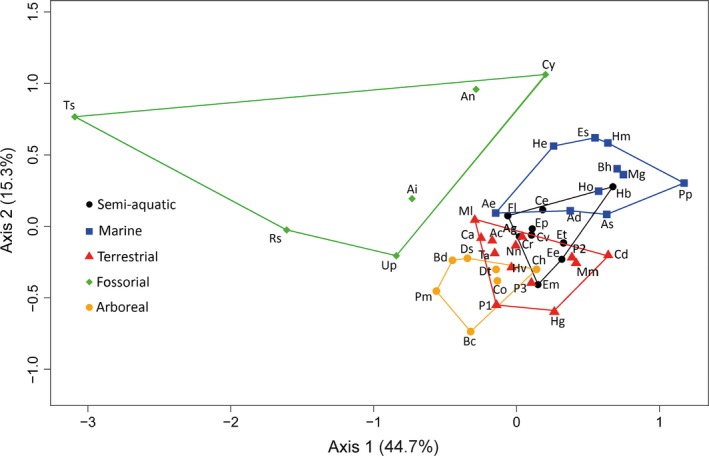
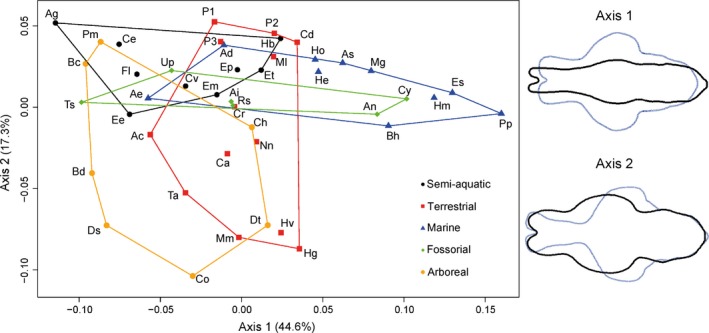
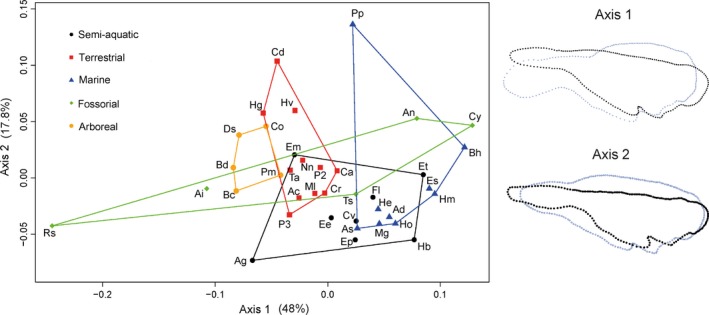
Brain endocasts obtained from computed tomography (CT) are now widely used in the field of comparative neuroanatomy. They provide an overview of the morphology of the brain and associated tissues located in the cranial cavity. Through anatomical comparisons between species, insights on the senses, the behavior, and the lifestyle can be gained. Although there are many studies dealing with mammal and bird endocasts, those performed on the brain endocasts of squamates are comparatively rare, thus limiting our understanding of their morphological variability and interpretations. Here, we provide the first comparative study of snake brain endocasts in order to bring new information about the morphology of these structures. Additionally, we test if the snake brain endocast encompasses a phylogenetic and/or an ecological signal. For this purpose, the digital endocasts of 45 snake specimens, including a wide diversity in terms of phylogeny and ecology, were digitized using CT, and compared both qualitatively and quantitatively. Snake endocasts exhibit a great variability. The different methods performed from descriptive characters, linear measurements and the outline curves provided complementary information. All these methods have shown that the shape of the snake brain endocast contains, as in mammals and birds, a phylogenetic signal but also an ecological one. Although phylogenetically related taxa share several similarities between each other, the brain endocast morphology reflects some notable ecological trends: e.g. (i) fossorial species possess both reduced optic tectum and pituitary gland; (ii) both fossorial and marine species have cerebral hemispheres poorly developed laterally; (iii) cerebral hemispheres and optic tectum are more developed in arboreal and terrestrial species.
Keywords: brain endocast; computed tomography; ecological signal; morphometrics; sensory information; snakes; squamates.
© 2017 Anatomical Society.
Figures
Similar articles
-
Endocast, brain, and bones: Correspondences and spatial relationships in squamates.Anat Rec (Hoboken). 2023 Oct;306(10):2443-2465. doi: 10.1002/ar.25142. Epub 2023 Jan 5. Anat Rec (Hoboken). 2023. PMID: 36602153
-
Morphometric study of phylogenetic and ecologic signals in procyonid (mammalia: carnivora) endocasts.Anat Rec (Hoboken). 2014 Dec;297(12):2318-30. doi: 10.1002/ar.22996. Epub 2014 Jul 25. Anat Rec (Hoboken). 2014. PMID: 25066912
-
Are endocasts good proxies for brain size and shape in archosaurs throughout ontogeny?J Anat. 2019 Mar;234(3):291-305. doi: 10.1111/joa.12918. Epub 2018 Dec 3. J Anat. 2019. PMID: 30506962 Free PMC article.
-
Can all snakes swim? A review of the evidence and testing species across phylogeny and morphological diversity.Zoology (Jena). 2024 Nov;167:126223. doi: 10.1016/j.zool.2024.126223. Epub 2024 Oct 24. Zoology (Jena). 2024. PMID: 39476761 Review.
-
Best practices for digitally constructing endocranial casts: examples from birds and their dinosaurian relatives.J Anat. 2016 Aug;229(2):173-90. doi: 10.1111/joa.12378. Epub 2015 Sep 25. J Anat. 2016. PMID: 26403623 Free PMC article. Review.
Cited by
-
First evidence of convergent lifestyle signal in reptile skull roof microanatomy.BMC Biol. 2020 Nov 30;18(1):185. doi: 10.1186/s12915-020-00908-y. BMC Biol. 2020. PMID: 33250048 Free PMC article.
-
Cranial osteology of Hypoptophis (Aparallactinae: Atractaspididae: Caenophidia), with a discussion on the evolution of its fossorial adaptations.J Morphol. 2022 Apr;283(4):510-538. doi: 10.1002/jmor.21457. Epub 2022 Feb 8. J Morphol. 2022. PMID: 35094424 Free PMC article.
-
Reconstructing the origin and early evolution of the snake brain.Sci Adv. 2023 Sep 29;9(39):eadi6888. doi: 10.1126/sciadv.adi6888. Epub 2023 Sep 27. Sci Adv. 2023. PMID: 37756406 Free PMC article.
-
Inside the head of snakes: influence of size, phylogeny, and sensory ecology on endocranium morphology.Brain Struct Funct. 2021 Sep;226(7):2401-2415. doi: 10.1007/s00429-021-02340-6. Epub 2021 Jul 21. Brain Struct Funct. 2021. PMID: 34287703
-
Comparative analysis of squamate brains unveils multi-level variation in cerebellar architecture associated with locomotor specialization.Nat Commun. 2019 Dec 5;10(1):5560. doi: 10.1038/s41467-019-13405-w. Nat Commun. 2019. PMID: 31804475 Free PMC article.
References
-
- Adams DC (2014) A generalized K statistic for estimating phylogenetic signal from shape and other high‐dimensional multivariate data. Syst Biol 63, 685–697. - PubMed
-
- Ahrens HE (2014) Morphometric study of phylogenetic and ecologic signals in Procyonid (Mammalia: Carnivora) endocasts: morphometrics of Procyonid endocasts. Anat Rec (Hoboken) 297, 2318–2330. - PubMed
-
- Anderson CL, Kabalka GW, Layne DG, et al. (2000) Noninvasive high field MRI brain imaging of the Garter Snake (Thamnophis sirtalis). Copeia 2000, 265–269.
-
- Atobe Y, Nakano M, Kadota T, et al. (2004) Medullary efferent and afferent neurons of the facial nerve of the Pit Viper Gloydius brevicaudus . J Comp Neurol 472, 345–357. - PubMed
-
- Aubret F, Bonnet X, Harris M, et al. (2005) Sex differences in body size and ectoparasite load in the ball python, Python regius . J Herpetol 39, 315–320.
MeSH terms
LinkOut - more resources
Full Text Sources
Other Literature Sources
