

Extending the MR-Egger method for multivariable Mendelian randomization to correct for both measured and unmeasured pleiotropy
- PMID: 28960498
- PMCID: PMC5725762
- DOI: 10.1002/sim.7492
Extending the MR-Egger method for multivariable Mendelian randomization to correct for both measured and unmeasured pleiotropy
Abstract
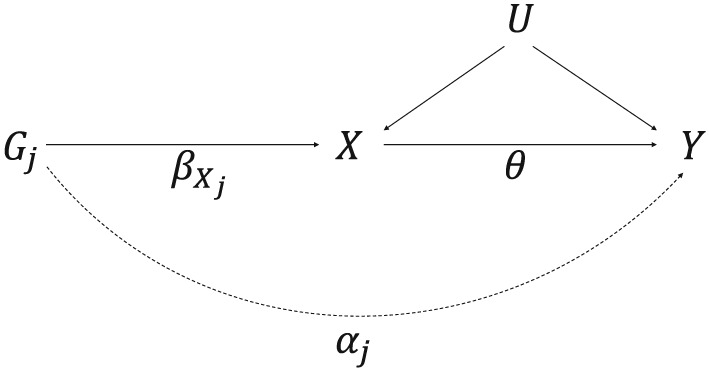
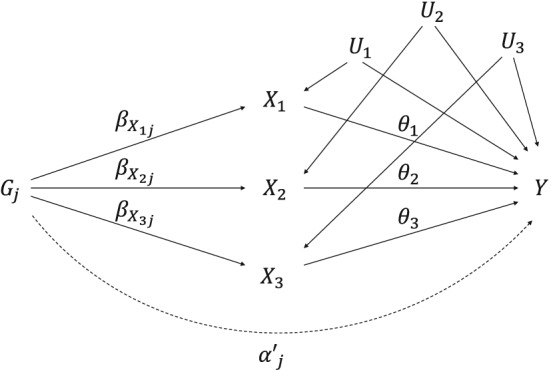
Methods have been developed for Mendelian randomization that can obtain consistent causal estimates while relaxing the instrumental variable assumptions. These include multivariable Mendelian randomization, in which a genetic variant may be associated with multiple risk factors so long as any association with the outcome is via the measured risk factors (measured pleiotropy), and the MR-Egger (Mendelian randomization-Egger) method, in which a genetic variant may be directly associated with the outcome not via the risk factor of interest, so long as the direct effects of the variants on the outcome are uncorrelated with their associations with the risk factor (unmeasured pleiotropy). In this paper, we extend the MR-Egger method to a multivariable setting to correct for both measured and unmeasured pleiotropy. We show, through theoretical arguments and a simulation study, that the multivariable MR-Egger method has advantages over its univariable counterpart in terms of plausibility of the assumption needed for consistent causal estimation and power to detect a causal effect when this assumption is satisfied. The methods are compared in an applied analysis to investigate the causal effect of high-density lipoprotein cholesterol on coronary heart disease risk. The multivariable MR-Egger method will be useful to analyse high-dimensional data in situations where the risk factors are highly related and it is difficult to find genetic variants specifically associated with the risk factor of interest (multivariable by design), and as a sensitivity analysis when the genetic variants are known to have pleiotropic effects on measured risk factors.
Keywords: MR-Egger; Mendelian randomization; invalid instruments; multivariable; pleiotropy.
© 2017 The Authors. Statistics in Medicine published by John Wiley & Sons Ltd.
Figures
Similar articles
-
Mendelian randomization with invalid instruments: effect estimation and bias detection through Egger regression.Int J Epidemiol. 2015 Apr;44(2):512-25. doi: 10.1093/ije/dyv080. Epub 2015 Jun 6. Int J Epidemiol. 2015. PMID: 26050253 Free PMC article.
-
Interpreting findings from Mendelian randomization using the MR-Egger method.Eur J Epidemiol. 2017 May;32(5):377-389. doi: 10.1007/s10654-017-0255-x. Epub 2017 May 19. Eur J Epidemiol. 2017. PMID: 28527048 Free PMC article.
-
Consistent Estimation in Mendelian Randomization with Some Invalid Instruments Using a Weighted Median Estimator.Genet Epidemiol. 2016 May;40(4):304-14. doi: 10.1002/gepi.21965. Epub 2016 Apr 7. Genet Epidemiol. 2016. PMID: 27061298 Free PMC article.
-
Mendelian randomization to assess causal effects of blood lipids on coronary heart disease: lessons from the past and applications to the future.Curr Opin Endocrinol Diabetes Obes. 2016 Apr;23(2):124-30. doi: 10.1097/MED.0000000000000230. Curr Opin Endocrinol Diabetes Obes. 2016. PMID: 26910273 Free PMC article. Review.
-
Evidence for causal effects of neuropsychiatric conditions on risk of venous thromboembolism: A univariable and multivariable Mendelian randomization study.J Vasc Surg Venous Lymphat Disord. 2024 Nov;12(6):101889. doi: 10.1016/j.jvsv.2024.101889. Epub 2024 Apr 15. J Vasc Surg Venous Lymphat Disord. 2024. PMID: 38621580 Free PMC article. Review.
Cited by
-
Evidence of symptom specificity for depression in multiple sclerosis: A two sample Mendelian randomization study.Mult Scler Relat Disord. 2024 Nov;91:105866. doi: 10.1016/j.msard.2024.105866. Epub 2024 Sep 6. Mult Scler Relat Disord. 2024. PMID: 39276599
-
The causal role of gastroesophageal reflux disease in anxiety disorders and depression: A bidirectional Mendelian randomization study.Front Psychiatry. 2023 Feb 22;14:1135923. doi: 10.3389/fpsyt.2023.1135923. eCollection 2023. Front Psychiatry. 2023. PMID: 36911112 Free PMC article.
-
Identifying the mediating role of socioeconomic status on the relationship between schizophrenia and major depressive disorder: a Mendelian randomisation analysis.Schizophrenia (Heidelb). 2023 Aug 29;9(1):53. doi: 10.1038/s41537-023-00389-2. Schizophrenia (Heidelb). 2023. PMID: 37644044 Free PMC article.
-
COVID-19 and cognitive performance: a Mendelian randomization study.Front Public Health. 2023 Aug 22;11:1185957. doi: 10.3389/fpubh.2023.1185957. eCollection 2023. Front Public Health. 2023. PMID: 37674675 Free PMC article.
-
Genetic liability of gut microbiota for idiopathic pulmonary fibrosis and lung function: a two-sample Mendelian randomization study.Front Cell Infect Microbiol. 2024 May 22;14:1348685. doi: 10.3389/fcimb.2024.1348685. eCollection 2024. Front Cell Infect Microbiol. 2024. PMID: 38841114 Free PMC article.
References
-
- Smith GD, Ebrahim S. Mendelian randomization: Can genetic epidemiology contribute to understanding environmental determinants of disease? Int J Epidemiol. 2003;32(1):1‐22. - PubMed
-
- Lawlor DA, Harbord RM, Sterne JA, Timpson N, Davey Smith G. Mendelian randomization: Using genes as instruments for making causal inferences in epidemiology. Stat Med. 2008;27(8):1133‐1163. - PubMed
-
- Sleiman PM, Grant SF. Mendelian randomization in the era of genomewide association studies. Clin Chem. 2010;56(5):723‐728. - PubMed
-
- Freeman G, Cowling BJ, Schooling CM. Power and sample size calculations for Mendelian randomization studies using one genetic instrument. Int J Epidemiol. 2013;42(4):1157‐1163. - PubMed
MeSH terms
Substances
Grants and funding
LinkOut - more resources
Full Text Sources
Other Literature Sources