

doi: 10.1002/prot.25392.
Epub 2017 Oct 16.
Target highlights from the first post-PSI CASP experiment (CASP12, May-August 2016)
Affiliations
- PMID: 28960539
- PMCID: PMC5820184
- DOI: 10.1002/prot.25392
Item in Clipboard
Target highlights from the first post-PSI CASP experiment (CASP12, May-August 2016)
Proteins.
2018 Mar.
Abstract
The functional and biological significance of the selected CASP12 targets are described by the authors of the structures. The crystallographers discuss the most interesting structural features of the target proteins and assess whether these features were correctly reproduced in the predictions submitted to the CASP12 experiment.
Keywords: CASP; NMR; X-ray crystallography; protein structure prediction.
© 2017 Wiley Periodicals, Inc.
Figures
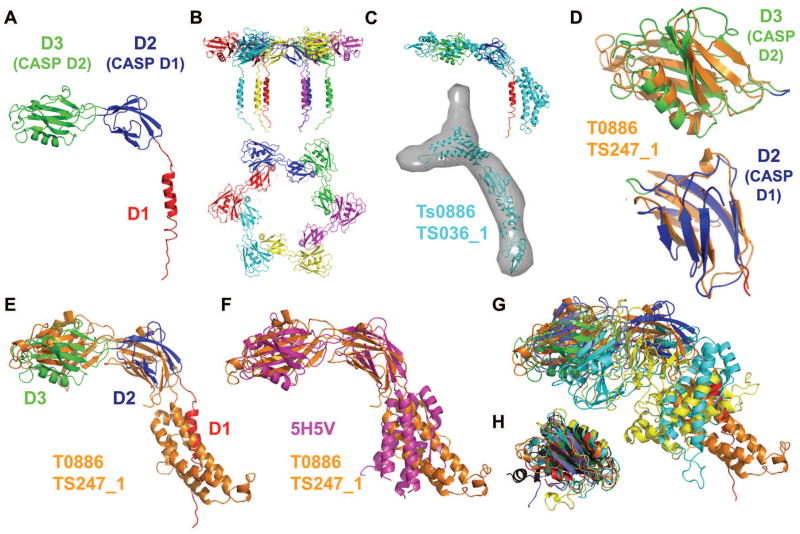
in which the domain D3 (CASP domain D2, green), domain D2 (CASP domain D1, blue) and the helical region (red), which belongs to domain D1 (not evaluated in CASP), are indicated. (B) Side view (top panel) and top view (bottom panel) showing cartoon representations of the hexameric FliD78-405 crystal structure. Each monomer subunit is colored distinctly. (C) SAXS-generated molecular envelope of the monomeric FliD1-474 with the CASP prediction model T0886TS036_1 (cyan). (D) Superposition of CASP prediction models T0886TS247_1_D1 (orange) and T0886TS247_1_D2 (orange) with D2 (CASP domain D1, blue) and D3 (CASP domain D2, green) of the FliD78-405 monomer crystal structure. (E) Superposition of CASP prediction model T0886TS247_1 (orange) with the FliD78-405 monomer crystal structure (domain coloring as in Panel A). (F) Superposition of CASP prediction model T0886TS247_1 (orange) with the E. coli FliD43-416 crystal structure 5H5V (magenta). (G) Superposition of CASP prediction models T0886TS247_1 (orange), T0886TS011_1 (cyan), T0886TS064_1_1 (light blue), T0886TS411_1 (yellow) with the FliD78-405 monomer crystal structure (domain coloring as in Panel A). (H) Superposition of CASP prediction models T0886TS247_1-D2 (orange), T0886TS064_1_1-D2 (light blue), T0886TS011_1-D2 (cyan), T0886TS411_1-D2 (yellow), T0886TS456_1-D2 (dark grey), T0886TS173_1_1-D2 (red) with D3 of the FliD78-405 monomer crystal structure (green).
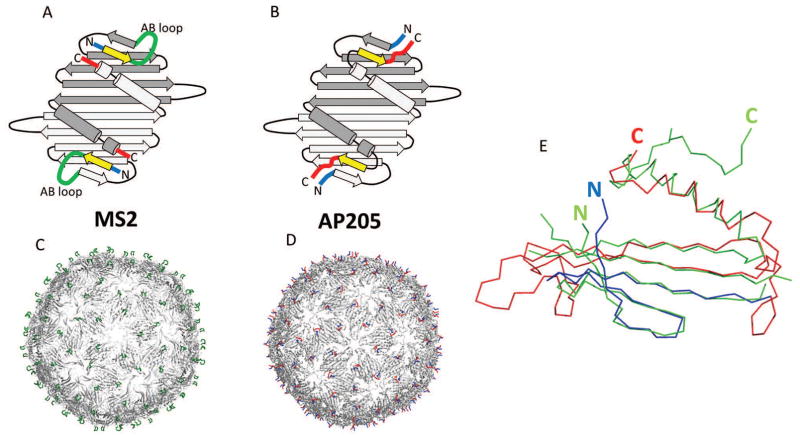
Coat protein in AP205 and related phages, such as MS2, builds very stable dimers. Two monomers are shown in different shades of grey (panels A and B). Notice the close proximity of N- (blue) and C- (red) termini in dimers. 90 dimers further assemble into VLPs (panels C and D). In MS2, AB loop (green) is the most exposed structure on the surface of VLPs. Compared to MS2, in AP205 the first β-strand (yellow) is shifted to the C-terminus, although it remains in the same position in 3D. As a result, in AP205, C-and N- termini are the most exposed features on VLPs. In panel (E), crystal structure of AP205 monomer (green) is superimposed with the modeled structure (blue and red). The overall fold of model is approximately correct, except that it lacks C-terminal β-strand. Residues 1-39 (blue) are correctly placed in respect to the sequence, corresponding to the first four β-strands. For the rest of model (red) residues are placed incorrectly according to the sequence and out-of-register errors occur. Notice also that position of N-terminus is relatively well predicted, while C-terminus is in a very different position.
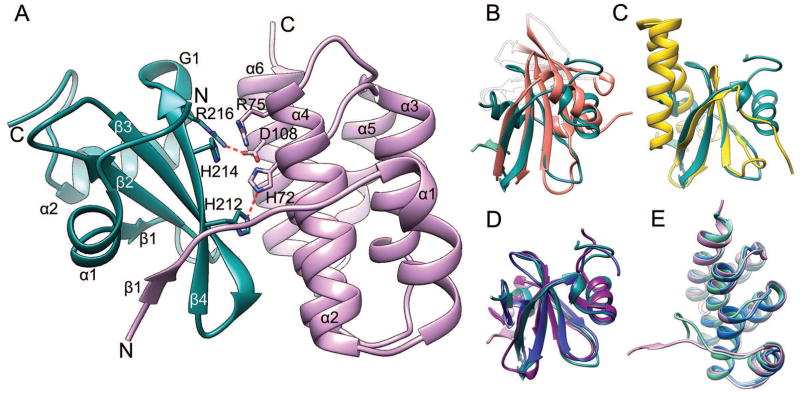
(A) Experimental structure with the most conserved residues and their interactions shown in stick representation. The CdiA-CT toxin domain is shown in teal and the CdiI immunity protein in pink. Hydrogen bonds are depicted as red broken lines. Superposition of CdiA-CT with (B) the closest PDB homolog, inorganic triphosphatase (coral, PDB:3TYP), (C) with ParE toxin from E. coli (yellow, PDB:3KXE) and (D) with model T0884TS183_1 (purple) and refined model TR884TS118_1 (blue). The strand β1 from CdiI is shown for reference. (E) Superposition of CdiI with model T0885TS005_2 (cyan) and refined model TR885TS247_1 (blue).
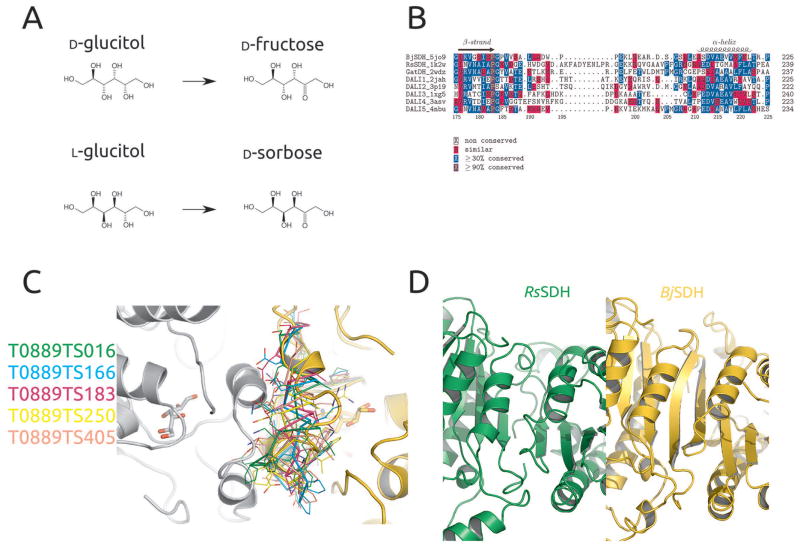
(A) Products of reaction catalyzed by BjSDH with D-glucitol and L-glucitol as substrates; (B) Structure based sequence alignment of region around loop 193-203 covering the active site of BjSDH. Sequences of GatDH, RsSDH and top 5 DALI hits searching with the BjSDH structure are shown; (C)
BjSDH structure shown as cartoon (gold) and symmetry related molecule packing against is (grey). Ligands in the structure are shown as sticks, while loop 193-203 in top 5 models from CASP12 are shown as lines; (D) Continuous β-sheet between two monomers in BjSDH crystal structure, and same region in the RsSDH crystal structure.
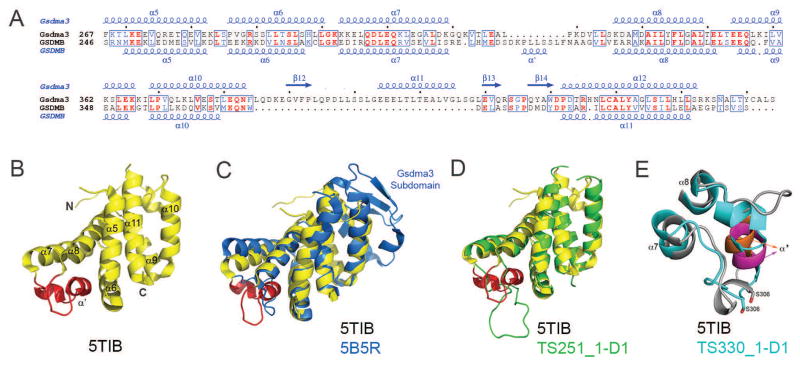
(A) Structure-based sequence alignment of the GSDMB (T0948 comprises GSDMB’s C-terminal domain) and mouse Gsdma3 C-terminal domains with secondary structure elements shown above or below the respective sequences. Identical and conservatively replaced residues are colored in red and blue. The alignment was performed using the programs Clustal Omega and ESPript 3 (espript.ibcp.fr/Espript/). (B) Ribbon diagram of the GSDMB_C fold (PDB 5TIB). The α7–α8 GSDMB loop containing the polymorphism residues is colored in red. (C) Superposition of the experimental GSDMB_C structure (colored yellow) and the corresponding Gsdma3 domain that served as a modeling template (blue, 5B5R), (D) Superposition of the experimental GSDMB_C structure (colored yellow) and the best GTD_TS CASP12 scored model of group 251 (green). (E) Superposition of the polymorphism loop of the experimental structure (colored gray with α′ highlighted in orange) with the corresponding loop assessed as the closest (Group 330) based on the position specific criterion (colored cyan with α′ highlighted in magenta).
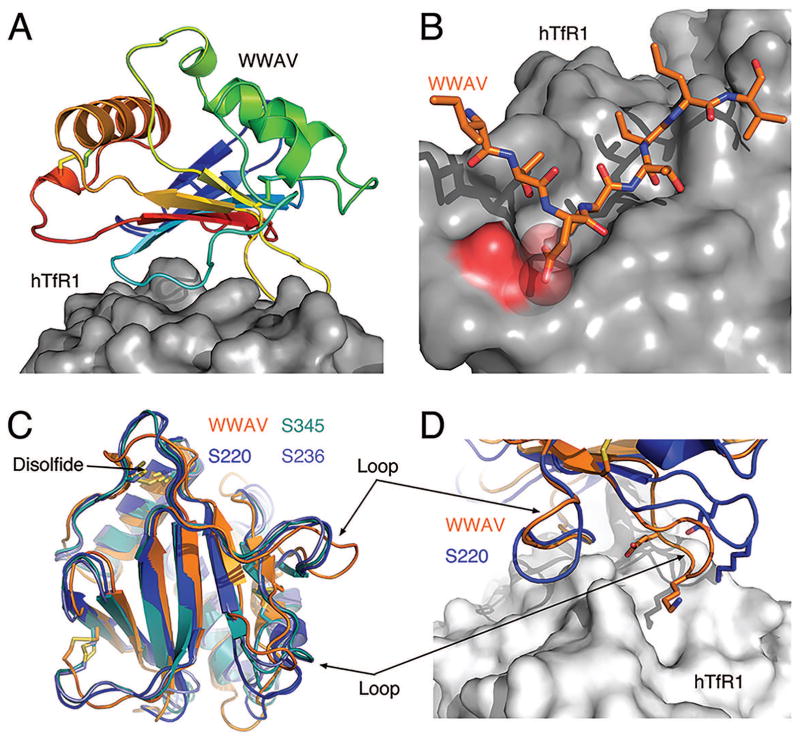
(A): Ribbon diagrams of the WWAV-GP1 colored in rainbow and shown in a putative complex with hTfR1 (surface representation) (PDB ID: 3KAS). (B): A potential charge-repulsion between two negatively charged groups on WWAV and hTfR1 that was identified using this analysis. (C): Comparison of the top three models from ‘MULTICOM-construct’, ‘MULTICOM-novel’, and ‘GOAL’ (designated S236, S345, and S220, respectively) with WWAV-GP1. (D): A close-up view comparing the loops of WWAV-GP1 that interact with hTfR1 to the top model. Structures were rendered using PyMOL (www.pymol.org ).
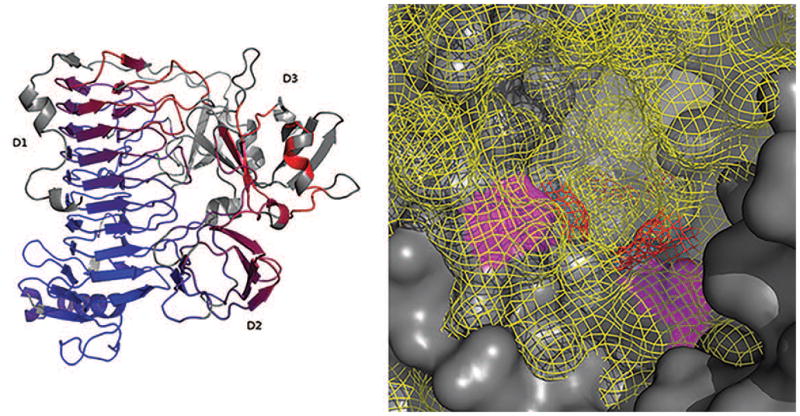
(5MPQ, chain A) aligned with T0912TS349_1 in pymol (sequence alignment followed by structural superposition with Cα atoms only). Residues are colored by a RMSD gradient (dark blue is a good alignment and red are higher deviations). Residues not used are colored grey. The domain are labelled D1 to D3. (B): Binding pocket surface representation. The predicted model (T0912TS303_1) surface is represented in solid dark grey and the PDB model surface in yellow mesh. The putative catalytic residues in the predicted model are colored magenta and red in the PDB model.
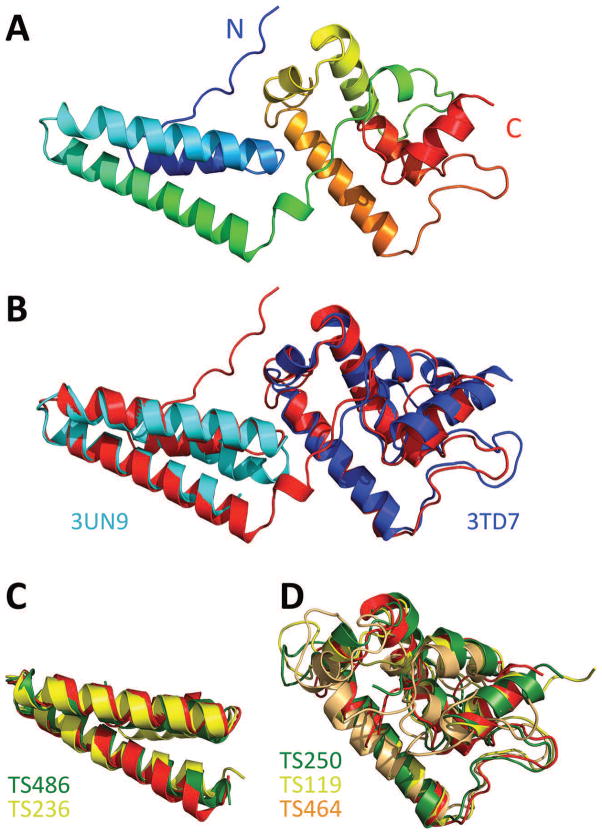
(A) The full crystal structure in cartoon representation. (B) The crystal structure (red) superimposed with the best DALI matches for the N-terminal (PDB: 3UN9; DALI Z-score 7.5) and the C-terminal domain (PDB: 3TD7; DALI Z-score 10.1). (C) The two best CASP predictions for the N-terminal domain (D1), models T0890TS236_1 (MULTICOM-construct) and T0890TS486_1 (TASSER), yielded a GDT_TS of 68.0 and 67.7 for D1 and of 30.0 and 31.8 for the whole structure. (D) The best CASP predictions for the C-terminal domain (D2). T0890TS250_1 (Seok-server) yielded a GDT_TS of 74.8 for D2 and 44.7 for the whole structure. T0890TS119_1 represents the three almost identical models T0890TS119_1 (HHPred0), T0890TS349_1 (HHPred1) and T0890TS313_1 (HHGG), which yielded a GDT_TS of 69.8, 69.8 and 70.5 for D2 and of 40.8, 40.8 and 41.0 for the whole structure. T0890TS464_1 (tsspred2) yielded a GDT_TS of 59.2 for D2 and 33.4 for the whole structure.
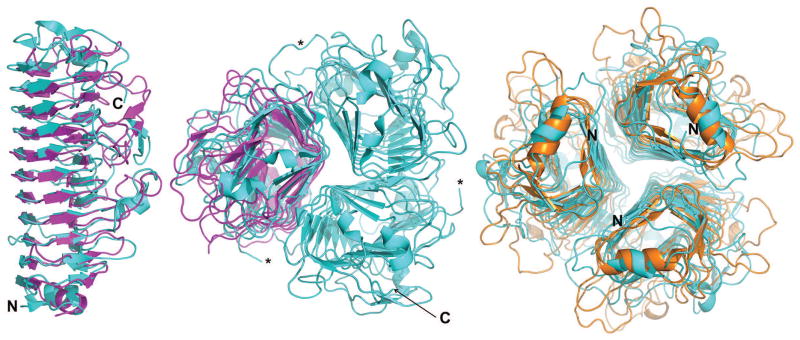
Superposition of one of the best predicted regular (monomeric) models (T0909TS303_1, magenta) onto a monomer (left; side view) and the trimer (middle; top view, C-termini closest to the reader) of the experimentally determined structure (cyan). On the right, one of the best predicted trimeric models (T0909TS247_1o, orange) is shown viewed from the bottom, N-termini closest to the reader. Chain termini are indicated where possible and a loop that is disordered in two monomers of the trimer in the crystal structure is highlighted by asterisks.
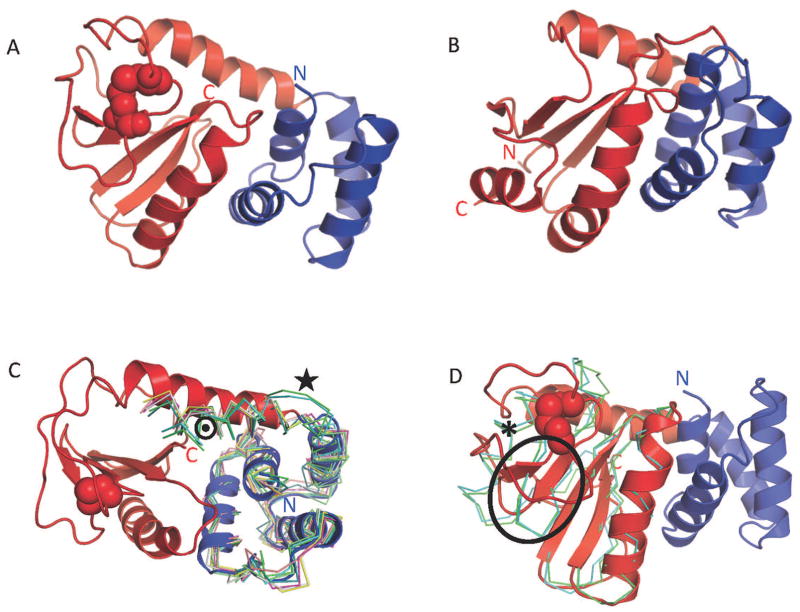
(A) In blue, the CtUGGT TRXL1 N-terminal α-helical subdomain (residues 43-110). In red, the TRXL1 thioredoxin subdomain (residues 111-216). The disulphide bridge C138-C150 is represented as spheres. (B) The structure of the closest structural homologue to CtUGGT TRXL1, Staphylococcus aureus DsbA, with the α-helical insertion subdomain (residues 63-129) in blue and the thioredoxin subdomain (residues 14-62 and 130-177) in red. In (A) and (B) N- and C-termini are denoted by the letters “N” and “C”, respectively. (C) The superposition of the top ten CASP12 T0892 models, overlayed on the CtUGGT TRXL1 crystal structure in the region of the N-terminal helical subdomain and the first helix of the thioredoxin subdomain. The CtUGGT TRXL1 crystal structure is colored and represented as in panel A. The top ten CASP12 T0892 models are in ribbon representation and colored as follows: T0892TS011_1:green; T0892TS011_2: cyan; T0892TS017_1: magenta; T0892TS017_2: yellow; T0892TS017_5: grey; T0892TS411_2; T0892TS017_3: salmon pink; T0892TS079_5: violet; T0892TS479_3: steel blue; T0892TS320_4: orange. A black star marks the hinge between the helical subdomain and the thioredoxin subdomain. A dotted circle marks the first helix in the thioredoxin subdomain. (D) The superposition of the top two CASP12 T0892 models (T0892TS011_1 and T0892TS011_2, in green and cyan respectively, in ribbon representation), overlayed on the CtUGGT TRXL1 crystal structure in the region of the C-terminal thioredoxin subdomain, without its first α-helix. The CtUGGT TRXL1 crystal structure is colored and represented as in panel A. The wrongly predicted first two strands of the thioredoxin subdomain are circled, and an asterisk marks the incorrectly predicted α-helix for the stretch of residues 151-164 of CtUGGT TRXL1.
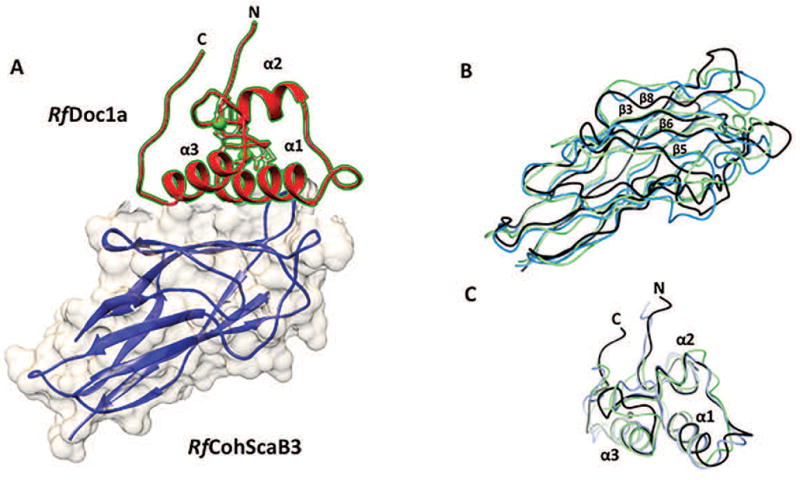
(A) Structure of RfCohScaB3-Doc1a complex with the dockerin in red and the cohesin in blue. The dockerin N- and C- terminus and the α-helices are labeled, and a transparent gray molecular surface of the cohesin is shown. (B) Superposition of CASP12 prediction models T0921TS220_2_D1 (light blue) and T0921TS166_1_D1 (light green) with RfCohScaB3 crystal structure (black). (C) Superposition of CASP12 prediction models T0922TS005_3_D1 (light blue) and T0922TS077_4_D1 (light green) with the RfDoc1a crystal structure (black). Ca2+ ions are depicted as green spheres.
References
-
- Kryshtafovych A, Moult J, Bartual SG, Bazan JF, Berman H, Casteel DE, Christodoulou E, Everett JK, Hausmann J, Heidebrecht T, Hills T, Hui R, Hunt JF, Seetharaman J, Joachimiak A, Kennedy MA, Kim C, Lingel A, Michalska K, Montelione GT, Otero JM, Perrakis A, Pizarro JC, van Raaij MJ, Ramelot TA, Rousseau F, Tong L, Wernimont AK, Young J, Schwede T. Target highlights in CASP9: Experimental target structures for the critical assessment of techniques for protein structure prediction. Proteins. 2011;79(Suppl 10):6–20. - PMC - PubMed
-
- Kryshtafovych A, Moult J, Bales P, Bazan JF, Biasini M, Burgin A, Chen C, Cochran FV, Craig TK, Das R, Fass D, Garcia-Doval C, Herzberg O, Lorimer D, Luecke H, Ma X, Nelson DC, van Raaij MJ, Rohwer F, Segall A, Seguritan V, Zeth K, Schwede T. Challenging the state of the art in protein structure prediction: Highlights of experimental target structures for the 10th Critical Assessment of Techniques for Protein Structure Prediction Experiment CASP10. Proteins. 2014;82(Suppl 2):26–42. - PMC - PubMed
-
- Kryshtafovych A, Moult J, Basle A, Burgin A, Craig TK, Edwards RA, Fass D, Hartmann MD, Korycinski M, Lewis RJ, Lorimer D, Lupas AN, Newman J, Peat TS, Piepenbrink KH, Prahlad J, van Raaij MJ, Rohwer F, Segall AM, Seguritan V, Sundberg EJ, Singh AK, Wilson MA, Schwede T. Some of the most interesting CASP11 targets through the eyes of their authors. Proteins. 2016;84(Suppl 1):34–50. - PMC - PubMed
-
- Duan Q, Zhou M, Zhu L, Zhu G. Flagella and bacterial pathogenicity. J Basic Microbiol. 2013;53(1):1–8. - PubMed
Publication types
MeSH terms
Substances
Grants and funding
LinkOut - more resources
Full Text Sources
Other Literature Sources
Molecular Biology Databases
