. 2018 Jan;39(1):157-170.
doi: 10.1002/hbm.23833. Epub 2017 Sep 28.

A multisample study of longitudinal changes in brain network architecture in 4-13-year-old children

Affiliations

A multisample study of longitudinal changes in brain network architecture in 4-13-year-old children

Lara M Wierenga et al. Hum Brain Mapp. 2018 Jan.

Abstract

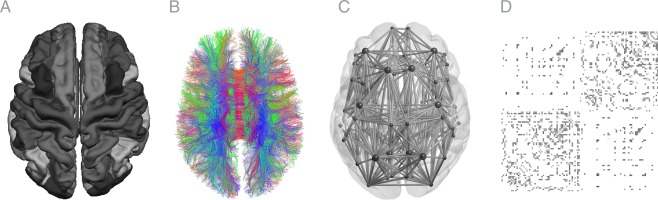
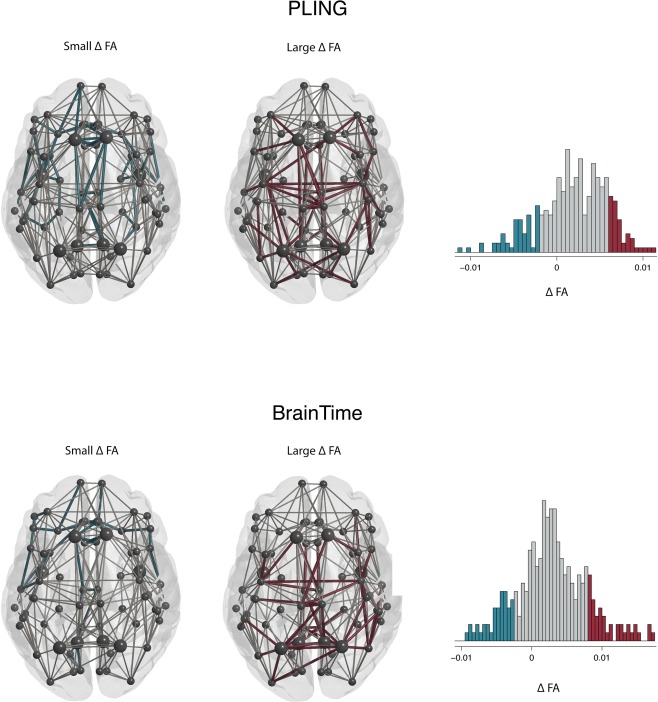
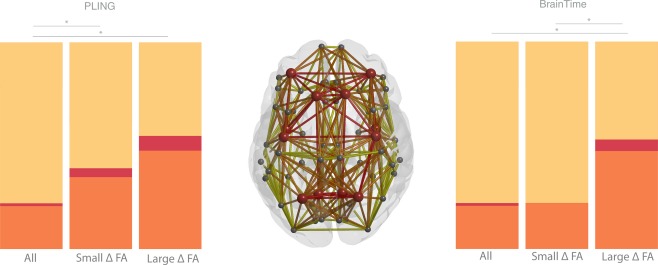
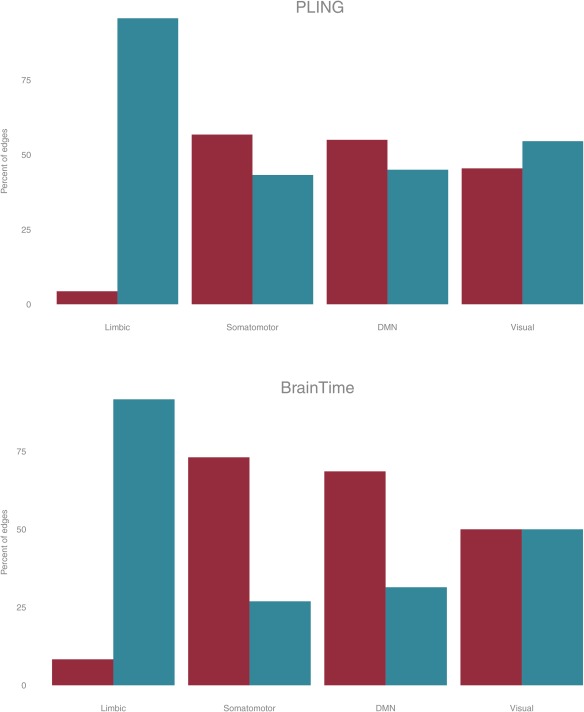
Recent advances in human neuroimaging research have revealed that white-matter connectivity can be described in terms of an integrated network, which is the basis of the human connectome. However, the developmental changes of this connectome in childhood are not well understood. This study made use of two independent longitudinal diffusion-weighted imaging data sets to characterize developmental changes in the connectome by estimating age-related changes in fractional anisotropy (FA) for reconstructed fibers (edges) between 68 cortical regions. The first sample included 237 diffusion-weighted scans of 146 typically developing children (4-13 years old, 74 females) derived from the Pediatric Longitudinal Imaging, Neurocognition, and Genetics (PLING) study. The second sample included 141 scans of 97 individuals (8-13 years old, 62 females) derived from the BrainTime project. In both data sets, we compared edges that had the most substantial age-related change in FA to edges that showed little change in FA. This allowed us to investigate if developmental changes in white matter reorganize network topology. We observed substantial increases in edges connecting peripheral and a set of highly connected hub regions, referred to as the rich club. Together with the observed topological differences between regions connecting to edges showing the smallest and largest changes in FA, this indicates that changes in white matter affect network organization, such that highly connected regions become even more strongly imbedded in the network. These findings suggest that an important process in brain development involves organizing patterns of inter-regional interactions. Hum Brain Mapp 39:157-170, 2018. © 2017 Wiley Periodicals, Inc.

Keywords: DWI; MRI; brain development; brain network; graph theory.


Figures

Figure 1
Figure 1
Representation of reconstructed anatomical parcellation of freesurfer (A), DWI streamlines (B), and graph representation (C) for one representative subject of the BrainTime dataset. D shows a single‐subject connectome as a connectivity matrices with rows and columns depicting source ( i) and target regions ( j). Pathways are grouped by hemisphere colors represent mean FA values ranging from 0.1 (grey) to 0.7 (black). [Color figure can be viewed at http://wileyonlinelibrary.com]
Figure 2
Figure 2
Connected components of largest (red) and smallest changes (blue) in FA frontal lobe at the top of the image. The PLING dataset is represented in the top row and the BrainTime dataset in the bottom row. Nodes (circles) and edges (lines) are displayed for the reconstructed thresholded group averaged brain networks. The histogram shows βage values for all edges in the group network. Edges that showed an age‐related change of 1 SD smaller than the mean change in FA are displayed in blue (small Δ FA). Connections larger than 1 SD above mean change in FA are displayed in red (large Δ FA). The largest two connected components were selected for both sets of edges. Rich‐club nodes are represented by large circles. [Color figure can be viewed at http://wileyonlinelibrary.com]
Figure 3
Figure 3
Percentage of anatomical distribution of rich club, feeder, and local edges in red, orange, and yellow, respectively. The middle graph shows a schematic representation of the group averaged reconstructed brain network. Nodes (circles) represent brain regions where rich club nodes are indicated by red circles. The bar graphs on the left (PLING set) and right (BrainTime set) indicate that a larger proportion of feeder and hub edges and a smaller proportion of peripheral edges were observed in the edges showing large age‐related changes in FA (large Δ FA) compared to the distribution of edges showing the smallest change in FA (small Δ FA) and compared to the distribution of edge categories for all possible edges. [Color figure can be viewed at http://wileyonlinelibrary.com]
Figure 4
Figure 4
Subnetworks for the PLING (top) and BrainTime (bottom) datasets showing percentage of edges that had large change (dark grey/red) and small changes (light grey/blue) in FA connecting to nodes in one of the following subnetwork: cortical limbic network, somato‐motor network, default mode network, and visual network (left to right). [Color figure can be viewed at http://wileyonlinelibrary.com]

References

    1. Achterberg M, Peper JS, van Duijvenvoorde ACK, Mandl RCW, Crone EA (2016): Frontostriatal white matter integrity predicts development of delay of gratification: A longitudinal study. J Neurosci 36:1954–1961 - PMC - PubMed
    1. Andersson JLR, Skare S (2002): A model‐based method for retrospective correction of geometric distortions in diffusion‐weighted EPI. NeuroImage 16:177–199. - PubMed
    1. Baker STE, Lubman DI, Yucel M, Allen NB, Whittle S, Fulcher BD, et al. (2015): Developmental changes in brain network hub connectivity in late adolescence. J Neurosci 35:9078–9087. - PMC - PubMed
    1. Ball G, Aljabar P, Zebari S, Tusor N, Arichi T, Merchant N, et al. (2014): Rich‐club organization of the newborn human brain. Proc Natl Acad Sci 111:7456–7461. - PMC - PubMed
    1. Basser PJ, Pierpaoli C (1996): Microstructural and physiological features of tissues elucidated by quantitative‐diffusion‐tensor MRI. J Magn Reson B 111:209–219. - PubMed

Publication types