. 2017 Nov 8;12(21):1794-1809.
doi: 10.1002/cmdc.201700572. Epub 2017 Oct 23.

Mimicking Intermolecular Interactions of Tight Protein-Protein Complexes for Small-Molecule Antagonists

Affiliations

Mimicking Intermolecular Interactions of Tight Protein-Protein Complexes for Small-Molecule Antagonists

David Xu et al. ChemMedChem. .

Abstract

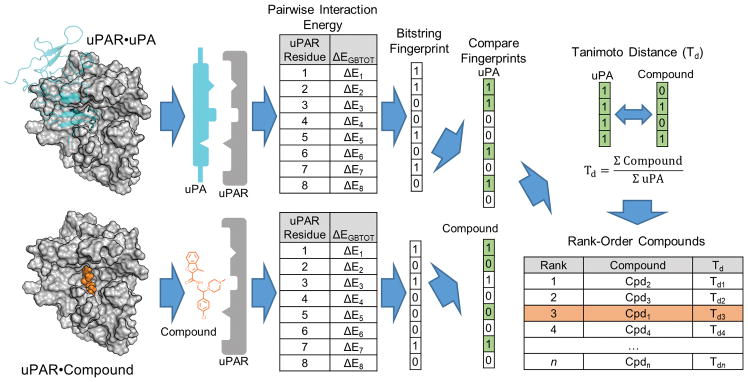
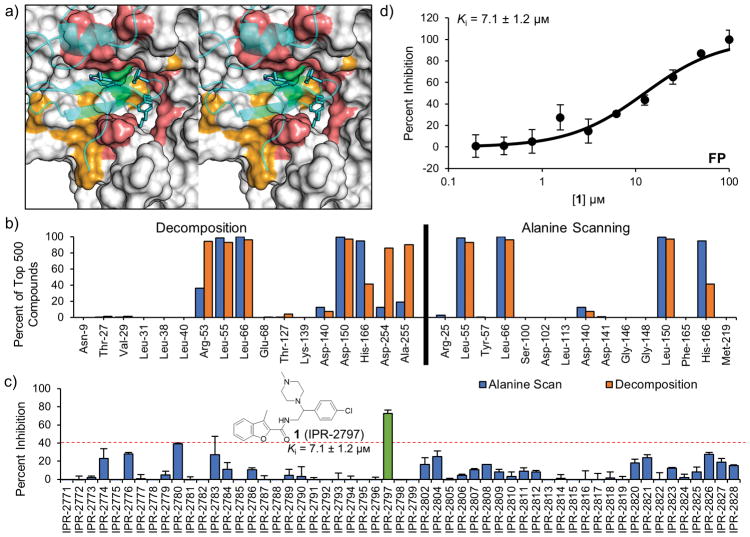
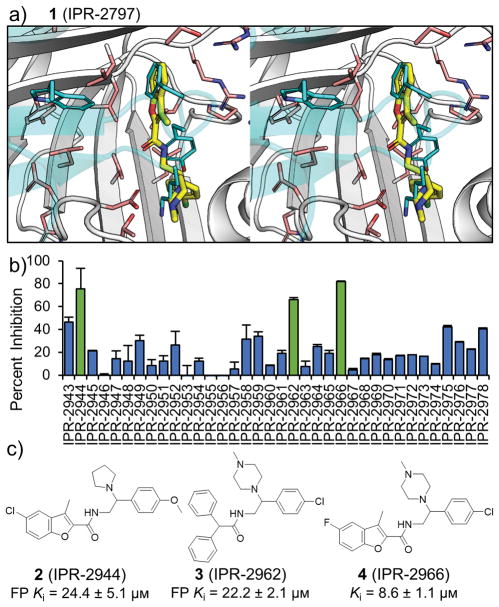
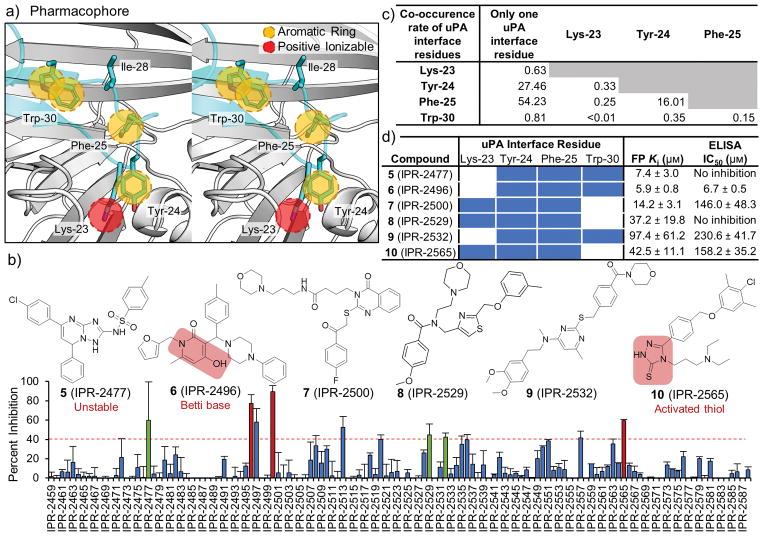
Tight protein-protein interactions (Kd <100 nm) that occur over a large binding interface (>1000 Å2 ) are highly challenging to disrupt with small molecules. Historically, the design of small molecules to inhibit protein-protein interactions has focused on mimicking the position of interface protein ligand side chains. Here, we explore mimicry of the pairwise intermolecular interactions of the native protein ligand with residues of the protein receptor to enrich commercial libraries for small-molecule inhibitors of tight protein-protein interactions. We use the high-affinity interaction (Kd =1 nm) between the urokinase receptor (uPAR) and its ligand urokinase (uPA) to test our methods. We introduce three methods for rank-ordering small molecules docked to uPAR: 1) a new fingerprint approach that represents uPA's pairwise interaction energies with uPAR residues; 2) a pharmacophore approach to identify small molecules that mimic the position of uPA interface residues; and 3) a combined fingerprint and pharmacophore approach. Our work led to small molecules with novel chemotypes that inhibited a tight uPAR⋅uPA protein-protein interaction with single-digit micromolar IC50 values. We also report the extensive work that identified several of the hits as either lacking stability, thiol reactive, or redox active. This work suggests that mimicking the binding profile of the native ligand and the position of interface residues can be an effective strategy to enrich commercial libraries for small-molecule inhibitors of tight protein-protein interactions.

Keywords: protein-protein interactions; small molecules; urokinase receptor; virtual screening.


Figures

Figure 1
Figure 1
Workflow for the fingerprint method used to identify compounds that mimic the intermolecular binding interactions in the uPAR•uPA complex. The per-residue interaction energies of docked compounds are compared to those of the native protein ligand uPA. These interaction energies are used to generate a bitwise fingerprint, where each position on the fingerprint corresponds to the interaction energy between uPAR and the compound of interest. This fingerprint is compared to fingerprints of the native ligand uPA. Compounds are rank-ordered based on their Tanimoto distance with the fingerprints of uPA and total interaction energy ΔEGBTOT.
Figure 2
Figure 2
A virtual screen utilizing the interface residues of uPAR and validation of hits. a) Residues used in the uPAR fingerprints are colored on the surface of uPAR as follows: (i) Experimental alanine scan (orange), (ii) decomposition (pink), (iii) both (green). uPA is transparently overlaid in cartoon, with the side chain of interface residues in stick. b) Among the top-ranking 500 compounds from each of the fingerprints generated from decomposition energies or experimental alanine scanning, the proportion of compounds that overlap with each fingerprint residue. c) Single-concentration FP screen of compounds resulting from the virtual screen based on uPAR residues. Each compound was screened in duplicate at 50 μM concentration (mean ± SD). Hit compound 1 (IPR-2797) is highlighted in green. d) Concentration-dependent FP assay measuring the inhibition of uPAR•AE147-FAM peptide interaction by 1 (IPR-2797). Representative of at least two independent experiments, where each concentration point is measured in duplicates (mean ± SD).
Figure 3
Figure 3
Screening the derivatives of compound 1 (IPR-2797). a) The binding mode of 1 in the uPAR•uPA binding pocket. The compound is shown in yellow. uPAR is shown in white cartoon, with the side chain of interface residues shown in pink stick. uPA is shown in partial transparent cyan cartoon. The side chain of four interface residues on uPA are shown in stick and colored cyan. b) Derivatives of 1 were screened at a single 50 μM concentration via the uPAR•AE147-FAM peptide FP assay in duplicates (mean ± SD). Further pursued hits are highlighted in green. c) Chemical structures of the pursued derivative hits.
Figure 4
Figure 4
A virtual screen utilizing four interface residues of uPA and validation of hits. a) Features of the pharmacophore model used to identify compounds that overlap with and mimic the interface residues of uPA. uPAR is shown in the background colored in white and shown in cartoon. uPA is shown in transparent cyan cartoon, with the five interface residues shown in stick. A pharmacophore model was used to assign features to four of the five interface residues (Ile-28 was excluded). The amine on the side chain of Lys-23 was assigned a positive ionizable feature (transparent red circle), while the aromatic rings of Tyr-24, Phe-25, and Trp-30 were assigned aromatic ring features (transparent yellow circles). Two separate pharmacophore features were assigned to each of the two rings on the indole on Trp-30. b) Single-concentration FP screen of compounds resulting from the virtual screen based on uPA interface residues. Each compound was screened in duplicate at 50 μM concentration (mean ± SD). Hits that are followed up are highlighted in green while those with problematic moieties are highlighted in red. Chemical structures of the highlighted molecules are shown above. c) Co-occurrence of interface residues among all compounds that overlapped with at least one residues on uPA. d) Overlap between the predicted binding mode of the hit molecules and the uPA residues are highlighted. FP and microtiter ELISA assays were used to measure the Ki and IC50 of the compounds in inhibiting uPAR•AE147-FAM peptide and uPAR•uPAATF interactions, respectively. Results are based on at least two independent concentration-dependent experiments where each concentration point was measured in duplicates (mean ± SD).
Figure 5
Figure 5
Screening the derivatives of compounds 8 (IPR-2529) and 9 (IPR-2532). a) The virtual screening binding mode of 8 in the uPAR•uPA binding pocket. The compound is shown in yellow. uPAR is shown in white cartoon, with the side chain of interface residues shown in pink stick. uPA is shown in partial transparent cyan cartoon. The side chain of four interface residues on uPA are shown in stick and colored cyan. b) Derivatives of 8 were screened at a single 50 μM concentration via FP assay in duplicates (mean ± SD). Further pursued hits are highlighted in green. c) Chemical structures of the pursued derivative hits of 8. d) The virtual screening binding mode of 9 (IPR-2532) in the uPAR•uPA binding pocket. The compound is shown in yellow. uPAR is shown in white cartoon, with the side chain of interface residues shown in pink stick. uPA is shown in partial transparent cyan cartoon. The side chain of four interface residues on uPA are shown in stick and colored cyan. e) Derivatives of 9 were screened at a single 50 μM concentration via FP assay in duplicates (mean ± SD). Further pursued hits are highlighted in green. f) Chemical structures of the pursued derivative hits of 9.
Figure 6
Figure 6
A virtual screen utilizing interface residues on both uPAR and uPA. a) Single-concentration FP screen of compounds resulting from the virtual screen based on uPA interface residues. Each compound was screened in duplicate at 50 μM concentration (mean ± SD). Hits that are pursued are highlighted in green while those with problematic moieties are highlighted in red. Chemical structures of the highlighted molecules are shown above. b) Overlap between the predicted binding mode of the hit molecules and the uPA interface residues are highlighted. FP and microtiter ELISA assays were used to measure the Ki and IC50 of the compounds in inhibiting uPAR•AE147-FAM peptide and uPAR•uPAATF interactions, respectively. Results are based on at least two independent concentration-dependent experiments where each concentration point was measured in duplicates (mean ± SD).
Figure 7
Figure 7
Testing the derivatives of 26 (IPR-2992) leads to 30 (IPR-3011). a) The binding mode of 26 (IPR-2992) and 30 (IPR-3011) in the uPAR•uPA binding pocket. The binding mode of 30 (green) is overlaid on the binding mode of 26 (yellow). The additional ring at R1 allows 30 to bind deeper in the uPAR•uPA pocket. uPAR is shown in white cartoon, with the side chain of interface residues shown in pink stick. b) The core of 26 was used to identify analogs at 5 positions. Among the analogs discovered was 30 (IPR-3011). c) Derivatives of 26 were screened at a single 50 μM concentration via the uPAR•AE147-FAM peptide FP assay in duplicates (mean ± SD). The parent compound 26 is highlighted in orange, while compound 30 is highlighted in green. d) Concentration-dependent FP assay measuring the inhibition of uPAR•AE147-FAM peptide interaction by 26 and 30. Representative of at least two independent concentration-dependent experiments where each concentration point was measured in duplicates (mean ± SD). At high concentrations, 30 was insoluble and as such the data points were omitted from curve-fitting. e) Concentration-dependent ELISA assay measuring inhibition of uPAR•uPAATF interaction by 26 and 30. Representative of at least two independent concentration-dependent experiments where each concentration point was measured in duplicates (mean ± SD). At high concentrations, 30 was insoluble and as such the data points were omitted from curve-fitting. f) MST experiment was performed with 40 nM NT-495-labeled uPAR and varying concentrations of 26. A representative MST concentration-response curve of the interaction between uPAR and 26 are shown. Two independent experiments were performed in triplicates (mean ± SD). g) MST experiment was performed with 40 nM NT-495-labeled uPAR and varying concentrations of 30. A representative MST concentration-response curve of the interaction between uPAR and 30 are shown. Two independent experiments were performed in triplicates (mean ± SD). At high concentrations, 30 is insoluble and the high concentration points, in light orange, are omitted from curve fitting.
Figure 8
Figure 8
Screening the derivatives of compound 28 (IPR-3089) and 29 (IPR-3193). a) The virtual screening binding mode of 28 in the uPAR•uPA binding pocket. The compound is shown in yellow. uPAR is shown in white cartoon, with the side chain of interface residues shown in pink stick. uPA is shown in partial transparent cyan cartoon. The side chain of four interface residues on uPA are shown in stick and colored cyan. b) Derivatives of 28 were screened at a single 50 μM concentration via FP assay in duplicates (mean ± SD). Further pursued hits are highlighted in green. c) Chemical structures of the pursued derivative hits of 28. Ki values are based on two independent concentration-dependent inhibition assays performed in duplicates (mean ± SD). d) The virtual screening binding mode of 29 in the uPAR•uPA binding pocket. The compound is shown in yellow. uPAR is shown in white cartoon, with the side chain of interface residues shown in pink stick. uPA is shown in partial transparent cyan cartoon. The side chain of four interface residues on uPA are shown in stick and colored cyan. e) Derivatives of 29 were screened at a single 50 μM concentration via FP assay in duplicates (mean ± SD). Further pursued hits are highlighted in green. f) Chemical structures of the pursued derivative hits of 29. Ki values are based on two independent concentration-dependent inhibition assays performed in duplicates (mean ± SD).

Similar articles

Cited by

References

    1. Bahadur RP, Chakrabarti P, Rodier F, Janin J. J Mol Biol. 2004;336(4):943–955. - PubMed
    1. Perkins JR, Diboun I, Dessailly BH, Lees JG, Orengo C. Structure. 2010;18(10):1233–1243. - PubMed
    1. Smith MC, Gestwicki JE. Expert Rev Mol Med. 2012;14:e16. - PMC - PubMed
    1. Arkin MR, Tang Y, Wells JA. Chem Biol. 2014;21(9):1102–1114. - PMC - PubMed
    1. Kastritis PL, Moal IH, Hwang H, Weng Z, Bates PA, Bonvin AM, Janin J. Protein Sci. 2011;20(3):482–491. - PMC - PubMed

Publication types

MeSH terms

Substances

LinkOut - more resources