. 2017 Sep 29;15(9):e2002623.
doi: 10.1371/journal.pbio.2002623. eCollection 2017 Sep.

Transcriptome analysis of hypoxic cancer cells uncovers intron retention in EIF2B5 as a mechanism to inhibit translation

Affiliations

Transcriptome analysis of hypoxic cancer cells uncovers intron retention in EIF2B5 as a mechanism to inhibit translation

Lauren K Brady et al. PLoS Biol. .

Abstract

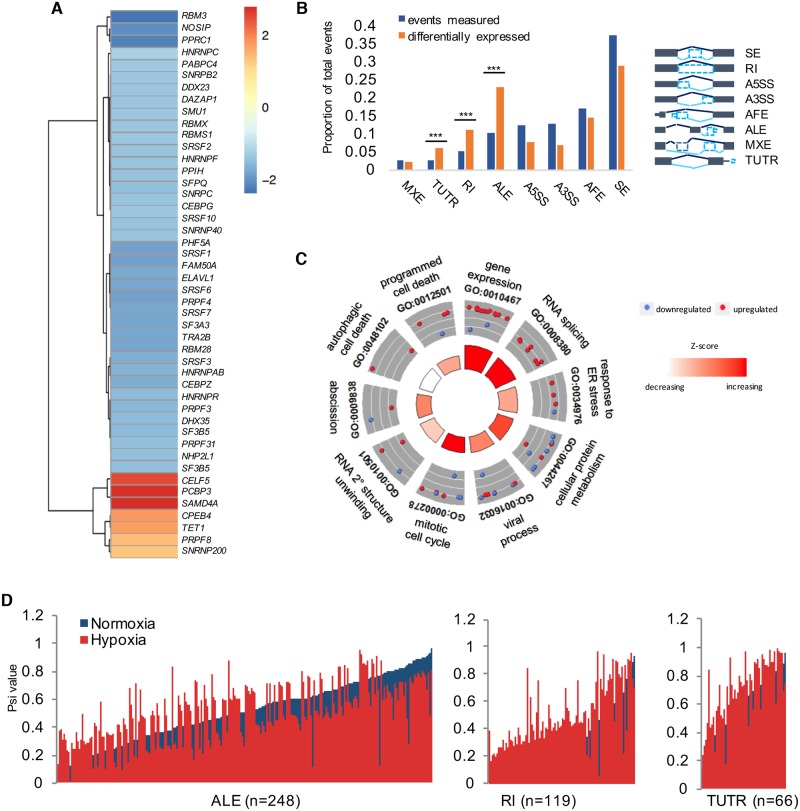
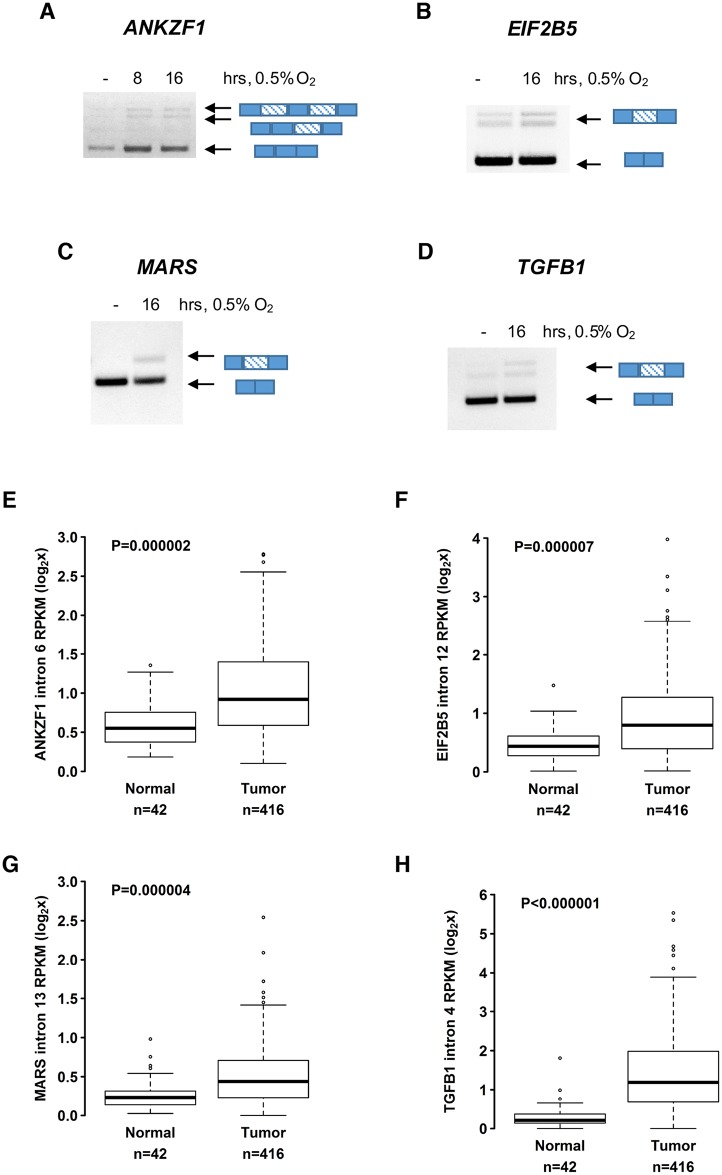
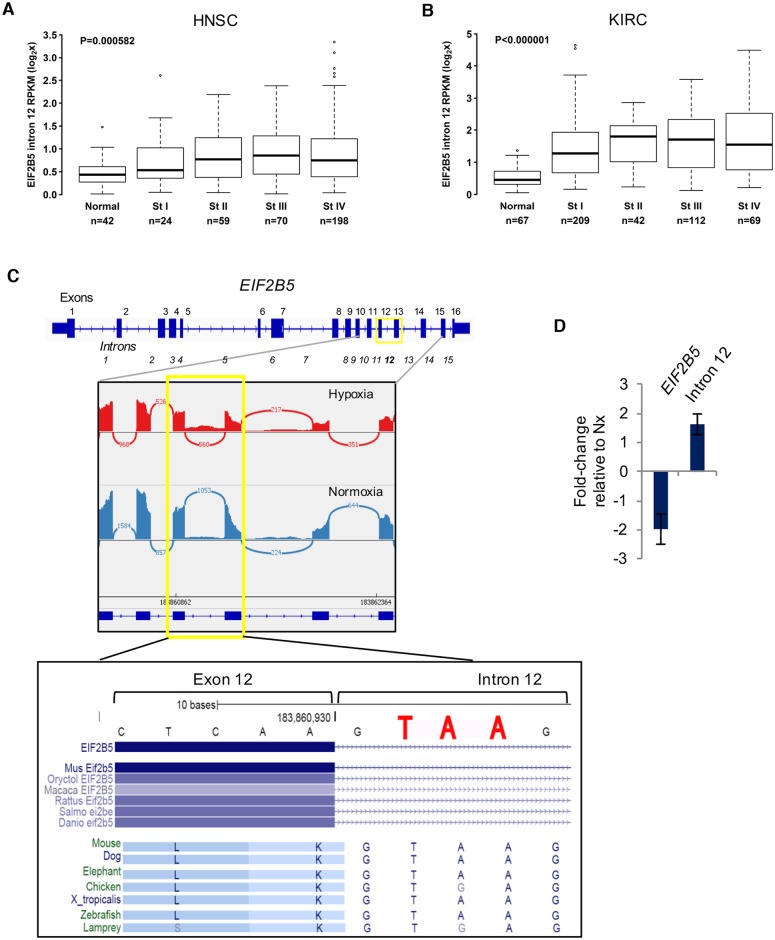
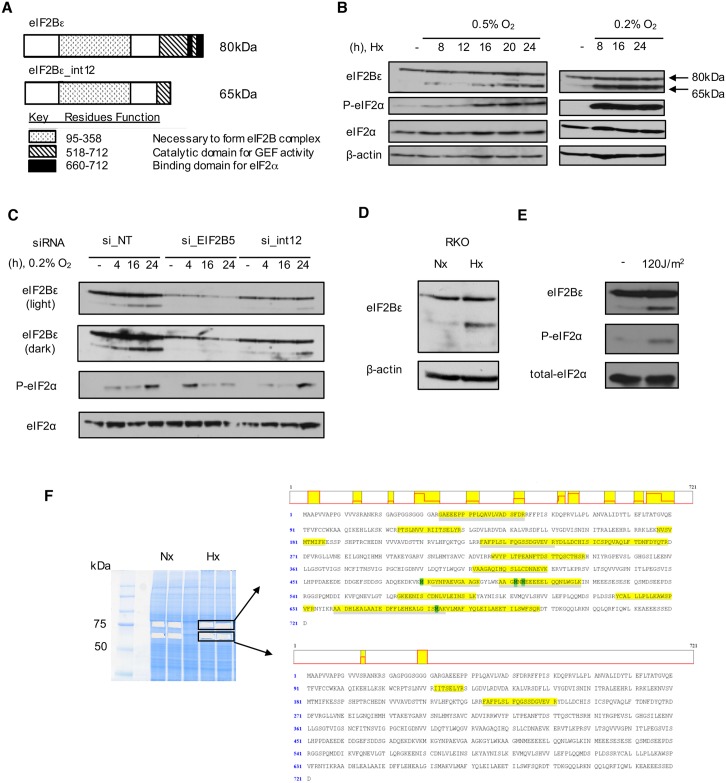
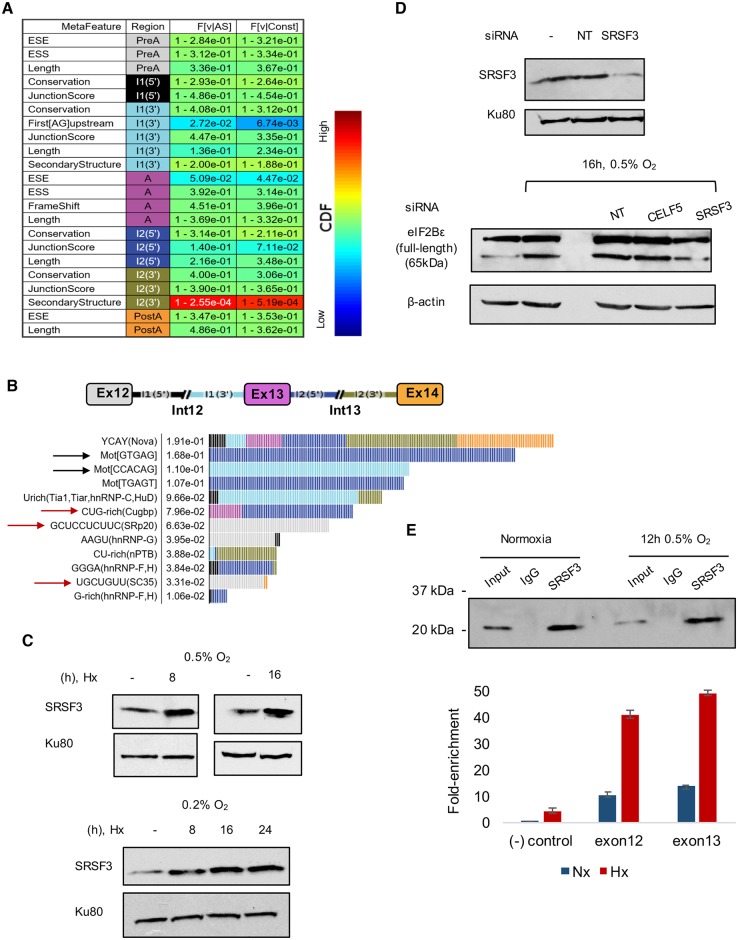
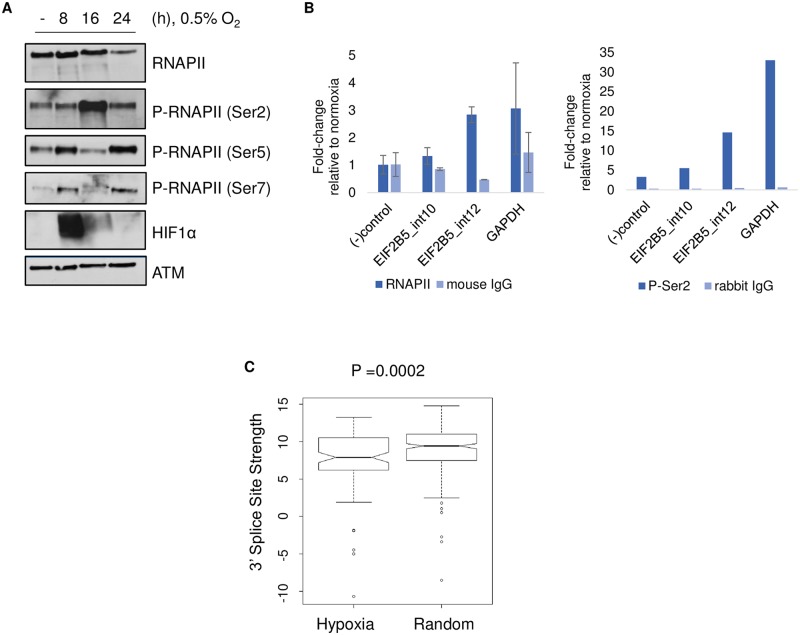
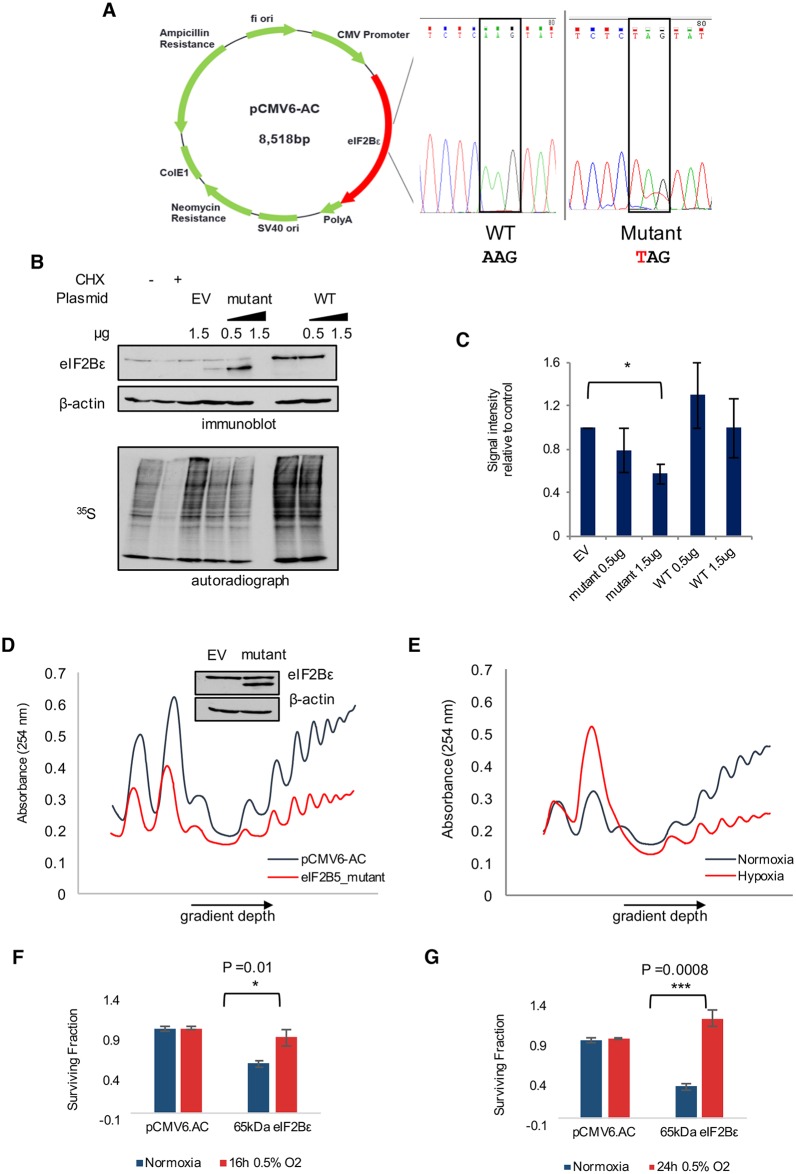
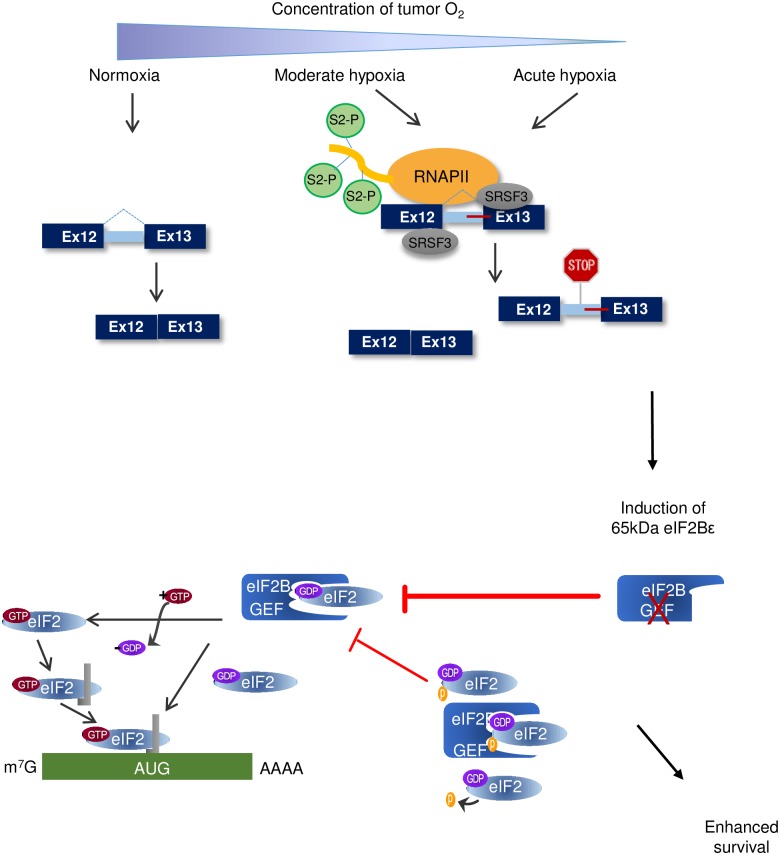
Cells adjust to hypoxic stress within the tumor microenvironment by downregulating energy-consuming processes including translation. To delineate mechanisms of cellular adaptation to hypoxia, we performed RNA-Seq of normoxic and hypoxic head and neck cancer cells. These data revealed a significant down regulation of genes known to regulate RNA processing and splicing. Exon-level analyses classified > 1,000 mRNAs as alternatively spliced under hypoxia and uncovered a unique retained intron (RI) in the master regulator of translation initiation, EIF2B5. Notably, this intron was expressed in solid tumors in a stage-dependent manner. We investigated the biological consequence of this RI and demonstrate that its inclusion creates a premature termination codon (PTC), that leads to a 65kDa truncated protein isoform that opposes full-length eIF2Bε to inhibit global translation. Furthermore, expression of 65kDa eIF2Bε led to increased survival of head and neck cancer cells under hypoxia, providing evidence that this isoform enables cells to adapt to conditions of low oxygen. Additional work to uncover -cis and -trans regulators of EIF2B5 splicing identified several factors that influence intron retention in EIF2B5: a weak splicing potential at the RI, hypoxia-induced expression and binding of the splicing factor SRSF3, and increased binding of total and phospho-Ser2 RNA polymerase II specifically at the intron retained under hypoxia. Altogether, these data reveal differential splicing as a previously uncharacterized mode of translational control under hypoxia and are supported by a model in which hypoxia-induced changes to cotranscriptional processing lead to selective retention of a PTC-containing intron in EIF2B5.


Conflict of interest statement

The authors have declared that no competing interests exist.

Figures

Fig 1
Fig 1. Classification of alternatively spliced mRNAs in hypoxic SQ20B cells.
(A) Heatmap of RNA-processing and -splicing factors differentially expressed in hypoxia compared to normoxia (Fold-changes shown, false discovery rate [FDR] < 5%). (B) To the left, plot depicts number of events detected (blue) compared to events with significantly different expression in hypoxic compared to normoxic cells (red) (Bayes Factor ≥ 20, ΔѰ > 10%; Abbreviations: A3SS, alternative 3′ splice site; A5SS, alternative 5′ splice site; AFE, alternative first exon; ALE, alternative last exon; MXE, mutually exclusive exon; RI, retained intron; SE, skipped exon; TUTR, tandem 3′ untranslated region). Specific enrichment for changes in 3 event types are starred: ALE, RI, and TUTR (***P < 0.001, 2-sample test for equality of proportions). To right of graph, exon models of the types of splicing assessed by MISO analysis. (C) Gene ontology figure representing functional enrichment for hypoxia-induced changes in ALE, RI, and TUTR categories. (D) Percent spliced in (Psi) values plotted with hypoxia samples (red) overlaid against corresponding normoxic Psi values (blue). All supporting data used in the generation of this figure are included in S1 Data.
Fig 2
Fig 2. Hypoxia-induced retained introns (RIs) for several genes are confirmed by PCR and expression analysis of head and neck tumors.
For each panel, PCR validation of intron retention events using cDNA prepared from oligo-dT–selected mRNA treated with DNAse enzymes is shown. Genes include (A) ANKZF1, (B) EIF2B5, (C) MARS, and (D) TGFB1. Diagrams beside gel images of PCR products depict gene locus models with exons as solid blue and introns as striped rectangles. For each gene, expression analysis for HNSC tumor and matched normal tissue data is shown below—(E) ANKZF1, (F) EIF2B5, (G) MARS, and (H) TGFB1. Data used in the generation of this figure are included in S1 Data.
Fig 3
Fig 3. The clinical and biological relevance of a hypoxia-induced retained intron in EIF2B5.
(A) Expression of EIF2B5 intron 12 was measured in head and neck squamous cell carcinoma (HNSC) tumors compared to matched normal tissues and reported according to disease stage. (B) Expression of EIF2B5 intron 12 was measured in kidney renal clear cell carcinoma (KIRC) tumors compared to matched normal tissues and reported according to disease stage. (C) Upper: Gene model of EIF2B5, with sashimi plot of normalized RNA-Seq reads for representative matched hypoxia and normoxia samples (plot created using Integrative Genome Viewer). Lower: UCSC Genome Browser Vertebrate Conservation track reveals a conserved stop codon (TAA or TGA) that remains in frame upon retention of intron 12. (D) Real-time quantitative PCR performed with isoform-specific primers. Data are presented as average of 3 independently conducted experiments, with error bars reported as SEM. All supporting data used to create this figure can be found in S1 Data.
Fig 4
Fig 4. Retention of intron 12 leads to a 65kDa isoform of eIF2Bε.
(A) Protein model of observed isoforms of eIF2Bε. (B) Immunoblot shows induction of a 65kDa isoform of eIF2Bε in SQ20B cells maintained for various periods in 0.5% or 0.2% O2. (C) Knock-down of eIF2Bε with siRNA targeting the whole gene or intron 12 reduces expression of the 65kDa isoform in normoxic and hypoxic (0.2% 02) SQ20B cells. Abbreviation: NT, non-targeting control siRNA. (D) Hypoxia (16h, 0.5% O2) in a colon cancer cell line, RKO, leads to induction of 65kDa eIF2Bε. (E) Immunoblot of SQ20B cells collected 4h after exposure to ultraviolet (UV). (F) Protein sequence of eIF2Bε with peptides identified from liquid chromatography tandem mass spectrometry (LC-MS/MS) sequencing highlighted in yellow (shown to right). Analysis was carried out from gel-purified bands (shown left) corresponding to approximately 80kDa (top) and 65kDa (lower), which contained peptides of full-length eIF2Bε and a truncated isoform of eIF2Bε, respectively.
Fig 5
Fig 5. Analysis of RNA binding factor motifs and regulatory sequence features at the EIF2B5 intron12 locus.
(A) A nonmotif analysis of other sequence features influencing splicing of EIF2B5 exons 12–14. These were data generated using AVISPA [50]. (B) Splicing factor motifs determined to have the largest effects on regulation of the EIF2B5 exons 12–14 are shown, with color-coded gene map above and predicted regulatory sites shown below with feature effect value. Black rows highlight a predicted weak splice site before exon 13 and an alternate GTGAG splice site after exon 13. Red arrows signify splicing factors observed as hypoxia-responsive in RNA-Seq data. (C) Immunoblot of SQ20B lysates to assess expression of SRSF3 protein under hypoxia. Nx = normoxia, Hx = 16 h 0.5% O2 hypoxia. (D) Upper: Immunoblot analysis of knock-down efficiency of SRSF3 in SQ20B cells. Lower: Immunoblot of lysates collected from SQ20B cells treated with 50 nM siRNA under 16 h 0.5% O2 hypoxia. (E) Upper: Immunoblot results from immunoprecipitation of SQ20B lysate with SRSF3 antibody in normoxic and hypoxic cells. Rabbit IgG was used as a control. Lower: Reverse transcription quantitative PCR (RT-qPCR) analysis of RNA isolated from the immunoprecipitation with SRSF3 using primers for negative (-) control (a region of GAPDH predicted to contain no binding of SRSF3) and primers for the 2 exons flanking EIF2B5 intron12 predicted to have SRSF3 binding. Additional data used in the generation of this figure are included in S1 Data.
Fig 6
Fig 6. Detection of hypoxia-mediated changes in phosphorylation and binding of RNA polymerase II (RNAPII).
(A) Immunoblot of phosphorylated forms of RNAPII in nuclear lysates of SQ20B cells. Expression of ATM (Ataxia Telangiectasia Mutated Serine/Threonine kinase) was used as a loading control. (B) Chromatin immunoprecipitation followed by quantitative PCR (qPCR) to determine abundance of total RNAPII or P-Ser2 RNAPII at EIF2B5 intron 12, an upstream negative control intron 10, a negative control region of GAPDH ((-) control), and a RNAPII-positive control region of GAPDH. For (B), total RNAPII data represent average of n = 3 independently conducted experiments (error bars = SEM) and P-Ser2 data are shown as an average of n = 2 independently conducted experiments. (C) Analysis of 3′ splice sites carried out using a First Model Markov method to determine maximum entropy scores, reported as 3′ splice site strength [56]. Hypoxia group = 101 unique 3′ splice sites of introns retained under hypoxia; Random group = 252 hg19 3′ splice sites. Additional data used to create this figure are included in S1 Data.
Fig 7
Fig 7. Expression of a 65kDa isoform of eIF2Bε leads to a global decrease in protein synthesis.
(A) Site-directed mutagenesis was used to introduce a stop codon into EIF2B5 (within 1 codon of where intron retention introduces an early stop). (B) Expression of full-length (wild-type [WT]) or mutated eIF2Bε (mutant) was performed for 24 h in SQ20B cells (upper), followed by pulse-labeling with 35S methionine/cysteine (lower) to measure changes in protein synthesis compared to expression of an empty vector pCMV6-AC (EV). Cells treated with cyclohexamide (CHX) were used as a control for inhibition of translation initiation. (C) Image quantification of total 35S signal from autoradiographs of 4 independently conducted experiments. Data collected from n = 4 independently conducted experiments, *P < 0.01 (Student t test). (D) Polysome profile depicts SQ20B cells expressing the 65kDa isoform of eIF2Bε for 36 h compared to cells expressing control pCMV6-AC, with supporting immunoblot shown above. (E) Polysome profiling of hypoxic versus normoxic SQ20B cells. (F) Clonogenic assay of SQ20B cells expressing control plasmid (pCMV6.AC) or 65kDa eIF2Bε in normal oxygen or 0.5% O2 for 16 h. Analysis of 3 biological replicates quantified to right (P value reported for Student t test). (G) Clonogenic assay of SQ20B cells expressing control plasmid (pCMV6.AC) or 65kDa eIF2Bε in normal oxygen or 0.5% O2 for 24 h. Analysis of 3 biological replicates quantified to right (P value reported for Student t test). Additional data used to create this figure are included in S1 Data.
Fig 8
Fig 8. Model of hypoxia-induced intron retention in EIF2B5 as a mechanism to reduce translation and enhance survival in head and neck cancer cells during periods of prolonged or acute hypoxia.
Upper: Under acute or prolonged hypoxia, increased phosphorylation of Ser2-RNAPII accumulates specifically at EIF2B5 intron 12. Binding of SRSF3 is increased under hypoxia at this locus, which contains a weak splice site and alternate downstream splice site. Altogether, oxygen deprivation leads to an accumulation of intron12-containing EIF2B5 transcripts, which results in a truncated reading frame due to insertion of a premature termination codon (PTC). Lower: Retention of intron 12 under hypoxia results in a 65kDa isoform of eIF2Bε. This isoform lacks the functional guanine exchange factor (GEF) domain and acts opposite to the full-length isoform to inhibit translation during periods of prolonged hypoxia, which ultimately confers a survival advantage to SQ20B cells under hypoxia.

References

    1. Semenza GL. Molecular mechanisms mediating metastasis of hypoxic breast cancer cells. Trends in molecular medicine. 2012;18(9):534–43. doi: 10.1016/j.molmed.2012.08.001 - DOI - PMC - PubMed
    1. Harris AL. Hypoxia—a key regulatory factor in tumour growth. Nat Rev Cancer. 2002;2(1):38–47. doi: 10.1038/nrc704 - DOI - PubMed
    1. Evans SM, Joiner B, Jenkins WT, Laughlin KM, Lord EM, Koch CJ. Identification of hypoxia in cells and tissues of epigastric 9L rat glioma using EF5 [2-(2-nitro-1H-imidazol-1-yl)-N-(2,2,3,3,3-pentafluoropropyl) acetamide]. British journal of cancer. 1995;72(4):875–82. - PMC - PubMed
    1. Erapaneedi R, Belousov VV, Schafers M, Kiefer F. A novel family of fluorescent hypoxia sensors reveal strong heterogeneity in tumor hypoxia at the cellular level. Embo j. 2016;35(1):102–13. doi: 10.15252/embj.201592775 - DOI - PMC - PubMed
    1. Brady LK, Popov V, Koumenis C. In Vivo Interrogation of the Hypoxic Transcriptome of Solid Tumors: Optimizing Hypoxic Probe Labeling with Laser Capture Microdissection for Isolation of High-Quality RNA for Deep Sequencing Analysis. Advances in experimental medicine and biology. 2016;899:41–58. doi: 10.1007/978-3-319-26666-4_4 - DOI - PubMed

MeSH terms