. 2018 Jan 15;34(2):207-214.
doi: 10.1093/bioinformatics/btx515.

In silico identification of rescue sites by double force scanning

Affiliations

In silico identification of rescue sites by double force scanning

Matteo Tiberti et al. Bioinformatics. .

Abstract

Motivation: A deleterious amino acid change in a protein can be compensated by a second-site rescue mutation. These compensatory mechanisms can be mimicked by drugs. In particular, the location of rescue mutations can be used to identify protein regions that can be targeted by small molecules to reactivate a damaged mutant.

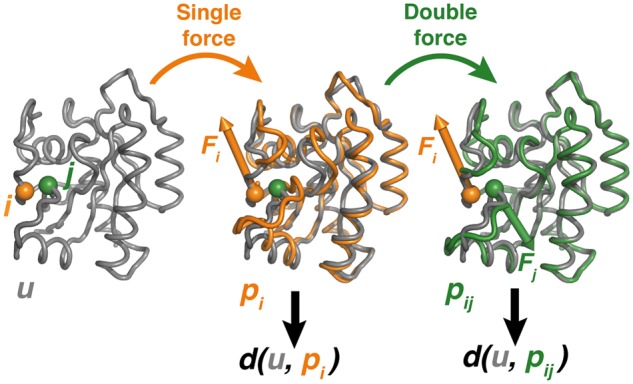
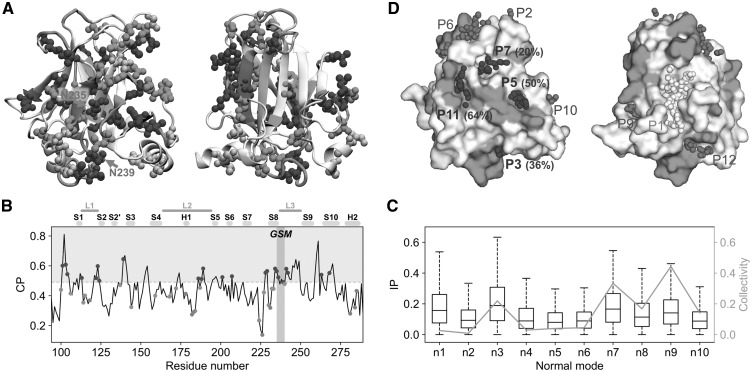
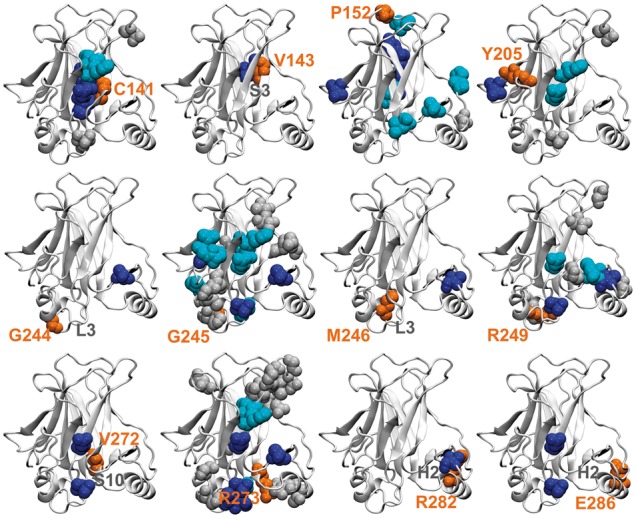
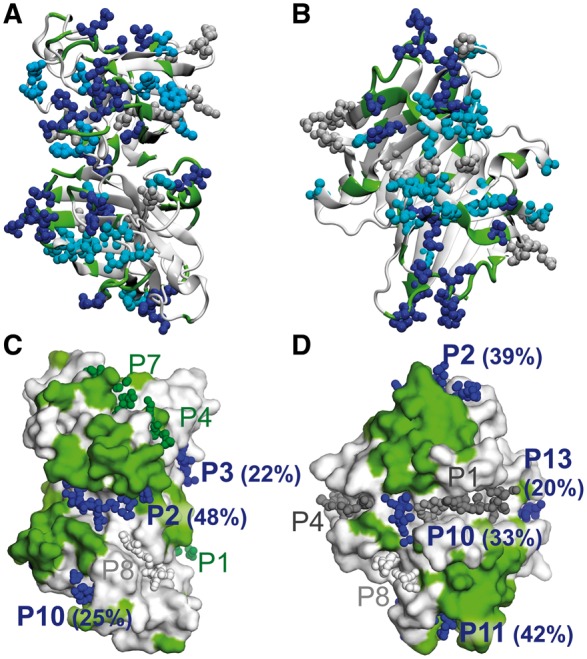
Results: We present the first general computational method to detect rescue sites. By mimicking the effect of mutations through the application of forces, the double force scanning (DFS) method identifies the second-site residues that make the protein structure most resilient to the effect of pathogenic mutations. We tested DFS predictions against two datasets containing experimentally validated and putative evolutionary-related rescue sites. A remarkably good agreement was found between predictions and experimental data. Indeed, almost half of the rescue sites in p53 was correctly predicted by DFS, with 65% of remaining sites in contact with DFS predictions. Similar results were found for other proteins in the evolutionary dataset.

Availability and implementation: The DFS code is available under GPL at https://fornililab.github.io/dfs/.

Supplementary information: Supplementary data are available at Bioinformatics online.


Figures

Fig. 1.
Fig. 1.
Schematic representation of the DFS approach. The protein unperturbed structure (u) is represented as grey tube, together with the structures after application of a single force Fi at i (pi structure, orange) and of two forces Fi and Fj at i and j, respectively (pij structure, green). The deviation of structure x from the unperturbed structure is measured by a distance function d(u, x) (Color version of this figure is available at Bioinformatics online.)
Fig. 2.
Fig. 2.
Detection of p53 rescue sites with DFS. (A) Comparison of experimental rescue sites and DFS predictions mapped onto the p53 structure. Experimental rescue sites (RSexp) are reported as spheres, coloured in blue (predicted by DFS), cyan (within 4 Å from DFS rescue sites) and grey (not predicted). The position of all DFS rescue sites is indicated with green cartoon. Two different views of the structure are shown, representing the sides that are rich (left) and depleted (right) in rescue sites. Two residues from the GSM are labelled in magenta. (B) Plot of the compensatory power P. The threshold Pcut used for the definition of DFS rescue sites is represented with a dashed grey line. Experimental rescue sites RSexp are indicated with dots coloured as in panel A. Secondary structure elements are indicated with gold (strands) and grey (helices) blocks, while loops L1–L3 are indicated with brown lines. The position of the GSM residues is shaded in magenta. (C) Distributions of inner products calculated between the compensatory motions and each of the first 10 normal modes represented as boxplots. The collectivity index of each normal mode is reported in orange. (D) Surface representation of p53, with DFS rescue sites coloured in green. Binding pockets detected with fpocket are reported showing the centres of the probe spheres used for their detection (α-spheres), coloured in blue (%RSDFS and %RSexp ≥ 20), green (%RSDFS ≥ 20), grey (%RSexp ≥ 20) and white (%RSDFS and %RSexp < 20). The content in DFS rescue sites (%RSDFS) is shown in parentheses for blue pockets (Color version of this figure is available at Bioinformatics online.)
Fig. 3.
Fig. 3.
Detection of p53 rescue sites for selected pathogenic mutations. For each pathogenic mutation site PS (orange spheres), experimental rescue sites RSexp are shown in blue (predicted by DFS as rescue sites for the specific PS site), cyan (within 4 Å from DFS sites) and grey (not predicted by DFS as associated to the PS site). Selected secondary structure elements are also labelled in grey (Color version of this figure is available at Bioinformatics online.)
Fig. 4.
Fig. 4.
Comparison of evolutionary rescue sites and DFS-predicted rescue sites for SOD (A,C) and TTR (B,D). (A and B) Evolutionary rescue sites RSevol are mapped on the surface representation of the protein as spheres, while DFS-predicted rescue sites are shown as green cartoon. (C and D) Surface representation of the proteins, with surface DFS-predicted residues coloured in green. The α-sphere centres of the candidate pockets are shown as spheres. For all the panels the same colouring scheme is used as for Figure 2 (Color version of this figure is available at Bioinformatics online.)

Similar articles

Cited by

References

    1. Atilgan C., Atilgan A.R. (2009) Perturbation-response scanning reveals ligand entry-exit mechanisms of ferric binding protein. PLoS Comput. Biol., 5, e1000544. - PMC - PubMed
    1. Atilgan C. et al. (2012) Network-based models as tools hinting at nonevident protein functionality. Annu. Rev. Biophys., 41, 205–225. - PubMed
    1. Bakan A. et al. (2014) Evol and ProDy for bridging protein sequence evolution and structural dynamics. Bioinformatics, 30, 2681–2683. - PMC - PubMed
    1. Barešić A. et al. (2010) Compensated pathogenic deviations: analysis of structural effects. J. Mol. Biol., 396, 19–30. - PubMed
    1. Baroni T.E. et al. (2004) A global suppressor motif for p53 cancer mutants. Proc. Natl. Acad. Sci. USA, 101, 4930–4935. - PMC - PubMed

Publication types