Review
. 2017 Sep 1;41(5):599-623.
doi: 10.1093/femsre/fux039.

Biophysical processes supporting the diversity of microbial life in soil

Affiliations
Review

Biophysical processes supporting the diversity of microbial life in soil

Robin Tecon et al. FEMS Microbiol Rev. .

Abstract

Soil, the living terrestrial skin of the Earth, plays a central role in supporting life and is home to an unimaginable diversity of microorganisms. This review explores key drivers for microbial life in soils under different climates and land-use practices at scales ranging from soil pores to landscapes. We delineate special features of soil as a microbial habitat (focusing on bacteria) and the consequences for microbial communities. This review covers recent modeling advances that link soil physical processes with microbial life (termed biophysical processes). Readers are introduced to concepts governing water organization in soil pores and associated transport properties and microbial dispersion ranges often determined by the spatial organization of a highly dynamic soil aqueous phase. The narrow hydrological windows of wetting and aqueous phase connectedness are crucial for resource distribution and longer range transport of microorganisms. Feedbacks between microbial activity and their immediate environment are responsible for emergence and stabilization of soil structure-the scaffolding for soil ecological functioning. We synthesize insights from historical and contemporary studies to provide an outlook for the challenges and opportunities for developing a quantitative ecological framework to delineate and predict the microbial component of soil functioning.

Keywords: bacterial communities; microbial ecology; microbial interactions; soil microbiology; soil physics; vadose zone.


Figures

Figure 1.
Figure 1.
Climate and biophysical factors influencing microbial geographic patterns from continent to pore scale. Each bar represents the expected range of spatial scales over which a factor can produce changes in microbial abundance or diversity. MAT: mean annual temperature; T range: annual or diurnal temperature range; MAP: mean annual precipitation; NPP: plant net primary production; SOC: soil organic carbon; C:N: carbon to nitrogen ratio; total N: total nitrogen. Symbols refer to a selection of specific studies demonstrating factor effects on abundance or diversity, with the symbol position indicating the approximate scale considered in the study. The references also indicate which type of method was used. Examples of microbial biogeographic patterns at various scales are shown. (A) Global distribution estimates of microbial biomass carbon (CMic) per square meter of soil. Adapted from Serna‐Chavez, Fierer and Bodegom (2013) with permission from John Wiley and Sons. [This image is not covered by the terms of the Creative Commons licence of this publication. For permission to reuse, please contact the rights holder.] (B) Kriged maps of bacterial and fungal phospholipid fatty acids (PLFAs) biomarkers in a grassland soil at the meter scale. Adapted from Regan et al. (2014). (C) View of soil microhabitats in a soil thin section and corresponding observed bacterial distribution at the microscale, with darker shades indicating higher probability of bacterial presence. Adapted from Raynaud and Nunan (2014).
Figure 2.
Figure 2.
Microbial hotspots and hydration conditions in soil. Conceptual illustration shows hotspots of microbial activity (orange dots), with on the left anaerobic (purple) and aerobic (red) bacterial populations inside an aggregate, and on the right bacteria colonizing a root hair tip. Squares show water and air configuration in the pore space at the microscale under wet conditions following rainfall or irrigation (left), or under dry conditions after water drainage and evaporation (right). Graphs show macroscopic profiles of oxygen, carbon and water content over soil depth. Oxygen concentration is highest at the soil surface and water saturation maximal when it reaches the water table. Oxygen and water profile change under wet or dry conditions, while carbon profile is unchanged.
Figure 3.
Figure 3.
Bacteria colonizing pores and soil surfaces. (A) Fluorescence microscopy images of bacteria in the lettuce rhizosphere (phylogenetic groups were labeled by fluorescent in situ hybridization and shown with different colors); image adapted from Cardinale (2014). (B) Fluorescence microscopy images of bacteria (labeled by fluorescent in situ hybridization) in a sandy soil; images adapted from Eickhorst and Tippkotter (2008) with permission from Elsevier. [This image is not covered by the terms of the Creative Commons licence of this publication. For permission to reuse, please contact the rights holder.] (C) Scanning electron microscopy images of bacterial cells attached to solid sand surfaces by EPS (seen as a filamentous mesh). Photo credit: Lewis Lab at Northeastern University. Image created by Anthony D’Onofrio, William H. Fowle, Eric J. Stewart and Kim Lewis.
Figure 4.
Figure 4.
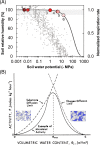
Impact of soil water on microbial activity. (A) Theoretical soil relative humidity (solid line) and microbial respiration rates measured in various soils (gray dots) as function of soil water potential. Respiration rate is normalized to its value at field capacity (–0.03 MPa), and is from Manzoni and Katul (2014). Observed limits for microbial dispersion and respiration are as follows. (1) Flagellar motility of Phytophtora zoospores ceases at –5 kP (Griffin 1981). (2) Flagellar motility of Pseudomonas ceases around –10 kPa (Dechesne et al.; Tecon and Or 2016). (3) Microbial respiration in intact soil cores ceases at –1 MPa (Manzoni and Katul 2014). (4) Mycorrhizal fungi growth and dispersal is still observed at ∼ –4–5 MPa (dispersion limit is probably lower than this value) (Allen 2007). (5) Bacterial respiration ceases around –5 MPa (Wilson and Griffin 1975). (6) Microbial respiration in disturbed soils ceases around –15 MPa (Manzoni and Katul 2014). Almost all microbial activity takes place between 90% and 100% soil relative humidity (shaded area). Data on respiration rates in soil courtesy of Stefano Manzoni. (B) Conceptual view of the effects of soil water content on macroscopic microbial activity from unsaturated to fully saturated conditions. Dotted lines represent upper limits imposed by gaseous or substrate diffusion rates. From Or et al. (2007), with permission from Elsevier. [This image is not covered by the terms of the Creative Commons licence of this publication. For permission to reuse, please contact the rights holder.]
Figure 5.
Figure 5.
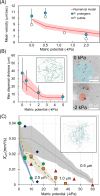
Role of matric potential in controlling bacterial dispersal. (A) Bacterial swimming velocity measured from experiments (symbols) or simulated (line) as function of water matric potential. Mean velocities are calculated from individual trajectories of P. protegens (blue dots) or P. putida (white dots) swimming on porous surface models with similar roughness. Error bars represent standard error of the mean. Pseudomonas putida results adapted from Dechesne et al. (2010). Simulation and P. protegens results adapted from Tecon and Or (2016). (B) Bacterial dispersal on a 2D hydrated porous surface. Results of maximal dispersal distance calculated from simulations (line) on a rough surface model and measured in experiments (dots, average values calculated from individual trajectories of P. protegens bacteria) are shown as function of matric potential. Bars and shaded areas represent standard deviations. Micrographs show exemplary dispersion radii (colored circles) from single cell trajectories at contrasting matric potentials. Adapted from Tecon and Or (2016). (C) Bacterial dispersal in a 3D hydrated porous network. Results show bacterial dispersion coefficient (mm2 s−1) calculated from simulations (lines, considering three bacterial cell sizes: 0.5, 1.0 and 2.5 μm) in unsaturated porous network model and compared with experimental data from literature (symbols, see the text for references). Shaded areas represent standard deviations. Adapted from Ebrahimi and Or (2014) with permission from John Wiley and Sons. [This image is not covered by the terms of the Creative Commons licence of this publication. For permission to reuse, please contact the rights holder.]
Figure 6.
Figure 6.
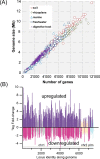
Genomics and transcriptomics of soil bacteria. (A) Size and gene content characteristics of bacterial whole genomes from various ecosystem types. Data obtained from the Joint Genome Institute on genome projects. Bacterial genomes (classified either as ‘finished’ or ‘permanent draft’) were grouped based on the JGI classification in various ‘ecosystem types’. The number of bacterial genomes per ecosystem type was 335 (soil), 123 (rhizoplane), 280 (marine), 184 (freshwater), 185 (digestive system). (B) Genes expression levels in the soil bacterium P. veronii change dramatically when it is exposed to a sand environment in a microcosm as opposed to a liquid culture. Positive (dark violet) and negative (pink) fold-changes indicate respectively gene up- and downregulation when in contact to sand particles relatively to liquid cultures. Graph adapted from Morales et al. (2016).
Figure 7.
Figure 7.
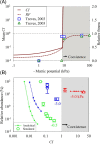
Soil matric potential impact on bacterial coexistence. (A) Analytical predictions of the coexistence index CI (solid line) and relative fitness RF (dotted line) between two model bacterial species (one dominant and one inferior) as function of soil matric potential, and comparisons with experimental data (symbols) from Treves et al. (2003) (triangles and squares correspond to two different pairs of bacterial species). A CI value above 1 corresponds to a steep increase in the relative fitness of the inferior species due to the fractionation of the aquatic habitat at a given matric potential. (B) Analytical and simulated relative abundances of the dominant species as function of CI. A steep transition is observed at CI > 1, which corresponds to lower matric potential values. Both graphs from Wang and Or (2012).

References

    1. Alivisatos AP, Blaser MJ, Brodie EL et al. . A unified initiative to harness earth's microbiomes. Science 2015;350:507–8. - PubMed
    1. Allen MF. Mycorrhizal fungi: highways for water and nutrients in arid soils. Vadose Zone J 2007;6:291–7.
    1. Alster CJ, Koyama A, Johnson NG et al. . Temperature sensitivity of soil microbial communities: An application of macromolecular rate theory to microbial respiration. J Geophys Res-Biogeo 2016;121:1420–33.
    1. Amellal N, Burtin G, Bartoli F et al. . Colonization of wheat roots by an exopolysaccharide-producing Pantoea agglomerans strain and its effect on rhizosphere soil aggregation. Appl Environ Microb 1998;64:3740–7. - PMC - PubMed
    1. Andam CP, Doroghazi JR, Campbell AN et al. . A latitudinal diversity gradient in terrestrial bacteria of the genus Streptomyces. mBio 2016;7:e02200–15. - PMC - PubMed

Publication types