

Association of Dynamic Changes in the CD4 T-Cell Transcriptome With Disease Severity During Primary Respiratory Syncytial Virus Infection in Young Infants
- PMID: 28962005
- PMCID: PMC5853440
- DOI: 10.1093/infdis/jix400
Association of Dynamic Changes in the CD4 T-Cell Transcriptome With Disease Severity During Primary Respiratory Syncytial Virus Infection in Young Infants
Abstract
Background: Nearly all children are infected with respiratory syncytial virus (RSV) within the first 2 years of life, with a minority developing severe disease (1%-3% hospitalized). We hypothesized that an assessment of the adaptive immune system, using CD4+ T-lymphocyte transcriptomics, would identify gene expression correlates of disease severity.
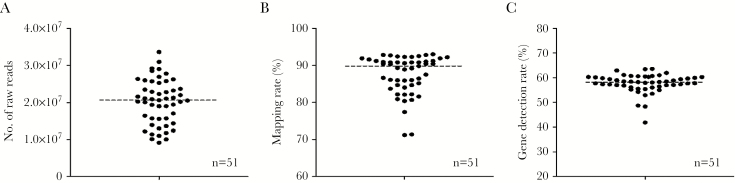
Methods: Infants infected with RSV representing extremes of clinical severity were studied. Mild illness (n = 23) was defined as a respiratory rate (RR) < 55 and room air oxygen saturation (SaO2) ≥ 97%, and severe illness (n = 23) was defined as RR ≥ 65 and SaO2 ≤ 92%. RNA from fresh, sort-purified CD4+ T cells was assessed by RNA sequencing.
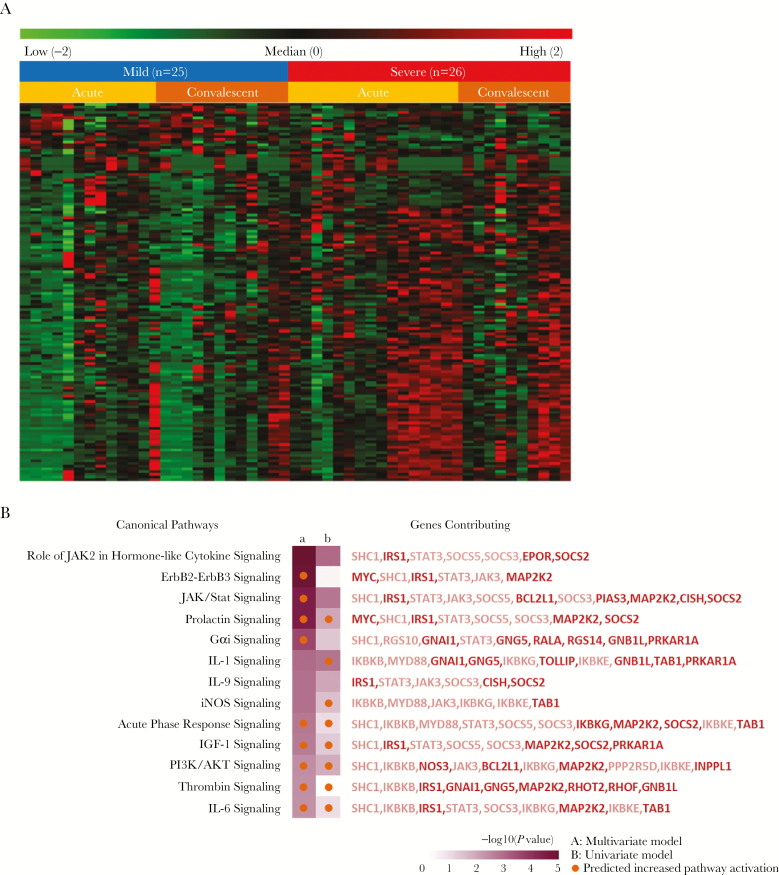
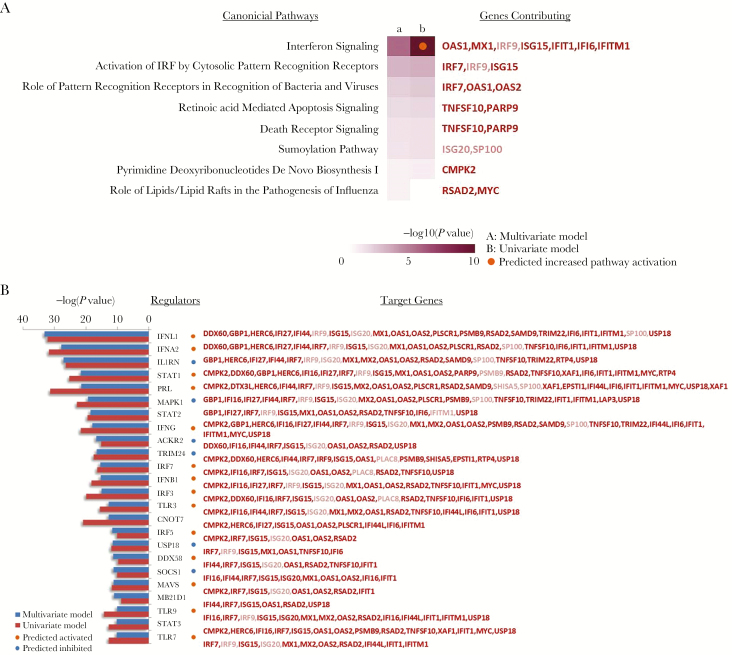
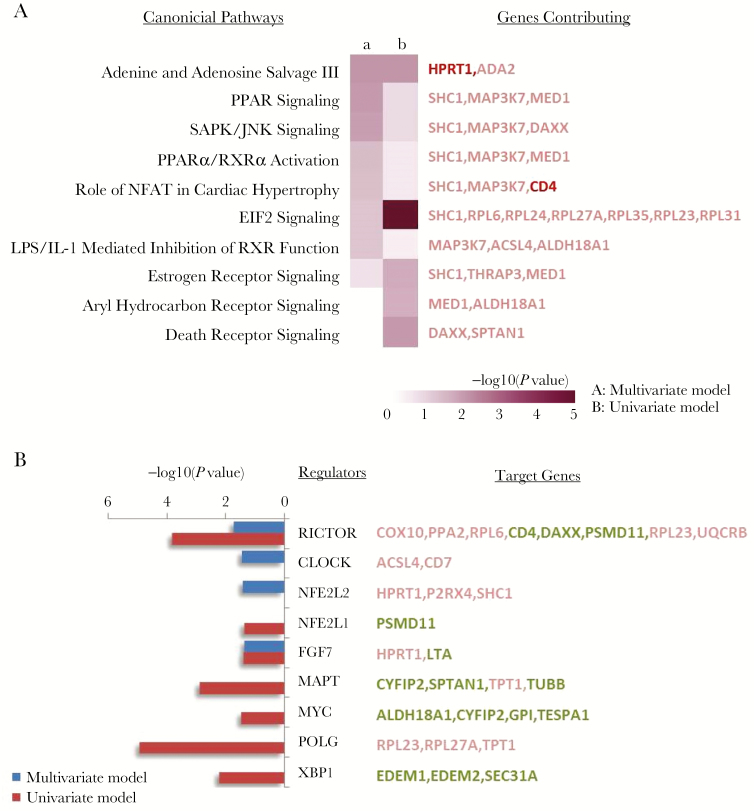
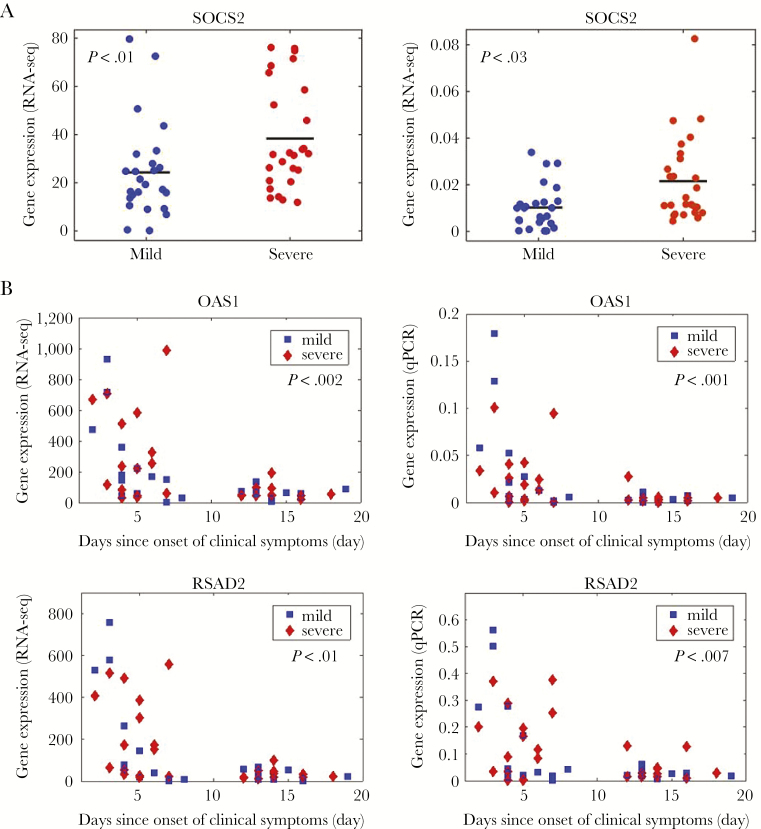
Results: Gestational age, age at illness onset, exposure to environmental tobacco smoke, bacterial colonization, and breastfeeding were associated (adjusted P < .05) with disease severity. RNA sequencing analysis reliably measured approximately 60% of the genome. Severity of RSV illness had the greatest effect size upon CD4 T-cell gene expression. Pathway analysis identified correlates of severity, including JAK/STAT, prolactin, and interleukin 9 signaling. We also identified genes and pathways associated with timing of symptoms and RSV group (A/B).
Conclusions: These data suggest fundamental changes in adaptive immune cell phenotypes may be associated with RSV clinical severity.
Keywords: RNA sequencing; T cell; disease severity; gene espression; respiratory syncytial virus.
© The Author 2017. Published by Oxford University Press for the Infectious Diseases Society of America. All rights reserved. For permissions, e-mail: journals.permissions@oup.com.
Figures
Similar articles
-
Severity of respiratory syncytial virus bronchiolitis is affected by cigarette smoke exposure and atopy.Pediatrics. 2005 Jan;115(1):e7-14. doi: 10.1542/peds.2004-0059. Pediatrics. 2005. PMID: 15629968
-
Impaired immune response in severe human lower tract respiratory infection by respiratory syncytial virus.Pediatr Infect Dis J. 2009 Oct;28(10):867-73. doi: 10.1097/INF.0b013e3181a3ea71. Pediatr Infect Dis J. 2009. PMID: 19738511
-
CD4+ T-cell counts and interleukin-8 and CCL-5 plasma concentrations discriminate disease severity in children with RSV infection.Pediatr Res. 2013 Feb;73(2):187-93. doi: 10.1038/pr.2012.163. Epub 2012 Nov 19. Pediatr Res. 2013. PMID: 23165450 Free PMC article.
-
Prevention of serious respiratory syncytial virus-related illness. II: Immunoprophylaxis.Adv Ther. 2011 Feb;28(2):110-25. doi: 10.1007/s12325-010-0101-y. Epub 2011 Feb 4. Adv Ther. 2011. PMID: 21318605 Review.
-
Basic epidemiology and immunopathology of RSV in children.Paediatr Respir Rev. 2000 Sep;1(3):210-4. doi: 10.1053/prrv.2000.0050. Paediatr Respir Rev. 2000. PMID: 12531081 Review.
Cited by
-
Impaired tumor necrosis factor-α secretion by CD4 T cells during respiratory syncytial virus bronchiolitis associated with recurrent wheeze.Immun Inflamm Dis. 2020 Mar;8(1):30-39. doi: 10.1002/iid3.281. Epub 2020 Jan 4. Immun Inflamm Dis. 2020. PMID: 31901157 Free PMC article.
-
Metatranscriptomics to characterize respiratory virome, microbiome, and host response directly from clinical samples.Cell Rep Methods. 2021 Oct 25;1(6):100091. doi: 10.1016/j.crmeth.2021.100091. Cell Rep Methods. 2021. PMID: 34790908 Free PMC article.
-
Airway gene-expression classifiers for respiratory syncytial virus (RSV) disease severity in infants.BMC Med Genomics. 2021 Feb 25;14(1):57. doi: 10.1186/s12920-021-00913-2. BMC Med Genomics. 2021. PMID: 33632195 Free PMC article.
-
Modeling Human Respiratory Syncytial Virus (RSV) Infection: Recent Contributions and Future Directions Using the Calf Model of Bovine RSV Disease.J Immunol. 2023 Oct 15;211(8):1180-1186. doi: 10.4049/jimmunol.2300260. J Immunol. 2023. PMID: 37782855 Free PMC article. Review.
-
Unbiased analysis of peripheral blood mononuclear cells reveals CD4 T cell response to RSV matrix protein.Vaccine X. 2020 Apr 21;5:100065. doi: 10.1016/j.jvacx.2020.100065. eCollection 2020 Aug 7. Vaccine X. 2020. PMID: 32529184 Free PMC article.
References
-
- Hall CB. Respiratory syncytial virus and parainfluenza virus. N Engl J Med 2001; 344:1917–28. - PubMed
-
- Hall CB, Weinberg GA, Blumkin AK et al. . Respiratory syncytial virus–associated hospitalizations among children less than 24 months of age. Pediatrics 2013; 132:e341–8. - PubMed
-
- Meissner HC. Viral bronchiolitis in children. N Engl J Med 2016; 374:62–72. - PubMed
Publication types
MeSH terms
Substances
LinkOut - more resources
Full Text Sources
Other Literature Sources
Medical
Molecular Biology Databases
Research Materials
