

Detection of Regional Variation in Selection Intensity within Protein-Coding Genes Using DNA Sequence Polymorphism and Divergence
- PMID: 28962009
- PMCID: PMC5850860
- DOI: 10.1093/molbev/msx213
Detection of Regional Variation in Selection Intensity within Protein-Coding Genes Using DNA Sequence Polymorphism and Divergence
Abstract
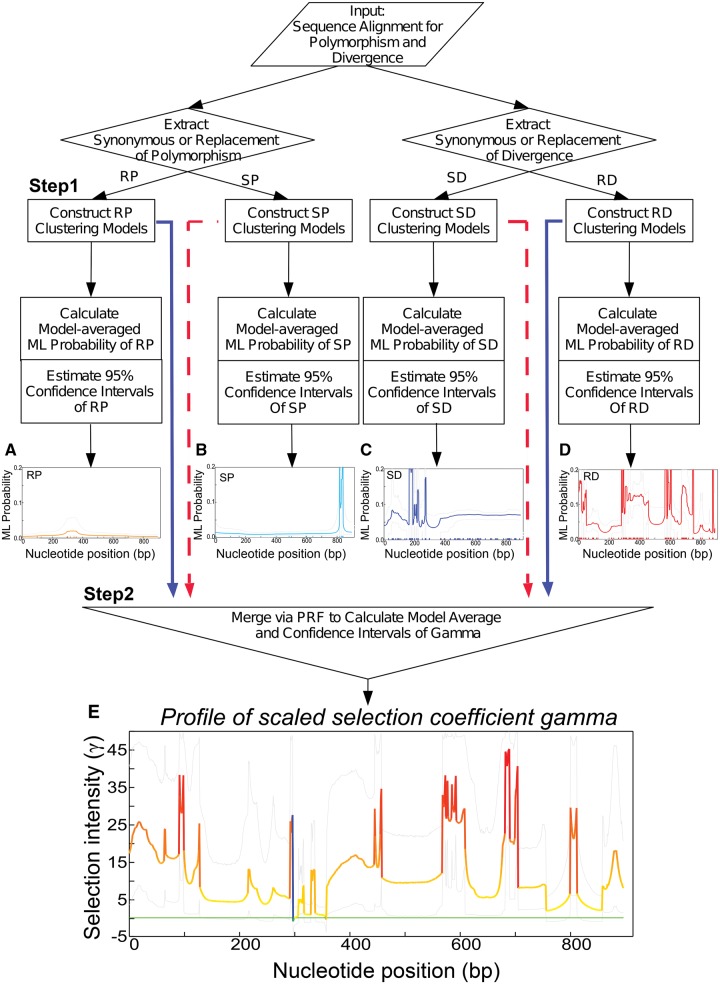
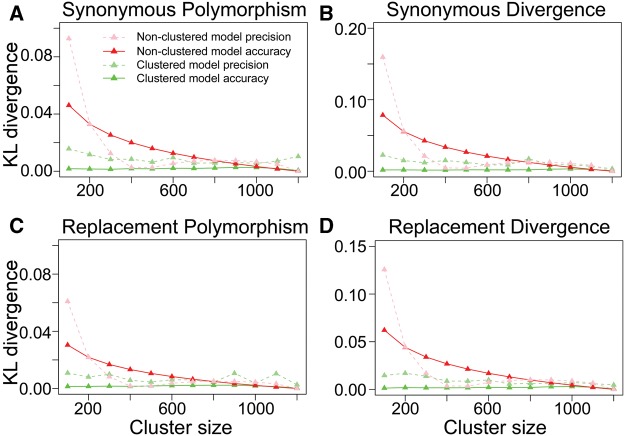
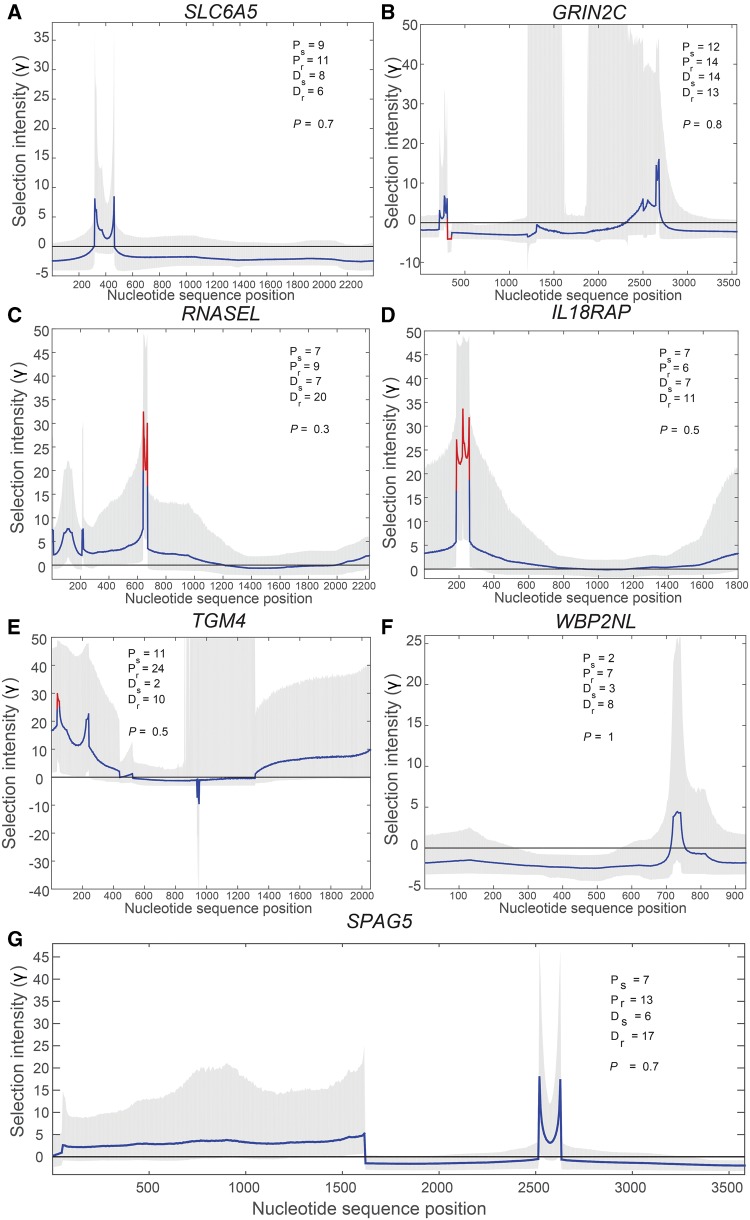
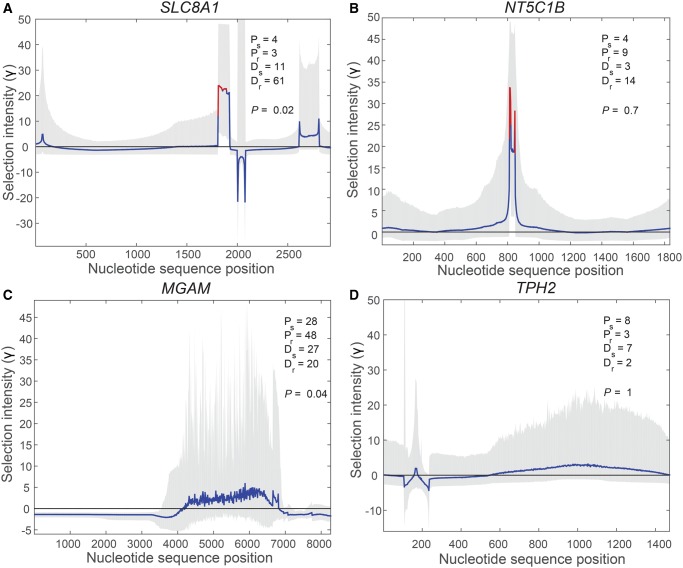
Numerous approaches have been developed to infer natural selection based on the comparison of polymorphism within species and divergence between species. These methods are especially powerful for the detection of uniform selection operating across a gene. However, empirical analyses have demonstrated that regions of protein-coding genes exhibiting clusters of amino acid substitutions are subject to different levels of selection relative to other regions of the same gene. To quantify this heterogeneity of selection within coding sequences, we developed Model Averaged Site Selection via Poisson Random Field (MASS-PRF). MASS-PRF identifies an ensemble of intragenic clustering models for polymorphic and divergent sites. This ensemble of models is used within the Poisson Random Field framework to estimate selection intensity on a site-by-site basis. Using simulations, we demonstrate that MASS-PRF has high power to detect clusters of amino acid variants in small genic regions, can reliably estimate the probability of a variant occurring at each nucleotide site in sequence data and is robust to historical demographic trends and recombination. We applied MASS-PRF to human gene polymorphism derived from the 1,000 Genomes Project and divergence data from the common chimpanzee. On the basis of this analysis, we discovered striking regional variation in selection intensity, indicative of positive or negative selection, in well-defined domains of genes that have previously been associated with neurological processing, immunity, and reproduction. We suggest that amino acid-altering substitutions within these regions likely are or have been selectively advantageous in the human lineage, playing important roles in protein function.
Keywords: Poisson Random Field; divergence; human evolution; model averaged site selection; natural selection; polymorphism.
© The Author 2017. Published by Oxford University Press on behalf of the Society for Molecular Biology and Evolution. All rights reserved. For permissions, please e-mail: journals.permissions@oup.com.
Figures
Similar articles
-
Selection on human genes as revealed by comparisons to chimpanzee cDNA.Genome Res. 2003 May;13(5):831-7. doi: 10.1101/gr.944903. Genome Res. 2003. PMID: 12727903 Free PMC article.
-
Mutation and selection at silent and replacement sites in the evolution of animal mitochondrial DNA.Genetica. 1998;102-103(1-6):393-407. Genetica. 1998. PMID: 9720291
-
The evolution of lineage-specific clusters of single nucleotide substitutions in the human genome.Mol Phylogenet Evol. 2013 Oct;69(1):276-85. doi: 10.1016/j.ympev.2013.06.003. Epub 2013 Jun 14. Mol Phylogenet Evol. 2013. PMID: 23770436
-
Statistical methods for detecting natural selection from genomic data.Genes Genet Syst. 2010;85(6):359-76. doi: 10.1266/ggs.85.359. Genes Genet Syst. 2010. PMID: 21415566 Review.
-
Exonization of transposed elements: A challenge and opportunity for evolution.Biochimie. 2011 Nov;93(11):1928-34. doi: 10.1016/j.biochi.2011.07.014. Epub 2011 Jul 26. Biochimie. 2011. PMID: 21787833 Review.
Cited by
-
Polaris: Polarization of ancestral and derived polymorphic alleles for inferences of extended haplotype homozygosity in human populations.Bioinformatics. 2025 Jun 2;41(6):btaf171. doi: 10.1093/bioinformatics/btaf171. Bioinformatics. 2025. PMID: 40221866 Free PMC article.
-
Neutral Theory and the Somatic Evolution of Cancer.Mol Biol Evol. 2018 Jun 1;35(6):1308-1315. doi: 10.1093/molbev/msy079. Mol Biol Evol. 2018. PMID: 29684198 Free PMC article.
-
Rapid divergence of a gamete recognition gene promoted macroevolution of Eutheria.Genome Biol. 2022 Jul 11;23(1):155. doi: 10.1186/s13059-022-02721-y. Genome Biol. 2022. PMID: 35821049 Free PMC article.
References
-
- Aguileta G, Refregier G, Yockteng R, Fournier E, Giraud T.. 2009. Rapidly evolving genes in pathogens: methods for detecting positive selection and examples among fungi, bacteria, viruses and protists. Infect Genet Evol. 94:656–670. - PubMed
MeSH terms
Grants and funding
LinkOut - more resources
Full Text Sources
Other Literature Sources
Molecular Biology Databases
