

Editor's Highlight: PPARβ/δ and PPARγ Inhibit Melanoma Tumorigenicity by Modulating Inflammation and Apoptosis
- PMID: 28962521
- PMCID: PMC5837686
- DOI: 10.1093/toxsci/kfx147
Editor's Highlight: PPARβ/δ and PPARγ Inhibit Melanoma Tumorigenicity by Modulating Inflammation and Apoptosis
Abstract
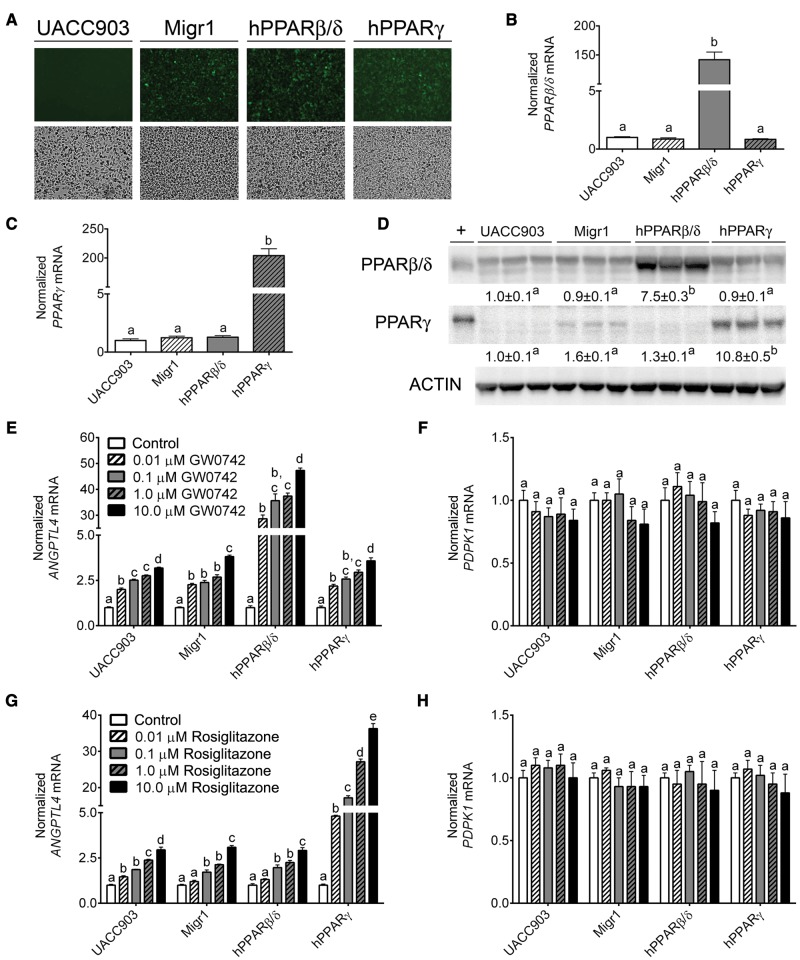
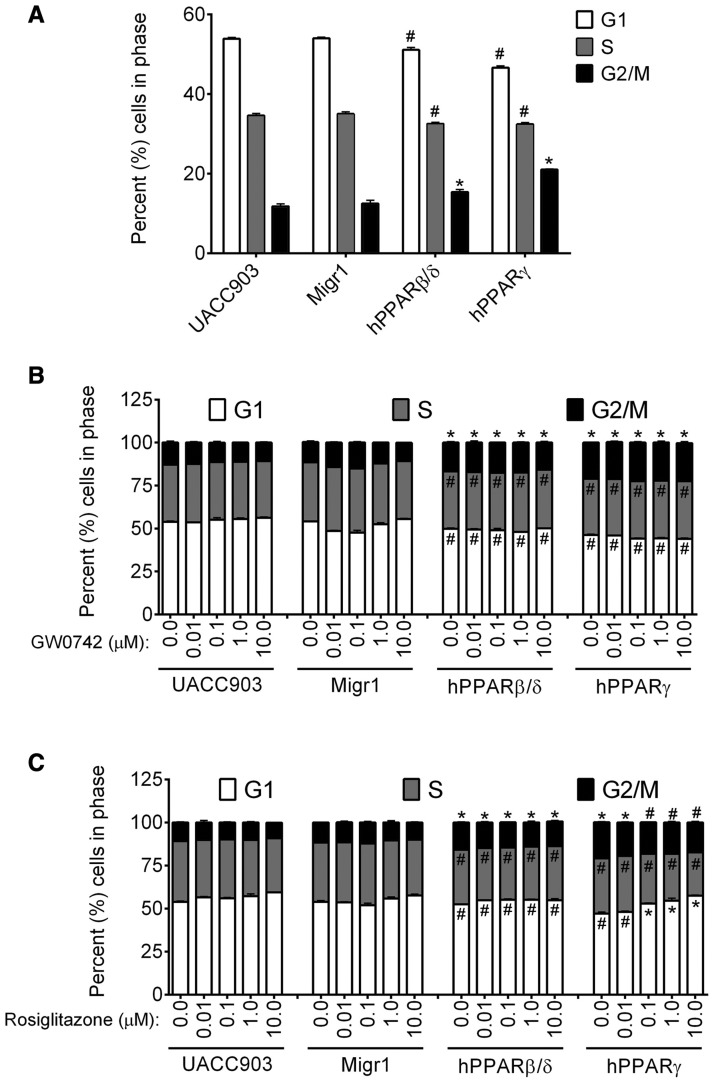
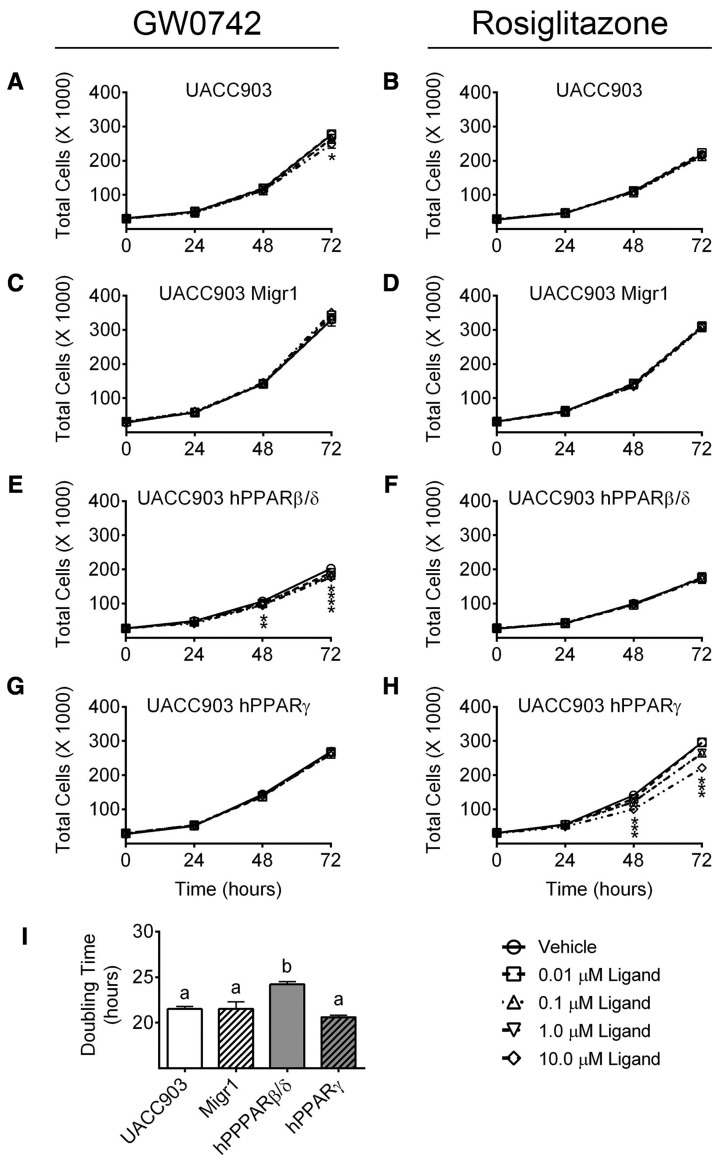
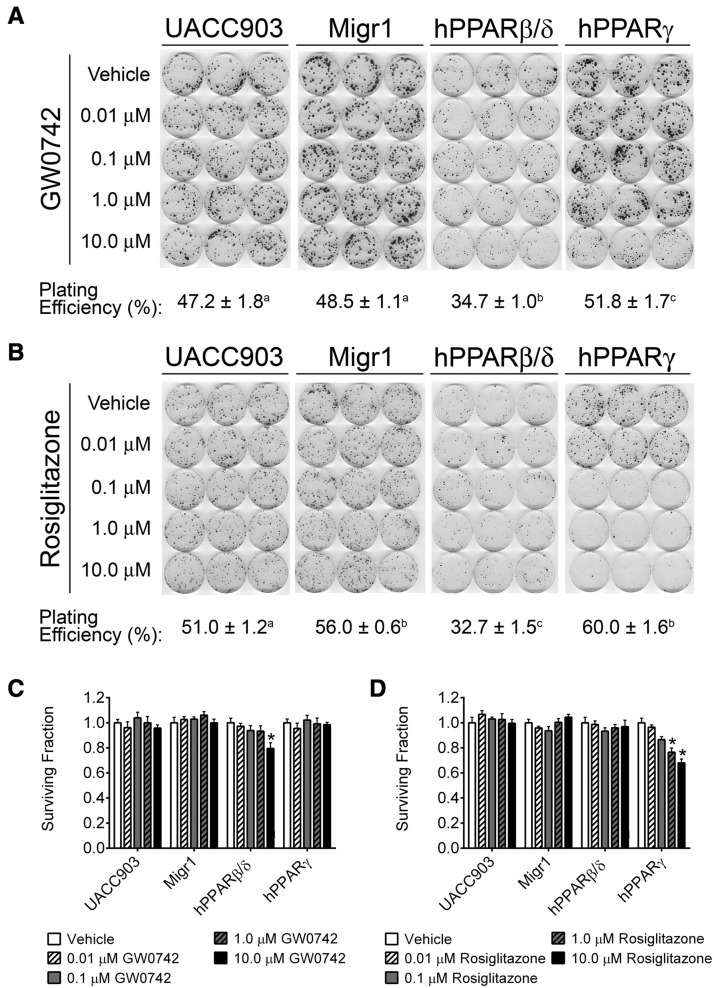
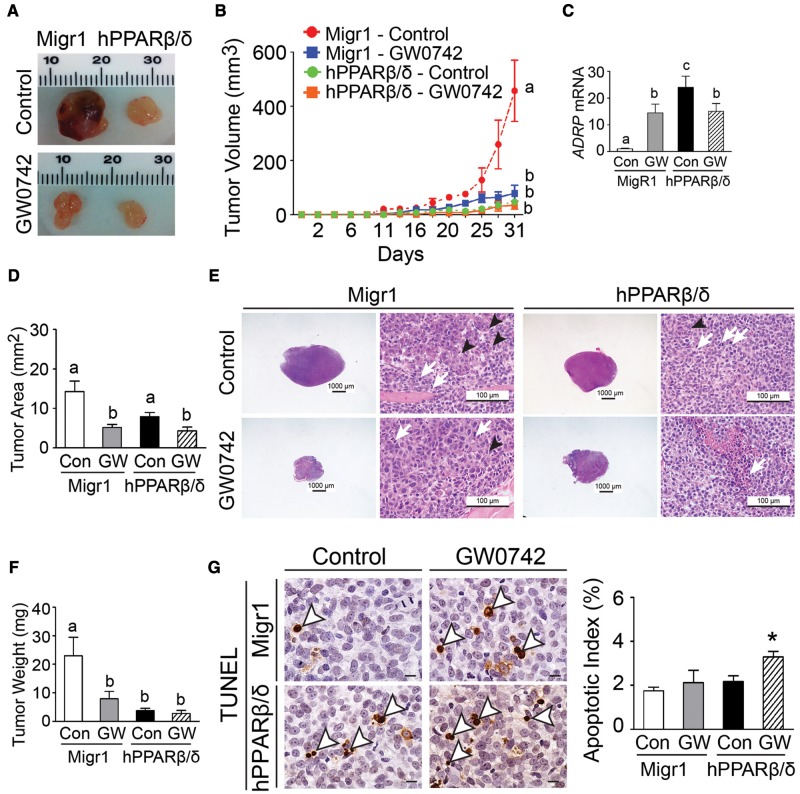
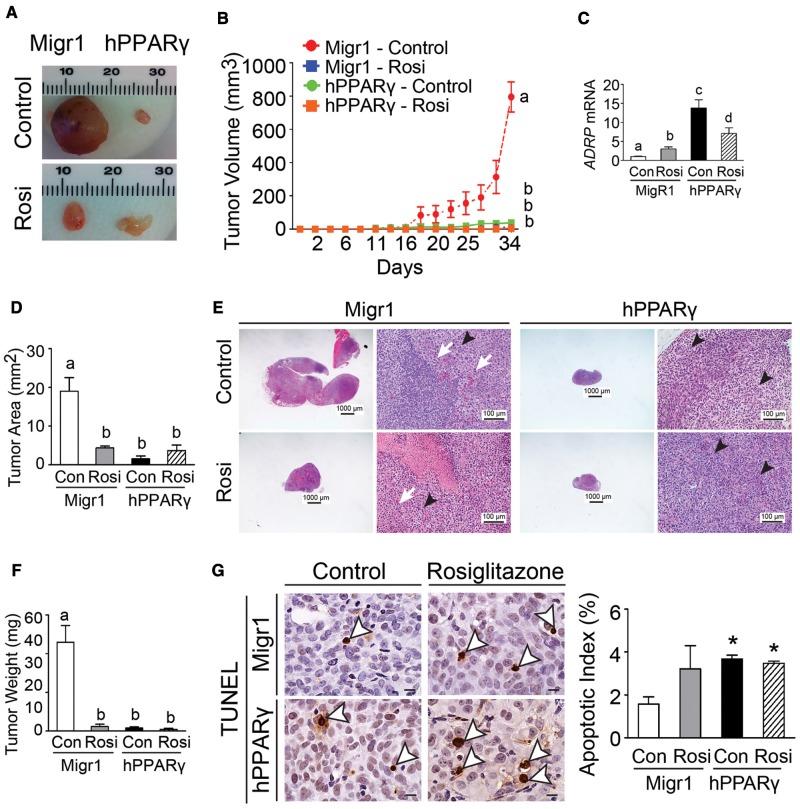
Skin tumorigenesis results from DNA damage, increased inflammation, and evasion of apoptosis. The peroxisome proliferator-activated receptors (PPARs) can modulate these mechanisms in non-melanoma skin cancer. However, limited data exists regarding the role of PPARs in melanoma. This study examined the effect of proliferator-activated receptor-β/δ (PPARβ/δ) and PPARγ on cell proliferation, anchorage-dependent clonogenicity, and ectopic xenografts in the UACC903 human melanoma cell line. Stable overexpression of either PPARβ/δ or PPARγ enhanced ligand-induced expression of a PPARβ/δ/PPARγ target gene in UACC903 cell lines as compared with controls. The induction of target gene expression by ligand activation of PPARγ was not altered by overexpression of PPARβ/δ, or vice versa. Stable overexpression of either PPARβ/δ or PPARγ reduced the percentage of cells in the G1 and S phase of the cell cycle, and increased the percentage of cells in the G2/M phase of the cell cycle in UACC903 cell lines as compared with controls. Ligand activation of PPARβ/δ did not further alter the distribution of cells within each phase of the cell cycle. By contrast, ligand activation of PPARγ enhanced these changes in stable UACC903 cells overexpressing PPARγ compared with controls. Stable overexpression of either PPARβ/δ or PPARγ and/or ligand activation of either PPARβ/δ or PPARγ inhibited cell proliferation, and anchorage-dependent clonogenicity of UACC903 cell lines as compared with controls. Further, overexpression of either PPARβ/δ or PPARγ and/or ligand activation of either PPARβ/δ or PPARγ inhibited ectopic xenograft tumorigenicity derived from UACC903 melanoma cells as compared with controls, and this was likely due in part to induction of apoptosis. Results from these studies demonstrate the antitumorigenic effects of both PPARβ/δ and PPARγ and suggest that targeting these receptors may be useful for primary or secondary melanoma chemoprevention.
Keywords: (PPARβ/δ); (PPARγ); cancer; cell proliferation; melanoma; peroxisome proliferator-activated receptor-β/δ; peroxisome proliferator-activated receptor-γ; xenografts.
© The Author 2017. Published by Oxford University Press on behalf of the Society of Toxicology. All rights reserved. For Permissions, please e-mail: journals.permissions@oup.com.
Figures
Similar articles
-
Peroxisome-proliferator-activated receptors γ and β/δ mediate vascular endothelial growth factor production in colorectal tumor cells.J Cancer Res Clin Oncol. 2011 Jan;137(1):29-39. doi: 10.1007/s00432-010-0856-1. Epub 2010 Mar 11. J Cancer Res Clin Oncol. 2011. PMID: 20221637 Free PMC article.
-
Inhibition of tumorigenesis by peroxisome proliferator-activated receptor (PPAR)-dependent cell cycle blocks in human skin carcinoma cells.Toxicology. 2018 Jul 1;404-405:25-32. doi: 10.1016/j.tox.2018.05.003. Epub 2018 May 3. Toxicology. 2018. PMID: 29729928 Free PMC article.
-
Peroxisome proliferator-activated receptor-gamma agonists cause growth arrest and apoptosis in human ovarian carcinoma cell lines.Int J Gynecol Cancer. 2007 Mar-Apr;17(2):418-25. doi: 10.1111/j.1525-1438.2006.00866.x. Epub 2007 Feb 19. Int J Gynecol Cancer. 2007. PMID: 17316361
-
Systemic pharmacological treatments for chronic plaque psoriasis: a network meta-analysis.Cochrane Database Syst Rev. 2021 Apr 19;4(4):CD011535. doi: 10.1002/14651858.CD011535.pub4. Cochrane Database Syst Rev. 2021. Update in: Cochrane Database Syst Rev. 2022 May 23;5:CD011535. doi: 10.1002/14651858.CD011535.pub5. PMID: 33871055 Free PMC article. Updated.
-
Topotecan, pegylated liposomal doxorubicin hydrochloride and paclitaxel for second-line or subsequent treatment of advanced ovarian cancer: a systematic review and economic evaluation.Health Technol Assess. 2006 Mar;10(9):1-132. iii-iv. doi: 10.3310/hta10090. Health Technol Assess. 2006. PMID: 16545208
Cited by
-
PPARs and the Kynurenine Pathway in Melanoma-Potential Biological Interactions.Int J Mol Sci. 2023 Feb 4;24(4):3114. doi: 10.3390/ijms24043114. Int J Mol Sci. 2023. PMID: 36834531 Free PMC article. Review.
-
Lack of PPARβ/δ-Inactivated SGK-1 Is Implicated in Liver Carcinogenesis.Biomed Res Int. 2020 Oct 2;2020:9563851. doi: 10.1155/2020/9563851. eCollection 2020. Biomed Res Int. 2020. PMID: 33083492 Free PMC article.
-
Diminished Hepatocarcinogenesis by a Potent, High-Affinity Human PPARα Agonist in PPARA-Humanized Mice.Toxicol Sci. 2021 Aug 30;183(1):70-80. doi: 10.1093/toxsci/kfab067. Toxicol Sci. 2021. PMID: 34081128 Free PMC article.
-
Low expression of the PPARγ-regulated gene thioredoxin-interacting protein accompanies human melanoma progression and promotes experimental lung metastases.Sci Rep. 2021 Apr 12;11(1):7847. doi: 10.1038/s41598-021-86329-5. Sci Rep. 2021. PMID: 33846376 Free PMC article.
-
ROS release by PPARβ/δ-null fibroblasts reduces tumor load through epithelial antioxidant response.Oncogene. 2018 Apr;37(15):2067-2078. doi: 10.1038/s41388-017-0109-8. Epub 2018 Jan 25. Oncogene. 2018. PMID: 29367760 Free PMC article.
References
-
- Borland M. G., Foreman J. E., Girroir E. E., Zolfaghari R., Sharma A. K., Amin S., Gonzalez F. J., Ross A. C., Peters J. M. (2008). Ligand activation of peroxisome proliferator-activated receptor-β/δ inhibits cell proliferation in human HaCaT keratinocytes. Mol. Pharmacol. 74, 1429–1442. - PMC - PubMed
-
- Botton T., Puissant A., Bahadoran P., Annicotte J. S., Fajas L., Ortonne J. P., Gozzerino G., Zamoum T., Tartare-Deckert S., Bertolotto C., et al. (2009). In vitro and invivo anti-melanoma effects of ciglitazone. J. Invest. Dermatol. 129, 1208–1218. - PubMed
Publication types
MeSH terms
Substances
Grants and funding
LinkOut - more resources
Full Text Sources
Other Literature Sources
Medical
