

Arterio-venous fetoplacental vascular geometry and hemodynamics in the mouse placenta
- PMID: 28962695
- PMCID: PMC5679460
- DOI: 10.1016/j.placenta.2017.08.007
Arterio-venous fetoplacental vascular geometry and hemodynamics in the mouse placenta
Abstract
Introduction: The fetoplacental vasculature network is essential for the exchange of nutrients, gases and wastes with the maternal circulation and for normal fetal development. The present study quantitatively compares arterial and venous morphological and functional differences in the mouse fetoplacental vascular network.
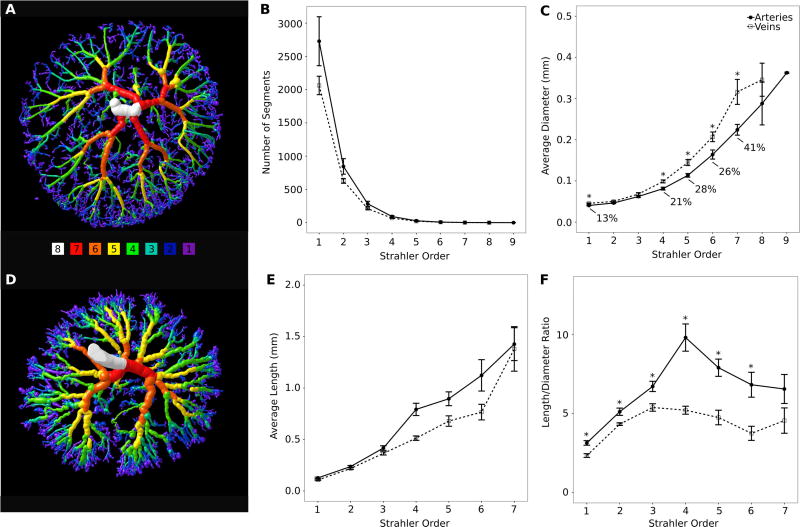
Methods: High resolution X-ray micro-computed tomography was used to visualize the 3D geometry of the arterial and venous fetoplacental vasculature in embryonic day 15.5 CD-1 mice (n = 5). Automated image analysis was used to measure the vascular geometry of the approximately 4100 arterial segments and 3200 venous segments per specimen to simulate blood flow through these networks.
Results: Both the arterial and venous trees demonstrated a hierarchical branching structure with 8 or 9 (arterial) or 8 (venous) orders. The venous tree was smaller in volume and overall dimensions than the arterial tree. Venous vessel diameters increased more rapidly than arteries with each successive order, leading to lower overall resistance, although the umbilical vein was notably smaller and of higher resistance than these scaling relationships would predict. Simulation of blood flow for these vascular networks showed that 57% of total resistance resides in the umbilical artery and arterial tree, 17% in the capillary bed, and 26% in the venous tree and umbilical vein.
Discussion: A detailed examination of the mouse fetoplacental arterial and venous tree revealed features, such as the distribution of resistance and the dimension of the venous tree, that were both morphologically distinct from other vascular beds and that appeared adapted to the specialized requirements of sustaining a fetus.
Keywords: Arteries; Fetoplacental vasculature; Hemodynamics; Micro-computed tomography; Mouse; Veins.
Copyright © 2017 Elsevier Ltd. All rights reserved.
Conflict of interest statement
Conflicts of interest: none
Figures


References
-
- Adamson SL, Lu Y, Whiteley KJ, Holmyard D, Hemberger M, Pfarrer C, Cross JC. Interactions between trophoblast cells and the maternal and fetal circulation in the mouse placenta. Dev. Biol. 2002;250:358–373. - PubMed
-
- Karimu AL, Burton GJ. The effects of maternal vascular pressure on the dimensions of the placental capillaries. Br. J. Obstet. Gynaecol. 1994;101:57–63. - PubMed
-
- Naro ED, Ghezzi F, Raio L, Franchi M, D’Addario V. Umbilical cord morphology and pregnancy outcome. Eur. J. Obstet. Gynecol. Reprod. Biol. 2001;96:150–157. - PubMed
-
- Adamson SL. Arterial pressure, vascular input impedance, and resistance as determinants of pulsatile blood flow in the umbilical artery. Eur. J. Obstet. Gynecol. Reprod. Biol. 1999;84:119–125. - PubMed
-
- Langheinrich AC, Wienhard J, Vormann S, Hau B, Bohle RM, Zygmunt M. Analysis of the fetal placental vascular tree by X-ray micro-computed tomography. Placenta. 2004;25:95–100. - PubMed
MeSH terms
Grants and funding
LinkOut - more resources
Full Text Sources
Other Literature Sources
