. 2018 Jan;8(1):108-125.
doi: 10.1158/2159-8290.CD-17-0532. Epub 2017 Sep 29.

Somatic Superenhancer Duplications and Hotspot Mutations Lead to Oncogenic Activation of the KLF5 Transcription Factor

Affiliations

Somatic Superenhancer Duplications and Hotspot Mutations Lead to Oncogenic Activation of the KLF5 Transcription Factor

Xiaoyang Zhang et al. Cancer Discov. 2018 Jan.

Abstract

The Krüppel-like family of transcription factors plays critical roles in human development and is associated with cancer pathogenesis. Krüppel-like factor 5 gene (KLF5) has been shown to promote cancer cell proliferation and tumorigenesis and to be genomically amplified in cancer cells. We recently reported that the KLF5 gene is also subject to other types of somatic coding and noncoding genomic alterations in diverse cancer types. Here, we show that these alterations activate KLF5 by three distinct mechanisms: (i) Focal amplification of superenhancers activates KLF5 expression in squamous cell carcinomas; (ii) Missense mutations disrupt KLF5-FBXW7 interactions to increase KLF5 protein stability in colorectal cancer; (iii) Cancer type-specific hotspot mutations within a zinc-finger DNA binding domain of KLF5 change its DNA binding specificity and reshape cellular transcription. Utilizing data from CRISPR/Cas9 gene knockout screening, we reveal that cancer cells with KLF5 overexpression are dependent on KLF5 for their proliferation, suggesting KLF5 as a putative therapeutic target.Significance: Our observations, together with previous studies that identified oncogenic properties of KLF5, establish the importance of KLF5 activation in human cancers, delineate the varied genomic mechanisms underlying this occurrence, and nominate KLF5 as a putative target for therapeutic intervention in cancer. Cancer Discov; 8(1); 108-25. ©2017 AACR.This article is highlighted in the In This Issue feature, p. 1.


Conflict of interest statement

Conflict of interest: Galen F. Gao, Ashton C. Berger, Andrew D. Cherniack, and Matthew Meyerson receive research support from Bayer Pharmaceuticals. Matthew Meyerson is a consultant for and equity holder in OrigiMed. William C. Hahn receives research support from Novartis.

Figures
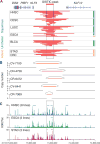
Figure 1
Figure 1. Super-enhancers near the KLF5 gene are focally amplified in diverse cancer types
A. Copy number profile of the 13q22.1 noncoding region from head and neck squamous cell carcinomas (HNSC), cervical squamous cell carcinomas (CESC), lung squamous cell carcinomas (LUSC), esophageal carcinomas (ESCA), bladder carcinomas (BLCA), stomach adenocarcinomas (STAD), and colorectal carcinomas (CRC). The copy number peak, defined by statistical analysis with GISTIC (2,109), in HNSC is highlighted. Color code is based on lineage types: squamous cell carcinomas, blue; urothelial carcinomas, green; adenocarcinomas, orange. B. DNA rearrangement analysis of the amplified noncoding region, using whole-genome sequencing data of head and neck squamous carcinoma samples from The Cancer Genome Atlas (TCGA) and the LUMPY program (37), demonstrates tandem duplications, as indicated by the curves. C. The merged ChIP-seq signal of the enhancer marker H3K27ac from cell lines representing HNSC, ESCA, and STAD. Super-enhancers, indicated by thin bars, are called by the ROSE pipeline (–41) based on the H3K27ac signal enrichment.
Figure 2
Figure 2. The focally amplified super-enhancers activate KLF5 expression
A. Chromatin interaction, as measured by Hi-C in the lung fibroblast cell line IMR90, is presented in the KLF5 locus. The topologically associated domains (TAD) are indicated as grey bars. B. Four individual enhancers, e1-e4, within the super-enhancers are defined by p300 ChIP-seq signal from the HNSC cell line BICR31. C. Chromatin interaction, as measured by 3C-qPCR, between the e1 enhancer and promoters of surrounding genes including BORA, DIS3, PIBF1, KLF5, and KLF12 (upper panel), and between the KLF5 promoter and the four individual enhancers e1-e4 of the super-enhancer region (lower panel) in BICR31 and BICR6 cells (n=2). The interaction frequency between the KLF5 promoter and the e1 enhancer in each panel is represented by the same data. 3C viewpoints are indicated as grey lines. Error bars, standard deviation (s.d.). D. The expression level of KLF5 after KRAB-dCas9-mediated repression of the individual enhancers e1-e4 in BICR31 cells (n=2). sg-Ctrl #1 and #2: control sgRNAs that are predicted to not recognize any genomic regions. Two separate sgRNAs are applied for each enhancer. Multiplexed repression of the e1, e3, and e4 enhancers (sg-e1 #1, sg-e3 #1, and sg-e4 #1) is highlighted in red. The expression level is normalized to the control (sg-Ctrl #1). Error bars, s.d. P values were derived from t tests: *P ≤ 0.05, **P ≤ 0.01. E. Luciferase reporter assays (n=3) measuring the activity of the individual enhancers e1, e3 and e4, and the combinatorial activity of the three enhancers in driving the luciferase expression in BICR31 cells. Luciferase signal is normalized to the empty luciferase reporter construct. Error bars, s.d. P values were derived from t tests: **P ≤ 0.01, ***P ≤ 0.001. F. ChIP-seq profile of H3K27ac in BICR31 cells with and without KRAB-dCas9-mediated multiplexed repression of the three enhancers e1, e3 and e4. The targeted regions are highlighted as grey boxes.
Figure 3
Figure 3. KLF5 activates cell identity genes and cancer-related genes in head and neck squamous cell carcinoma cells
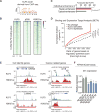
A. Predicted DNA binding motif of KLF5 derived from the DNA binding pattern of endogenous KLF5, detected by ChIP-seq. B. Enrichment of p300 binding and H3K27ac marks centered around KLF5 binding sites (n=10,562) in BICR31 cells. C. Percentage of individual enhancers, as defined by p300 binding, bound by KLF5 in typical and super-enhancers called from H3K27ac ChIP-seq signals merged from eight HNSC cell lines. P value was derived from a fisher exact test. D. Binding and Expression Target Analysis (BETA) predicting the activating and repressive function of KLF5. The KLF5 ChIP-seq binding sites are integrated with the expression data from the RNA-seq profile in BICR31 cells with and without siRNA-mediated KLF5 silencing (n=3). More details are described in the Methods section. The red, grey and black lines represent genes activated, repressed or unaffected by KLF5, respectively. Percentage of genes is cumulated by the rank of genes based on their regulatory potential scores. P values were derived from Kolmogorov-Smirnov tests. E. Examples of super-enhancer-driven cell identity genes (left) and cancer-related genes (right) activated by KLF5. ChIP-seq profile of KLF5 binding (in BICR31) and H3K27ac marks (merged from eight HNSC cell lines), and distribution of the identified super-enhancers (SE). Fold change in the expression level of KLF5-target genes in BICR31 cells with and without siRNA-mediated KLF5 silencing, as measured by RNA-seq (n=3), is indicated underneath. F. KRAB-dCas9 mediated repression of the e1 and e2 enhancers adjacent to ID1 (indicated in Figure 3E; n=3) reduced ID1 expression. Expression levels are normalized to the control (sg-Ctrl #1). Error bars, s.d. P values were derived from t tests: *P ≤ 0.05, **P ≤ 0.01, ***P ≤ 0.001.
Figure 4
Figure 4. Functional characterization of KLF5 hotspot mutations in a phospho-degron domain
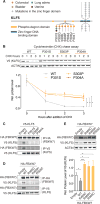
A. Two mutation hotspots were identified in the KLF5 gene in a phospho-degron domain, and in a zinc-finger DNA binding domain. Mutations in different cancer types are color-coded. B. The colorectal carcinoma HCT116 cell line expressing V5-tagged wild-type KLF5, or KLF5 P301S, S303P or P304A mutants, was treated with 100 ug/ml cycloheximide (CHX) for 0, 1, 2, and 3 hours, followed by immunoblotting for V5 and actin. Protein levels of WT and mutant KLF5 after CHX treatment was quantified (n=2) and normalized to 0 hour (no treatment). Error bars, s.d. P values were derived from student t tests: *P ≤ 0.05. C. Co-immunoprecipitation assays using antibodies against V5 (tagged to KLF5) and HA (tagged to FBXW7) in HCT116 cells overexpressing V5-tagged KLF5 WT and mutants. D. Co-immunoprecipitation assays using antibodies against V5 (tagged to KLF5) and HA (tagged to FBXW7) in HCT116 cells overexpressing HA-tagged FBXW7 WT and mutants. E. Immunoblots show the protein level of V5-tagged KLF5 in HCT116 cells overexpressing HA-tagged FBXW7 WT and mutants. The protein level of V5-tagged KLF5 was quantified (n=3) and normalized to HCT116 cells transfected with an empty vector. Error bars, s.d. P values were derived from t tests: *P ≤ 0.05; ***P ≤ 0.001.
Figure 5
Figure 5. Functional characterization of KLF5 hotspot mutations in a DNA binding domain
A. A KLF5 mutation hotspot was identified in a zinc-finger DNA binding domain. Mutations in different cancer types are color-coded. B. Left: ChIP-seq assays in HEK293T cells revealed the DNA binding motifs recognized by KLF5 WT and mutants. The nucleotide differences in the DNA binding motifs are highlighted by green boxes. Right: the binding profile of KLF5 WT and mutants in the top 10% most variable KLF5 binding sites (n=1,165). Normalization of the binding signal is described in the Methods section. C. Comparison of binding sites of KLF5 WT and E419Q in the lung squamous carcinoma cell line HCC95. DNA binding motifs are identified in the binding sites shared or unique to KLF5 WT and E419Q. D. Averaged ChIP-seq signal of V5-KLF5 (left) and H3K27ac (right), centered at the gained, shared, or lost binding sites of KLF5 E419Q, in HCC95 cells. E. Binding and Expression Target Analysis (BETA) predicting the activating and repressive function of KLF5 E419Q. The 5,611 KLF5 E419Q-unique binding sites were used for the analysis. The gene expression data were derived from RNA sequencing in the lung squamous carcinoma HCC95 cell line with KLF5 WT or E419Q overexpressed (n=2). F. Examples of KLF5 E419Q target genes. ChIP-seq profile of V5 (KLF5) and H3K27ac in HCC95 cells overexpressing KLF5 WT or E419Q. The novel super-enhancers associated with KLF5 E419Q are indicated. The fold change of the target genes FOXE1 and NAMPT between HCC95 cells overexpressing KLF5 WT and E419Q, as measured by RNA-seq (n=2), is indicated on the bottom.
Figure 6
Figure 6. KLF5 activation confers a dependency of cancer cells on KLF5
A. Left: Cell proliferation assay of the head and neck squamous carcinoma cell line, BICR31, with and without siRNA-mediated KLF5 silencing (n=3, cells were counted 6 days post transfection). Right: Cell proliferation assay of BICR31 with and without KRAB-dCas9-mediated multiplexed repression of the e1, e3 and e4 enhancers of KLF5 (n=3, cells were counted 7 days after seeded). Cell number is normalized to the controls (siNC #1 or sg-Ctrl #1). Error bars, s.d. P values were derived from t tests: **P ≤ 0.01. B. Left: immunoblots showing the ectopic expression of ID1 protein in BICR31 cells. Right: overexpression of ID1 rescued the proliferation-inhibitory effect of silencing KLF5 in BICR31 cells (n=3). Cell number is normalized to the controls (siNC #1-Empty or siNC #1-ID1). Error bars, s.d. P values were derived from t tests: **P ≤ 0.01. C. Cell proliferation assay in the lung squamous carcinoma cell line HCC95 overexpressing KLF5 WT or E419Q (with or without V5 tag), in low serum (1% FBS) media (n=3). Cell number is normalized to an empty vector control. Error bars, s.d. P values were derived from t tests: **P ≤ 0.01. D. The relationship between the gene expression level of KLF5 (log2 transformed RNA-seq TPM, transcripts per million reads values) and CRISPR gene dependency ATARiS score (122) of KLF5 across 32 cancer cell lines that were included in the Broad Institute GeCKO gene knockout screening (82). E. Schematic diagram: KLF5 can be activated on the transcriptional level by noncoding super-enhancer amplifications, on the protein level by missense mutations in a CPD phospho-degron domain of KLF5 or in the WD40-repeat protein interaction domains of FBXW7, and on the activity level by missense mutations in a zinc-finger DNA binding domain of KLF5.

References

    1. Bass AJ, Watanabe H, Mermel CH, Yu S, Perner S, Verhaak RG, et al. SOX2 is an amplified lineage-survival oncogene in lung and esophageal squamous cell carcinomas. Nat Genet. 2009;41:1238–42. - PMC - PubMed
    1. Beroukhim R, Mermel CH, Porter D, Wei G, Raychaudhuri S, Donovan J, et al. The landscape of somatic copy-number alteration across human cancers. Nature. 2010;463:899–905. - PMC - PubMed
    1. Garraway LA, Widlund HR, Rubin MA, Getz G, Berger AJ, Ramaswamy S, et al. Integrative genomic analyses identify MITF as a lineage survival oncogene amplified in malignant melanoma. Nature. 2005;436:117–22. - PubMed
    1. Visakorpi T, Hyytinen E, Koivisto P, Tanner M, Keinänen R, Palmberg C, et al. In vivo amplification of the androgen receptor gene and progression of human prostate cancer. Nat Genet. 1995;9:401–6. - PubMed
    1. Little CD, Nau MM, Carney DN, Gazdar AF, Minna JD. Amplification and expression of the c-myc oncogene in human lung cancer cell lines. Nature. 1983;306:194–6. - PubMed

Publication types

MeSH terms

Substances