

LncRNA wires up Hippo and Hedgehog signaling to reprogramme glucose metabolism
- PMID: 28963395
- PMCID: PMC5686550
- DOI: 10.15252/embj.201797609
LncRNA wires up Hippo and Hedgehog signaling to reprogramme glucose metabolism
Abstract
The Hippo pathway plays essential roles in organ size control and cancer prevention via restricting its downstream effector, Yes-associated protein (YAP). Previous studies have revealed an oncogenic function of YAP in reprogramming glucose metabolism, while the underlying mechanism remains to be fully clarified. Accumulating evidence suggests long noncoding RNAs (lncRNAs) as attractive therapeutic targets, given their roles in modulating various cancer-related signaling pathways. In this study, we report that lncRNA breast cancer anti-estrogen resistance 4 (BCAR4) is required for YAP-dependent glycolysis. Mechanistically, YAP promotes the expression of BCAR4, which subsequently coordinates the Hedgehog signaling to enhance the transcription of glycolysis activators HK2 and PFKFB3. Therapeutic delivery of locked nucleic acids (LNAs) targeting BCAR4 attenuated YAP-dependent glycolysis and tumor growth. The expression levels of BCAR4 and YAP are positively correlated in tissue samples from breast cancer patients, where high expression of both BCAR4 and YAP is associated with poor patient survival outcome. Taken together, our study not only reveals the mechanism by which YAP reprograms glucose metabolism, but also highlights the therapeutic potential of targeting YAP-BCAR4-glycolysis axis for breast cancer treatment.
Keywords: HK2; Hippo pathway; LncRNA; Yes‐associated protein; glycolysis.
© 2017 College of Life Sciences, Zhejiang University.
Figures
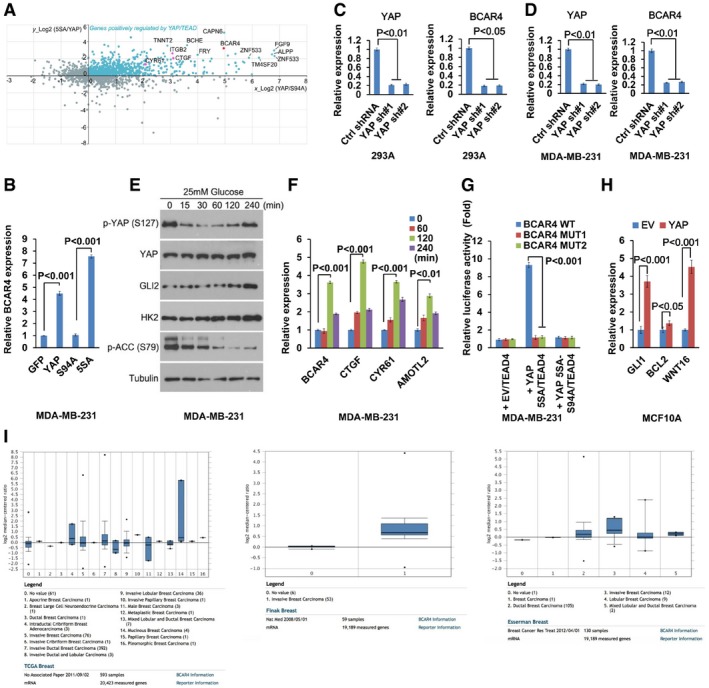
BCAR4 was identified as one of the YAP downstream targets. Published YAP microarray data were analyzed and illustrated. Known YAP downstream genes are highlighted in purple. LncRNA BCAR4 is highlighted in red.
The transcriptional activity of YAP was required for the upregulation of BCAR4. The transcription of BCAR4 was examined by quantitative PCR in the MDA‐MB‐231 cells expressing indicated YAP mutants (mean ± s.d., n = 3 biological replicates, Student's t‐test).
The expression of BCAR4 was analyzed in control and YAP knockdown HEK293A cells (mean ± s.d., n = 3 biological replicates, Student's t‐test).
The expression of BCAR4 was analyzed in control and YAP knockdown MDA‐MB‐231 cells (mean ± s.d., n = 3 biological replicates, Student's t‐test).
GLI2, HK2, and phosphorylation of YAP were regulated by glucose deprivation and stimulation. HEK293A cells were glucose‐starved for 24 h and then stimulated with glucose (25 mM) for the indicated intervals.
Glucose induced the expression of BCAR4. MDA‐MB‐231 cells were glucose‐starved for 24 h and then stimulated with glucose (25 mM) for the indicated intervals (mean ± s.d., n = 3 biological replicates, Student's t‐test).
BCAR4 promoter luciferase reporter assay was performed by overexpressing YAP‐5SA or YAP‐5SA‐S94A, and TEAD4 in MDA‐MB‐231 (mean ± s.d., n = 3 biological replicates, Student's t‐test).
YAP promotes the transcription of the Hedgehog downstream genes (mean ± s.d., n = 3 biological replicates, Student's t‐test).
The expression of BCAR4 was analyzed in silico in human breast cancers by using the Oncomine database (
http://www.oncomine.org ). Representative data from three databases are shown. Box plot analysis is shown for each published breast cancer array database. Horizontal line, median value; box limits, value range between 25th and 75th percentile; whiskers, value range between 10th and 90th percentile; circles below and above whiskers, minimum and maximum values. The Oncomine analysis settings used were as follows: 10% gene rank, P‐value < 0.0001, fold change > 2.
- A
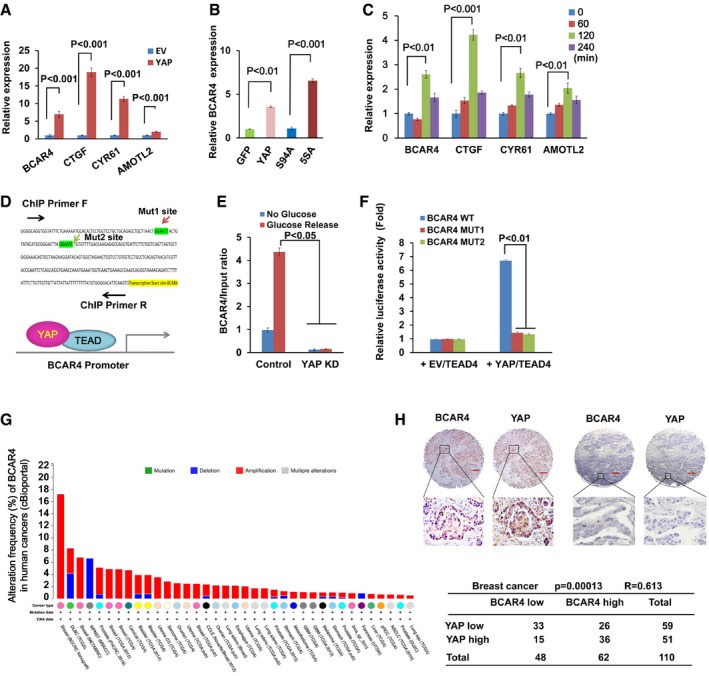
Overexpression of YAP induced the transcription of BCAR4. The transcription of BCAR4 and YAP downstream genes was examined in empty vector (EV) and YAP‐overexpressing MCF10A cells (mean ± s.d., n = 3 biological replicates, Student's t‐test).
- B
The transcriptional activity of YAP was required for the upregulation of BCAR4. The transcription of BCAR4 was examined by real‐time PCR in HEK293A cells stably expressing indicated YAP mutants (mean ± s.d., n = 3 biological replicates, Student's t‐test).
- C
Glucose induced the expression of BCAR4. HEK293A cells were glucose‐starved for 24 h and then stimulated with glucose (25 mM) for the indicated intervals (mean ± s.d., n = 3 biological replicates, Student's t‐test).
- D
Two YAP/TEAD‐binding elements were identified in the BCAR4 promoter region.
- E, F
YAP/TEAD directly regulates the transcription of BCAR4. Chromatin immunoprecipitation assay was performed by using YAP antibody in the glucose‐starved or stimulated MDA‐MB‐231 (E). BCAR4 promoter luciferase reporter assay was performed by overexpressing YAP‐5SA and TEAD4 in HEK293T (F) (mean ± s.d., n = 3 biological replicates, Student's t‐test).
- G
Distribution of alteration frequency of BCAR4 in multiple cancer types. Colors indicate different cancer types. Details in parentheses indicate the source of the corresponding tumor dataset. BCAR4 was analyzed in multiple cancers by using public database cBioportal (
http://www.cbioportal.org ). - H
The expressions of BCAR4 and YAP are positively correlated in breast cancer. RNAScope® detection of BCAR4 and immunohistochemical staining of YAP were performed by using breast cancer tissue arrays. Brown staining indicates positive immune reactivity. The region in each box is enlarged below. Scale bar, 200 μm. Correlations between YAP and BCAR4 levels in human breast tumors were analyzed as a table. Statistical significance was determined by the chi‐square test; R, correlation coefficient.
- A
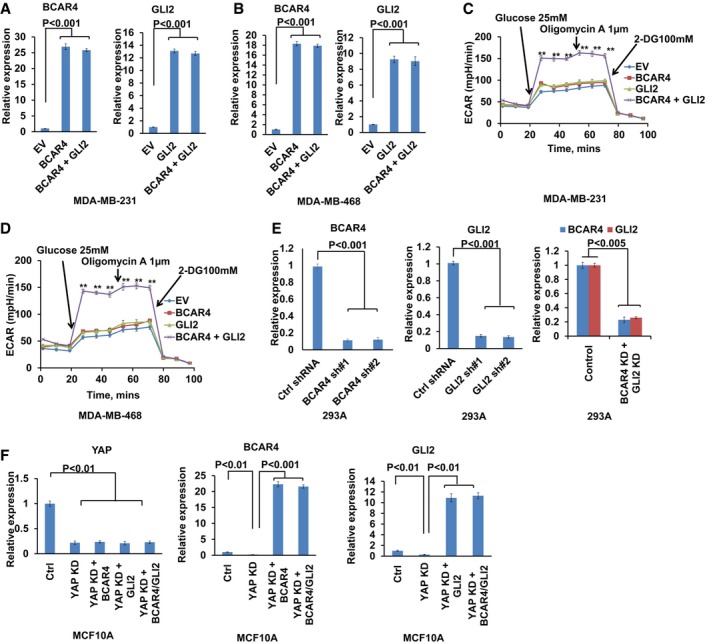
Quantitative analysis of BCAR4 and GLI2 gene expression in MDA‐MB‐231 with control empty vector (EV), BCAR4, GLI2, or BCAR4/GLI2 overexpression (mean ± s.d., n = 3 biological replicates, Student's t‐test).
- B
Quantitative analysis of BCAR4 and GLI2 gene expression in MDA‐MB‐468 with control empty vector (EV), BCAR4, GLI2, or BCAR4/GLI2 overexpression (mean ± s.d., n = 3 biological replicates, Student's t‐test).
- C, D
Kinetic extracellular acidification rate (ECAR) profiles were monitored with a Seahorse XF24 analyzer for 100 min. The metabolic inhibitors were injected sequentially at different time points as indicated (mean ± s.d., n = 3 biological replicates, Student's t‐test, **P < 0.01).
- E
shRNA‐mediated BCAR4, GLI2 knockdown efficiency was examined in YAP‐5SA‐overexpressing cells (mean ± s.d., n = 3 biological replicates, Student's t‐test).
- F
The expressions of YAP, BCAR4, and GLI2 were examined in the indicated stable cells (mean ± s.d., n = 3 biological replicates, Student's t‐test).
- A–C
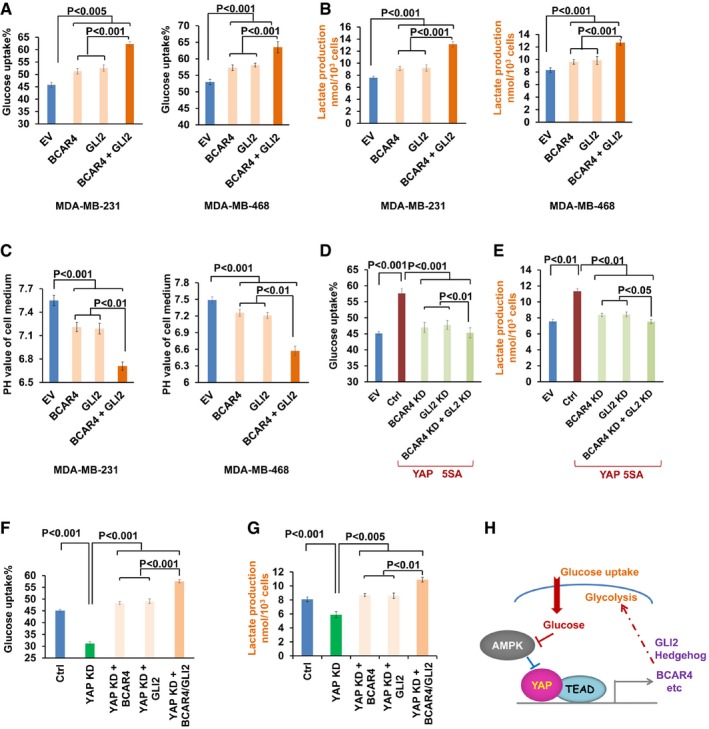
Overexpression of BCAR4/GLI2 induced glucose uptake (A), lactate production (B), and medium acidification (C) in MDA‐MB‐231 and MDA‐MB‐468 (mean ± s.d., n = 3 biological replicates, Student's t‐test).
- D, E
Downregulation of BCAR4/GLI2 rescued the YAP‐5SA‐induced glucose uptake (D) and lactate production (E) in YAP‐5SA‐overexpressing HEK293A cells (mean ± s.d., n = 3 biological replicates, Student's t‐test).
- F, G
Overexpression of BCAR4/GLI2 rescued the decrease in glucose uptake (F) and lactate production (G) in YAP knockdown MCF10A cells (mean ± s.d., n = 3 biological replicates, Student's t‐test).
- H
Graphic illustration of BCAR4/GLI2 signaling in YAP‐regulated glycolysis.
- A
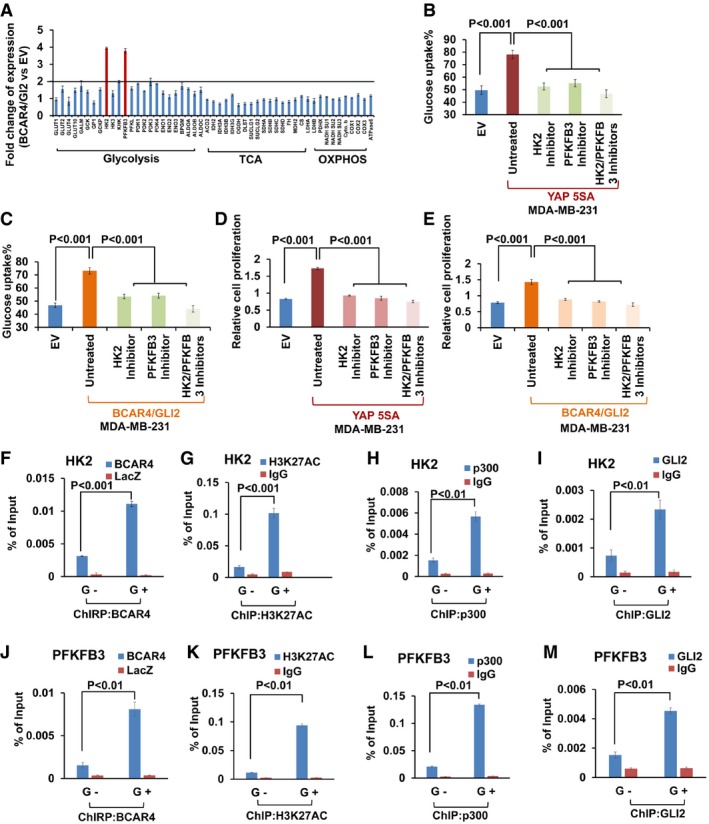
HK2 and PFKFB3 were identified as BCAR4/GLI2‐regulated genes. The transcripts of glucose metabolism, TCA, and oxidative phosphorylation (OXPHOS)‐related genes were detected by quantitative PCR in BCAR4/GLI2‐overexpressing cells and control empty vector‐transfected cells. Fold increases are shown (mean ± s.d., n = 3 biological replicates).
- B, C
Glucose uptake was examined in YAP (B) or BCAR4/GLI2 (C) overexpressing MDA‐MB‐231 cells with or without treatment with HK2 inhibitor (3‐BrPA, 10 μM) and PFKFB3 inhibitor (AZ PFKFB3 67, 10 nM) as indicated (mean ± s.d., n = 3 biological replicates, Student's t‐test).
- D, E
YAP (D) or BCAR4/GLI2 (E) overexpressing MDA‐MB‐231 cells were treated with or without HK2 inhibitor (3‐BrPA, 10 μM) and PFKFB3 inhibitor (AZ PFKFB3 67, 10 nM) for 72 h, and cell proliferation was examined (mean ± s.d., n = 3 biological replicates, Student's t‐test).
- F–I
ChIRP and ChIP assays to detect the association of BCAR4 (F), H3K27AC (G), p300 (H), and GLI2 (I) with HK2 promoter under glucose starved (G−) and glucose stimulated (G+) conditions (mean ± s.d., n = 3 biological replicates, Student's t‐test). G−, glucose starvation; G+, glucose stimulation.
- J–M
ChIRP and ChIP assays to detect the association of BCAR4 (J), H3K27AC (K), p300 (L), and GLI2 (M) with PFKFB3 promoter under glucose starved (G−) and glucose stimulated (G+) conditions (mean ± s.d., n = 3 biological replicates, Student's t‐test). G−, glucose starvation; G+, glucose stimulation.
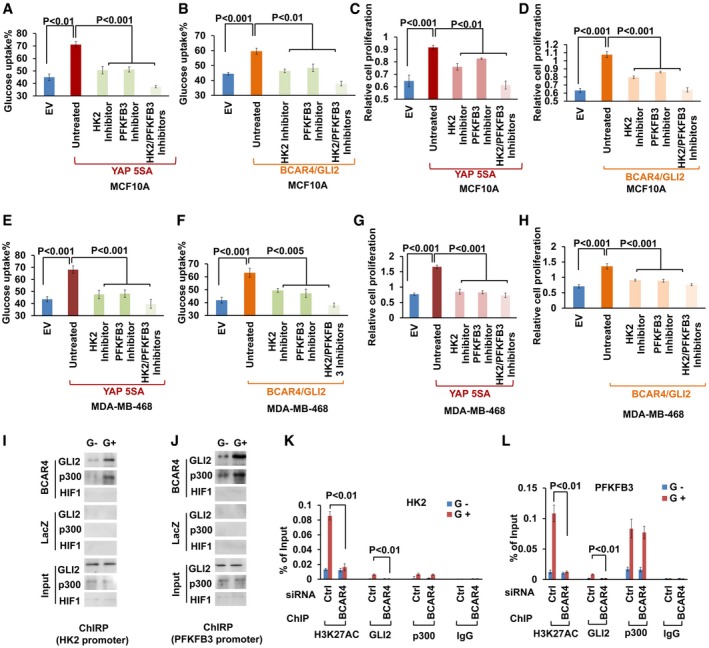
- A–D
Glucose uptake and cell proliferation was examined in (A, C) YAP or (B, D) BCAR4/GLI2‐overexpressing MCF10A cells with or without treatment with HK2 inhibitor (3‐BrPA, 15 μM) and PFKFB3 inhibitor (AZ PFKFB3 67, 15 nM) as indicated (mean ± s.d., n = 3 biological replicates, Student's t‐test).
- E–H
Glucose uptake and cell proliferation were examined in (E, G) YAP or (F, H) BCAR4/GLI2‐overexpressing MDA‐MB‐468 cells with or without treatment with HK2 inhibitor (3‐BrPA, 10 μM) and PFKFB3 inhibitor (AZ PFKFB3 67, 10 nM) as indicated (mean ± s.d., n = 3 biological replicates, Student's t‐test).
- I, J
ChIRP and immunoblot (IB) assay to detect the association of BCAR4, GLI2, and p300 with HK2 (I) or PFKFB3 promoter (J) under glucose starved (G−) and glucose stimulated (G+) conditions.
- K, L
ChIP quantitative PCR detection of H3K27AC, GLI2, and p300 occupancy on HK2 (K) or PFKFB3 (L) promoter in MDA‐MB‐231 cells transfected with control or BCAR4 siRNAs (mean ± s.d., n = 3 biological replicates, Student's t‐test).
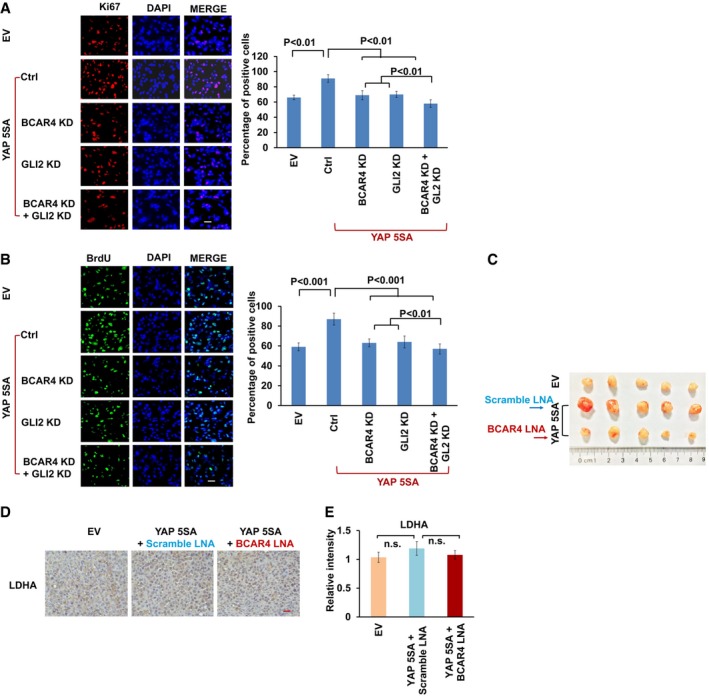
- A, B
Ki‐67 (A) and BrdU (B) staining was performed as indicated. Scale bars, 100 μm. The percentages of positive cells are summarized on the right (mean ± s.d., n = 3 biological replicates, Student's t‐test).
- C
Tumors excised from nude mice treated with scrambled LNA or BCAR4 LNA (25 mg/kg).
- D
Representative immunohistochemical images of LDHA are shown in the xenograft tumors. Scale bar, 200 μm.
- E
The relative intensities of LDHA immunohistochemical staining were quantified by Image‐pro plus 6.0 software (Media Cybernetics) (mean ± s.d., n = 3 biological replicates, Student's t‐test, n.s., no significant difference).
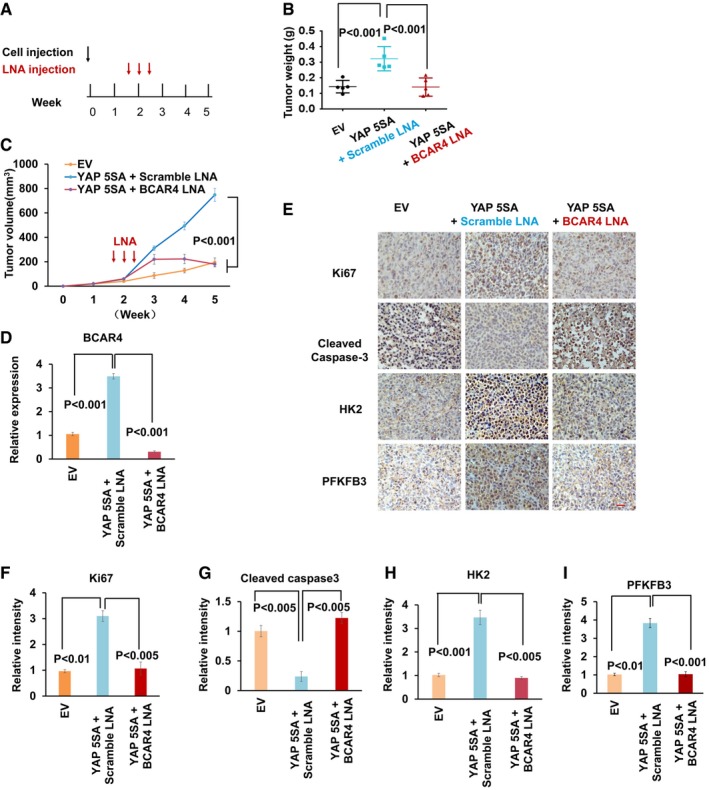
- A–C
Schematic illustration of LNA injection. 10 days after bearing breast tumors, nude mice were injected with scrambled LNA or BCAR4 LNA (25 mg/kg) every other day for three times (A). After 5 weeks, the tumors were excised and tumor weights (B) and bidimensional tumor measurements (C) were assessed (mean ± s.d., n = 5 tumor samples, Student's t‐test).
- D
Expression of BCAR4 was detected in the indicated xenograft tumors by quantitative PCR (mean ± s.d., n = 3 biological replicates, Student's t‐test).
- E
Representative immunohistochemical images of xenograft tumors are shown. Scale bar, 200 μm.
- F–I
The relative intensities of immunohistochemical staining (E) were quantified by Image‐pro plus 6.0 software (Media Cybernetics) (mean ± s.d., n = 3 biological replicates, Student's t‐test).
- A, B
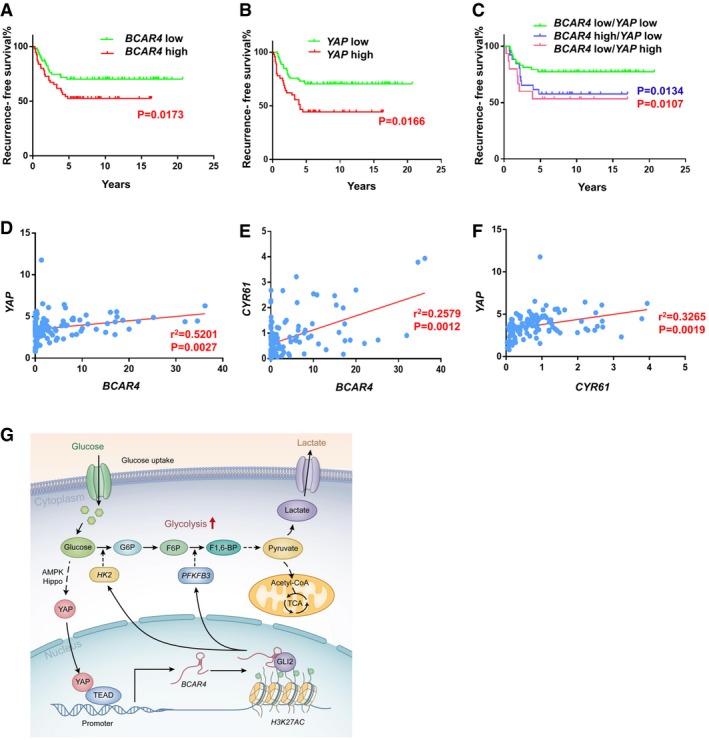
Recurrence‐free survival analysis of BCAR4 status (A) or YAP status (B) alone was performed in breast cancer patients (n = 123, Gehan‐Breslow test).
- C
Recurrence‐free survival analysis of BCAR4 and YAP associated status were examined in breast cancer patients (n = 123, Gehan‐Breslow test).
- D, E
The expression of BCAR4 was positively correlated with that of YAP (D) and CYR61 (E) by the chi‐square test; R, correlation coefficient (n = 123 patient samples).
- F
The expression of YAP was positively correlated with that of CYR61 by the chi‐square test; R, correlation coefficient (n = 123 patient samples).
- G
The graphic illustration of YAP‐BCAR4/GLI2 signaling axis in glycolysis.
References
-
- Bartucci M, Dattilo R, Moriconi C, Pagliuca A, Mottolese M, Federici G, Benedetto AD, Todaro M, Stassi G, Sperati F, Amabile MI, Pilozzi E, Patrizii M, Biffoni M, Maugeri‐Sacca M, Piccolo S, De Maria R (2015) TAZ is required for metastatic activity and chemoresistance of breast cancer stem cells. Oncogene 34: 681–690 - PubMed
-
- Boyd S, Brookfield JL, Critchlow SE, Cumming IA, Curtis NJ, Debreczeni J, Degorce SL, Donald C, Evans NJ, Groombridge S, Hopcroft P, Jones NP, Kettle JG, Lamont S, Lewis HJ, MacFaull P, McLoughlin SB, Rigoreau LJ, Smith JM, St‐Gallay S et al (2015) Structure‐based design of potent and selective inhibitors of the metabolic kinase PFKFB3. J Med Chem 58: 3611–3625 - PubMed
-
- Fatica A, Bozzoni I (2014) Long non‐coding RNAs: new players in cell differentiation and development. Nat Rev Genet 15: 7–21 - PubMed
MeSH terms
Substances
Grants and funding
LinkOut - more resources
Full Text Sources
Other Literature Sources
Research Materials
