

A novel microglial subset plays a key role in myelinogenesis in developing brain
- PMID: 28963396
- PMCID: PMC5686552
- DOI: 10.15252/embj.201696056
A novel microglial subset plays a key role in myelinogenesis in developing brain
Abstract
Microglia are resident macrophages of the central nervous system that contribute to homeostasis and neuroinflammation. Although known to play an important role in brain development, their exact function has not been fully described. Here, we show that in contrast to healthy adult and inflammation-activated cells, neonatal microglia show a unique myelinogenic and neurogenic phenotype. A CD11c+ microglial subset that predominates in primary myelinating areas of the developing brain expresses genes for neuronal and glial survival, migration, and differentiation. These cells are the major source of insulin-like growth factor 1, and its selective depletion from CD11c+ microglia leads to impairment of primary myelination. CD11c-targeted toxin regimens induced a selective transcriptional response in neonates, distinct from adult microglia. CD11c+ microglia are also found in clusters of repopulating microglia after experimental ablation and in neuroinflammation in adult mice, but despite some similarities, they do not recapitulate neonatal microglial characteristics. We therefore identify a unique phenotype of neonatal microglia that deliver signals necessary for myelination and neurogenesis.
Keywords: CD11c; IGF1; microglia; myelinogenesis.
© 2017 The Authors. Published under the terms of the CC BY 4.0 license.
Figures
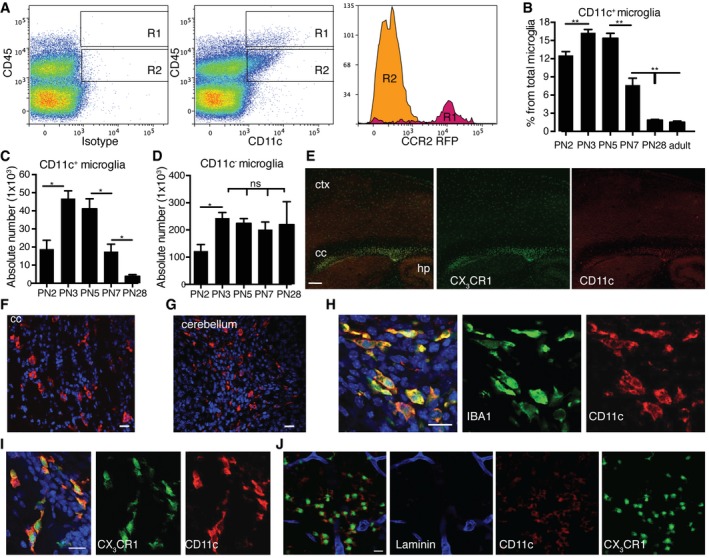
- A
Representative flow cytometry profiles of five individual brain suspensions prepared from PN5 mice showing RFP expression driven by Ccr2 promoter on CD45highCD11c+ cells (R1) and lack of expression on CD45lowCD11c+ microglia (R2).
- B–D
Flow cytometry analysis showing CD11c+ microglia presented as a percentage from total microglia (B), absolute numbers of CD11c+ microglia (C), and CD11c− microglia (D) at different time points PN2 (n = 4), PN3 (n = 6), PN5 (n = 6), PN7 (n = 6), PN28 (n = 9), and adult mouse brain (n = 16).
- E
Representative low‐power micrographs showing patches of CD11c‐stained cells (red) co‐localizing with GFP driven by Cx3cr1 promoter (green) in corpus callosum (cc) and single CX3CR1‐positive cells in cortex (ctx) and hippocampus (hp) in PN4‐5 brains (n = 3). Scale bar = 200 μm.
- F–I
Representative confocal microscopic micrographs showing CD11c‐stained cells (red) in corpus callosum (F) and cerebellum (G) as well as co‐localization of CD11c marker (red) and IBA1 (green) (H) or CX3CR1 (green) (I) in PN4‐5 brains (n = 3). Scale bars = 15 μm.
- J
Confocal microscopic analysis of two individual brains showing CD11c (red), CX3CR1 (green) double‐positive cells localized in the parenchyma, outside of the laminin‐stained blood vessels (blue) (n = 2). Scale bar = 15 μm.
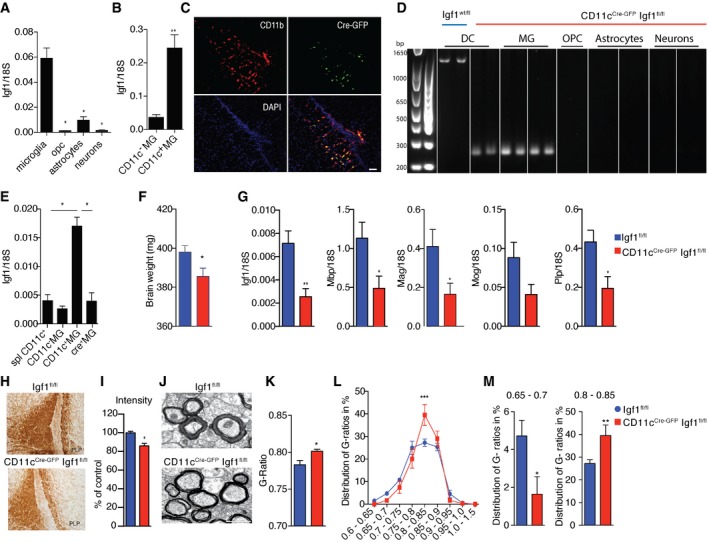
- A, B
Expression of Igf1 relative to 18S rRNA in MACS‐sorted microglia, OPC, astrocytes and neurons (n = 4) (A) as well as FACS‐sorted CD11c+ and CD11c− microglia (n = 6) (B) from brains of PN4‐7 mice.
- C
Representative micrographs showing patches of Cre‐GFP, CD11b double‐positive cells in corpus callosum from PN4‐5 CD11c Cre‐GFP Igf1fl/fl brains (n = 3), Scale bar = 50 μm.
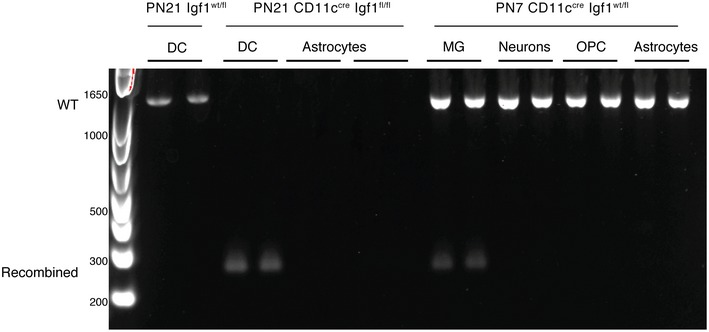
- D
Genomic PCR analysis of Cre recombination in MACS‐sorted splenic dendritic cells (DC) from Igf1wt/fl and microglia, OPC, astrocytes, and neurons from CD11cCre‐GFP Igf1fl/fl. Wild‐type Igf1 gene is detected as an ˜1‐kb band; Cre‐induced recombination is detected as an ˜0.2‐kb band, while the Igf1/flox locus cannot be amplified under the assay condition (Liu et al, 1998).
- E
Expression of Igf1 relative to 18S rRNA in FACS‐sorted splenic CD11c+ cells (n = 5), CD11c+ microglia (n = 5), and CD11c− microglia (n = 5) from Igf1fl/fl mice and Cre+ microglia (n = 4, each n represents a pool of 2 brains) from CD11cCre‐GFP Igf1fl/fl mice.
- F
Bar graph showing weights of brains from PN21 Igf1fl/fl (blue) (n = 8) and CD11cCre‐GFP Igf1fl/fl (red) (n = 4) mice.
- G
Expression of Igf1, Mog, Plp, and Mbp relative to 18S rRNA in brain tissue from PN21 CD11cCre‐GFP Igf1fl/fl and Igf1fl/fl mice (F) n = 6.
- H, I
Representative micrographs (H) and quantification of PLP staining intensity (I) in corpus callosum of CD11cCre‐GFP Igf1fl/fl (red) (n = 4) and Igf1fl/fl (blue) (n = 6) PN21 brains.
- J–M
Representative electron microscopy micrographs (J), mean G‐ratios (K), and distribution of G‐ratios (L, M) in corpus callosum from Igf1fl/fl (blue) (n = 8) and CD11c CD11cCre‐GFP Igf1fl/fl (red) (n = 6) PN21 brains. Scale bar = 1 μm.
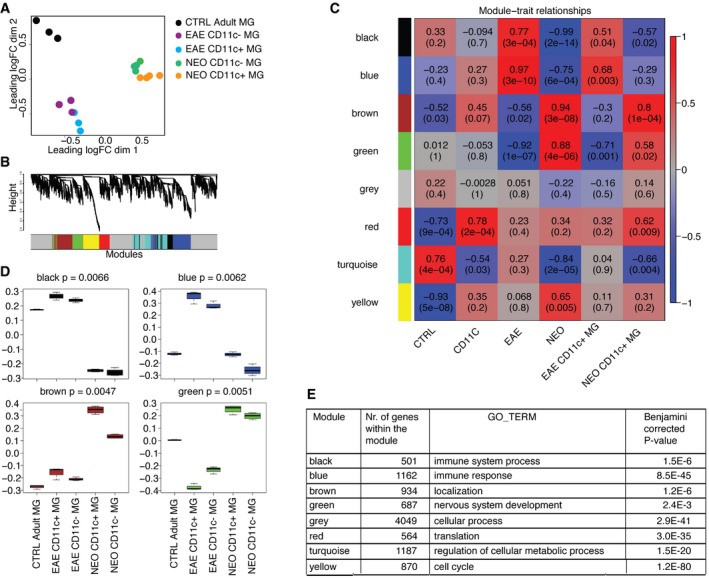
- A
Multidimensional scaling shows that neonatal, EAE subpopulations of microglia and adult microglia have distinct transcriptional profiles. Colors indicate six different groups of samples: orange represents neonatal CD11c+ microglia (n = 4), green neonatal CD11c− microglia (n = 4), blue EAE CD11c+ microglia (n = 3), purple EAE CD11c− microglia (n = 3), and black adult microglia (n = 3). Each n represents a pool of 10–15 mice from five individual EAE immunizations and four individual cell sorts of neonatal and naïve adult microglia.
- B, C
Co‐expression networks were generated for 12,691 genes of the transcriptome dataset. Average linkage hierarchical clustering was applied to the topological overlap matrix and branches of highly correlating genes were formed, which were cut and assigned a color (B). For each module, the Module Eigengene (ME) was calculated, which represents the expression profile of the module. The ME values were correlated with binary variables (Spearman's correlation) that represent control, CD11c+, EAE, neonatal, and CD11c+ microglia in neonates and EAE. Within each table cell, upper values represent correlation coefficients between ME and the variable, while lower values in brackets correspond to Student asymptotic P‐value (C).
- D
A boxplot containing the distribution of the black, blue, brown, and green ME values across the samples. The boxes contain the first and third quartiles; center line indicates the median and whiskers indicate minimum and maximum values. Kruskal–Wallis test was applied to determine whether ME values were significantly different between the groups.
- E
Table showing number of genes within the module and the top GO term for each module with Benjamini‐corrected P‐value.
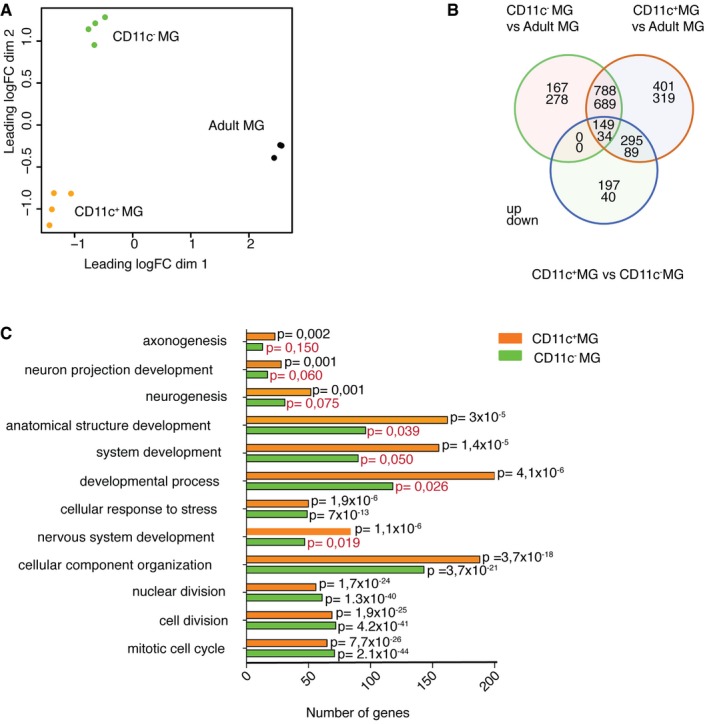
Multidimensional scaling shows that neonatal subpopulations of microglia and adult microglia have distinct transcriptional profiles. Colors indicate three different groups of samples: orange represents neonatal CD11c+ microglia (n = 4), green neonatal CD11c− microglia (n = 4), and black adult microglia (n = 3). Each n represents a pool of 10–15 mice from four individual cell sorts.
Venn diagram showing differentially expressed genes by neonatal CD11c+ microglia, neonatal CD11c− microglia, and adult microglia. Numbers of genes differentially expressed comparing neonatal CD11c− versus adult microglia, neonatal CD11c+ versus adult microglia, and neonatal CD11c+ versus neonatal CD11c− microglia are indicated.
GO enrichment analysis of upregulated genes (logFC ≥ 1.5; FDR ≤ 0.01) in neonatal CD11c+ microglia (orange bars) and CD11c− microglia (green bars) versus adult microglia identified significant (P‐values ≤ 0.01 after Benjamini correction) enrichment for 55 GOTERM_BP_ALL biological processes categories, 12 of which are shown on the graph. Benjamini‐corrected P‐values are indicated on the bar graph; P ≥ 0.01 are marked with red font.
- A
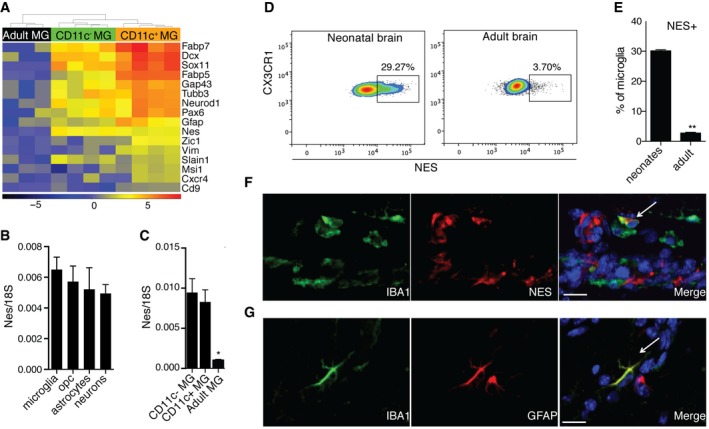
A heatmap showing neuroectodermal gene expression in neonatal versus adult microglia. Scale represents log2 fold change normalized CPM expression values.
- B, C
Expression of nestin in MACS‐sorted microglia (n = 4), OPC (n = 4), astrocytes (n = 4), and neurons (n = 3) from brains of PN3‐7 mice (B) as well as FACS‐sorted CD11c+ microglia (n = 5), CD11c− microglia (n = 5) from brains of PN4‐7 mice, and total microglia from adult brain (C).
- D, E
Representative flow cytometry profiles (D) and bar graph (E) showing nestin expression in microglia from brains of PN5 mice (n = 5) and adult mice (n = 6).
- F, G
Confocal microscopic analysis showing co‐localization of nestin (red) (F) or GFAP (red) (G) with IBA1 (green) (n = 3). Arrows point to IBA1, NES (F) and IBA1, GFAP (G) double positive cells. Scale bars = 15 μm.
- A
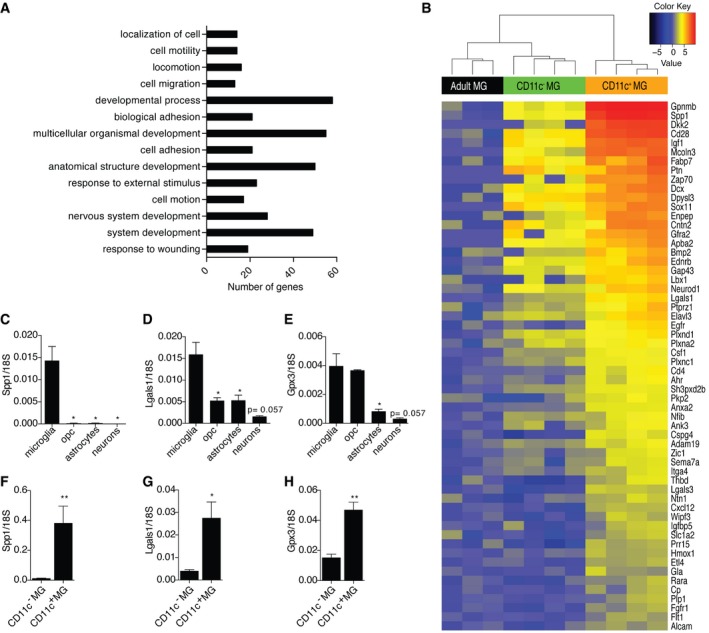
Ontological analysis of upregulated genes (logFC ≥ 1.5; FDR ≤ 0.01) in neonatal CD11c+ microglia in comparison with both neonatal CD11c− microglia and adult microglia identified significant (P ≤ 0.01 after Benjamini correction) enrichment for 14 GOTERM_BP_ALL biological processes categories.
- B
A heatmap showing upregulated genes involved in system development in neonatal CD11c+ microglia versus neonatal CD11c− and adult microglia. Scale represents log2 fold change normalized CPM expression values.
- C–H
Expression of Spp1, Lgals1, and Gpx3 relative to 18S rRNA in MACS‐sorted microglia (n = 4), OPC (n = 4), astrocytes (n = 4), and neurons (n = 3) (C, D, E) as well as FACS‐sorted CD11c+ (n = 5) and CD11c− microglia (n = 5) (F, G, H) from brains of PN4‐7 mice.
- A–C
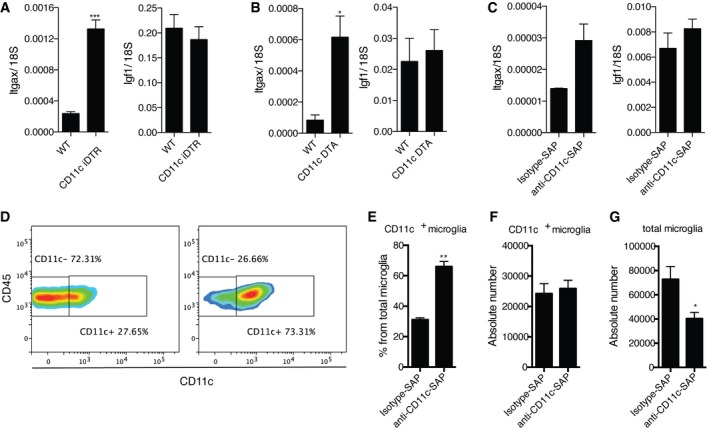
Expression of Itgax and Igf1 in PN5 brains of CD11c iDTR mice (n = 6) and WT littermates (n = 3) treated with DTx at days 1 and 3 after birth (A); PN7 brains of CD11c DTA mice (n = 5) and WT littermates (n = 3) (B); PN5 WT brains I.C. injected with saporin toxin conjugated with anti‐CD11c (n = 6) or isotype control antibody (n = 5) (C).
- D–G
Representative flow cytometry profiles (D) and flow cytometry analysis showing percentage from total microglia (E) and absolute numbers of CD11c+ microglia (F) as well as absolute numbers of total microglia (G) in PN5 WT brains I.C. injected with saporin toxin conjugated with anti‐CD11c (n = 6) or isotype control antibody (n = 5).
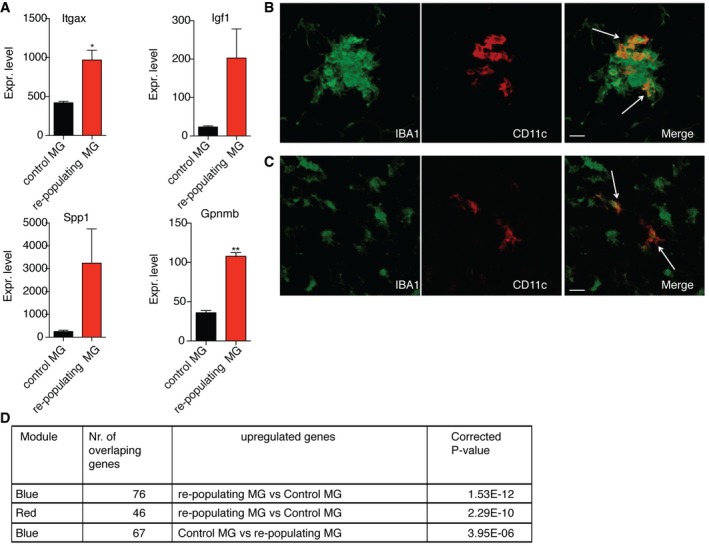
- A
Gene expression values of Itgax, Igf1, Spp1, and Gpnmb in control microglia (n = 2) and repopulating microglia (n = 3) obtained from RNA‐seq analysis. Each n represents a pool of two individual mice. P‐values were determined by Student's t‐test. ns, not significant; *P < 0.05; **P < 0.01.
- B, C
Confocal microscopic analysis showing co‐localization of CD11c (red) and IBA1 (green) within (B) and outside the repopulating microglia cluster (C) in brain stem of adult CX3CR1CreER iDTR mouse 7 days after DTx treatment (n = 2). Arrows point to IBA1, CD11c double positive cells. Scale bars = 15 μm.
- D
Table showing significant correlation of the up‐ and downregulated genes from repopulating microglia with two modules (red and blue) from Fig 3.
Comment in
-
A genetically distinct microglial subset promotes myelination.EMBO J. 2017 Nov 15;36(22):3269-3271. doi: 10.15252/embj.201798389. Epub 2017 Nov 3. EMBO J. 2017. PMID: 29101295 Free PMC article.
References
-
- Ajami B, Bennett JL, Krieger C, Tetzlaff W, Rossi FM (2007) Local self‐renewal can sustain CNS microglia maintenance and function throughout adult life. Nat Neurosci 10: 1538–1543 - PubMed
-
- Askew K, Li K, Olmos‐Alonso A, Garcia‐Moreno F, Liang Y, Richardson P, Tipton T, Chapman MA, Riecken K, Beccari S, Sierra A, Molnar Z, Cragg MS, Garaschuk O, Perry VH, Gomez‐Nicola D (2017) Coupled proliferation and apoptosis maintain the rapid turnover of microglia in the adult brain. Cell Rep 18: 391–405 - PMC - PubMed
-
- Beck KD, Powell‐Braxton L, Widmer HR, Valverde J, Hefti F (1995) Igf1 gene disruption results in reduced brain size, CNS hypomyelination, and loss of hippocampal granule and striatal parvalbumin‐containing neurons. Neuron 14: 717–730 - PubMed
-
- Bennett ML, Bennett FC, Liddelow SA, Ajami B, Zamanian JL, Fernhoff NB, Mulinyawe SB, Bohlen CJ, Adil A, Tucker A, Weissman IL, Chang EF, Li G, Grant GA, Hayden Gephart MG, Barres BA (2016) New tools for studying microglia in the mouse and human CNS. Proc Natl Acad Sci USA 113: E1738–E1746 - PMC - PubMed
Publication types
MeSH terms
Substances
LinkOut - more resources
Full Text Sources
Other Literature Sources
Molecular Biology Databases
Research Materials
Miscellaneous
