. 2017 Oct 1;28(20):2623-2636.
doi: 10.1091/mbc.E17-06-0416. Epub 2017 Aug 9.

Neuroprotective astrocyte-derived insulin/insulin-like growth factor 1 stimulates endocytic processing and extracellular release of neuron-bound Aβ oligomers

Affiliations

Neuroprotective astrocyte-derived insulin/insulin-like growth factor 1 stimulates endocytic processing and extracellular release of neuron-bound Aβ oligomers

Jason Pitt et al. Mol Biol Cell. .

Abstract

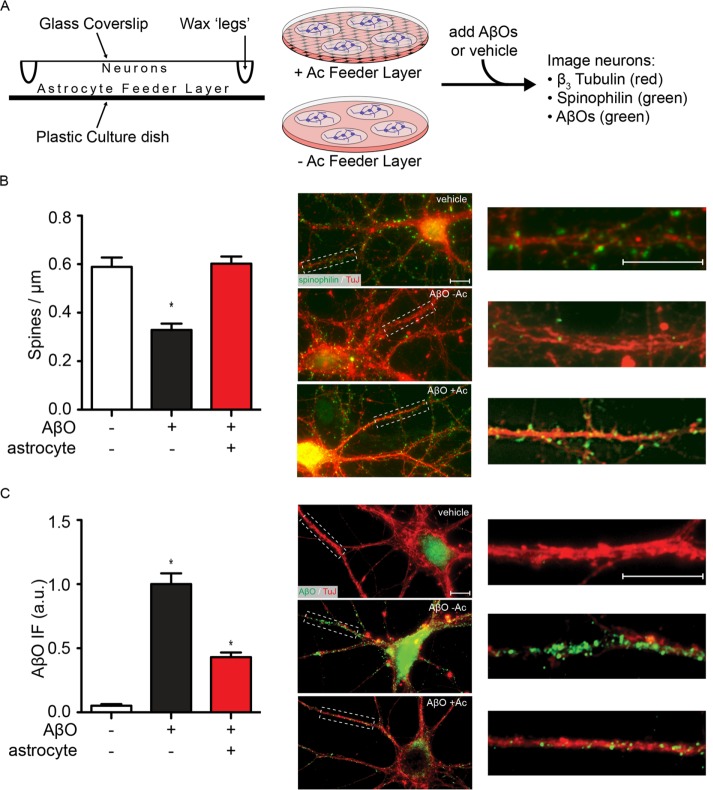
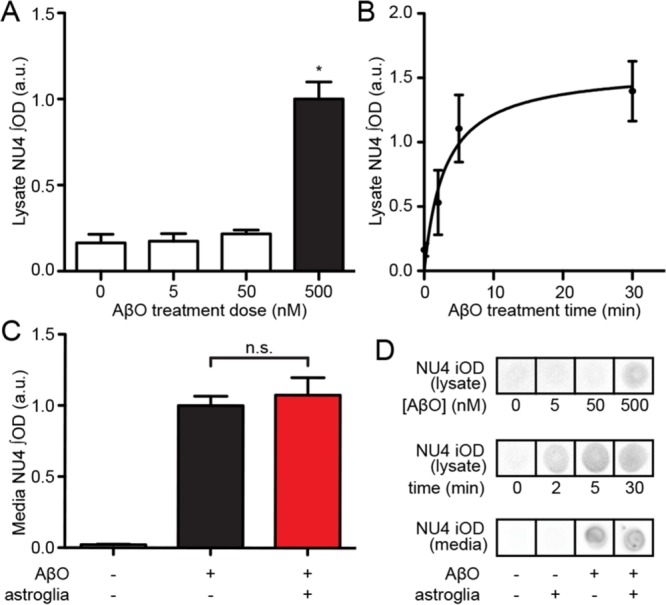
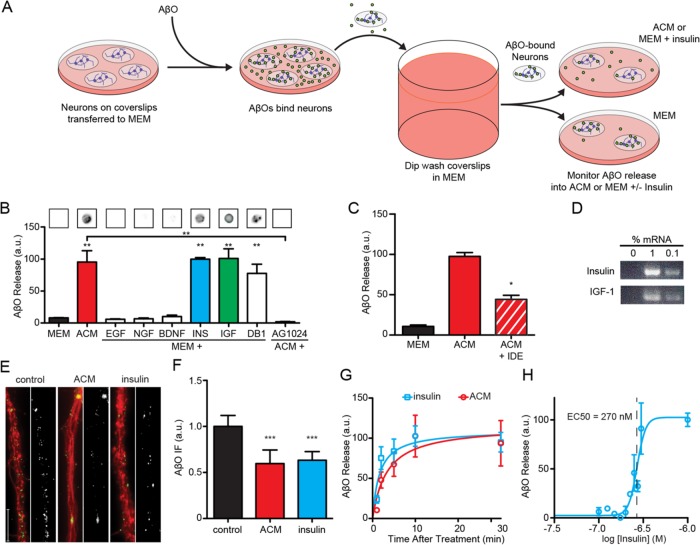
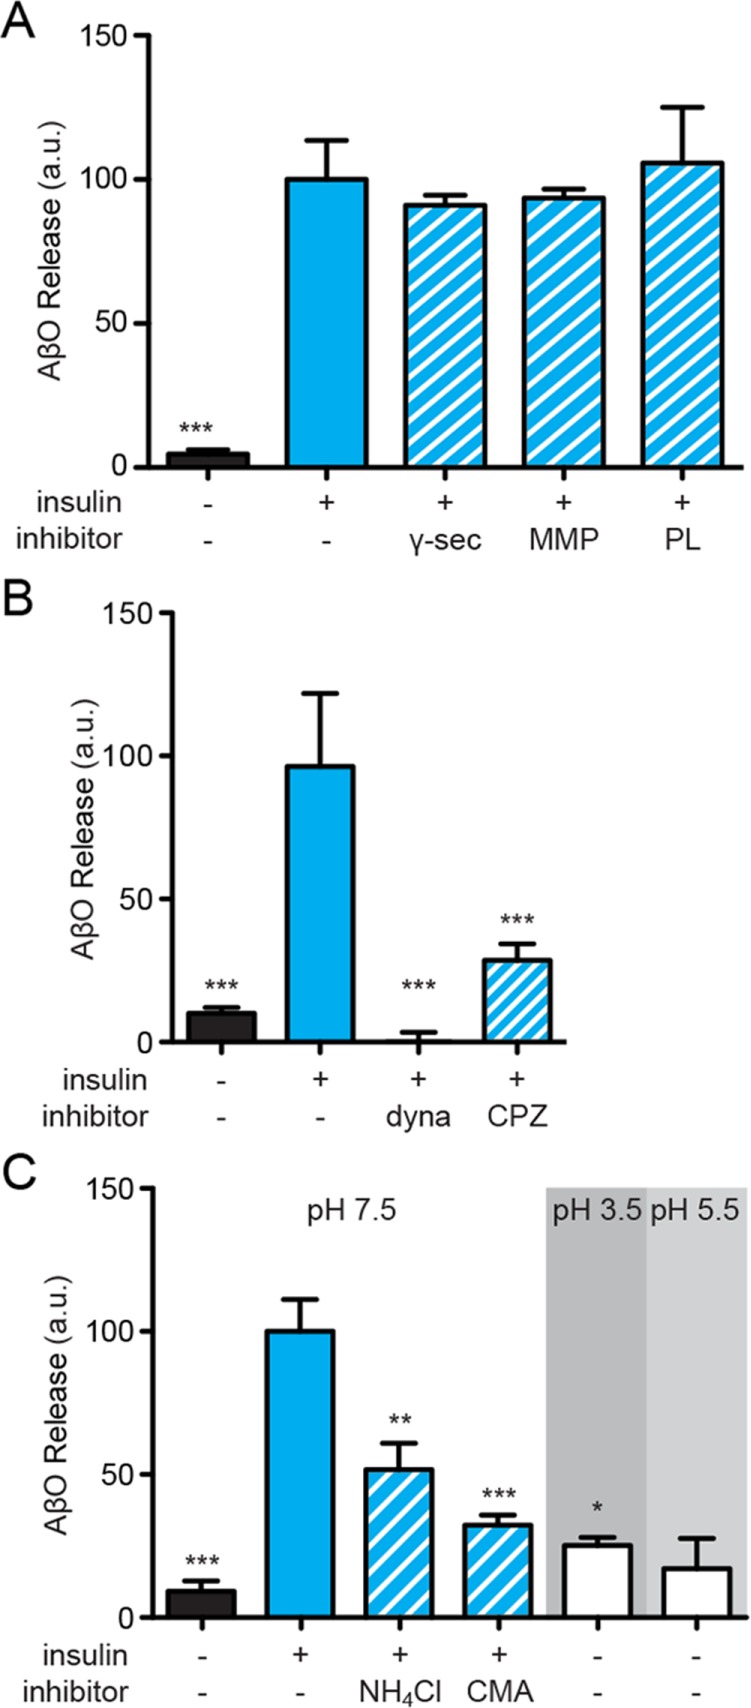
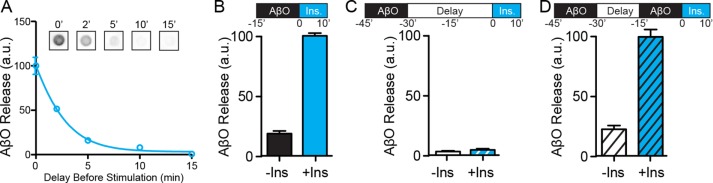
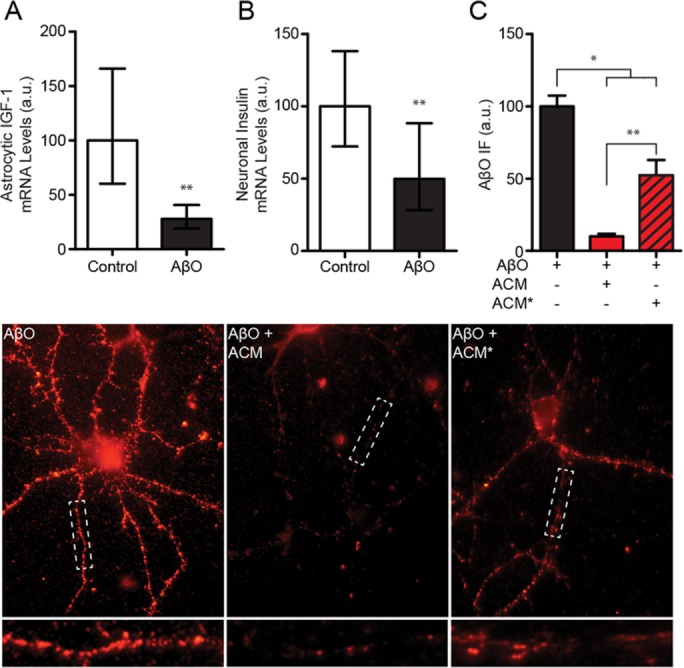
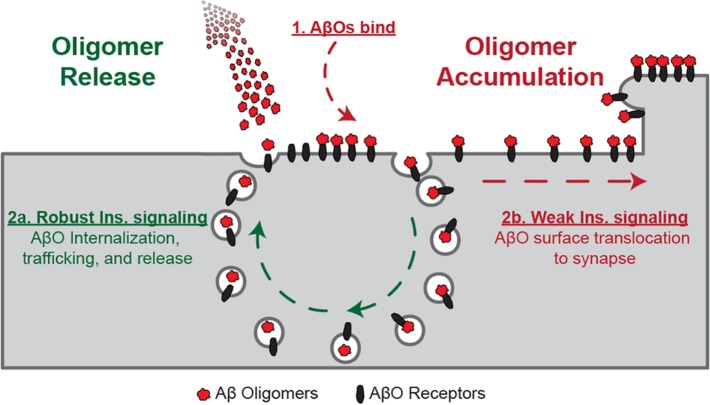
Synaptopathy underlying memory deficits in Alzheimer's disease (AD) is increasingly thought to be instigated by toxic oligomers of the amyloid beta peptide (AβOs). Given the long latency and incomplete penetrance of AD dementia with respect to Aβ pathology, we hypothesized that factors present in the CNS may physiologically protect neurons from the deleterious impact of AβOs. Here we employed physically separated neuron-astrocyte cocultures to investigate potential non-cell autonomous neuroprotective factors influencing AβO toxicity. Neurons cultivated in the absence of an astrocyte feeder layer showed abundant AβO binding to dendritic processes and associated synapse deterioration. In contrast, neurons in the presence of astrocytes showed markedly reduced AβO binding and synaptopathy. Results identified the protective factors released by astrocytes as insulin and insulin-like growth factor-1 (IGF1). The protective mechanism involved release of newly bound AβOs into the extracellular medium dependent upon trafficking that was sensitive to exosome pathway inhibitors. Delaying insulin treatment led to AβO binding that was no longer releasable. The neuroprotective potential of astrocytes was itself sensitive to chronic AβO exposure, which reduced insulin/IGF1 expression. Our findings support the idea that physiological protection against synaptotoxic AβOs can be mediated by astrocyte-derived insulin/IGF1, but that this protection itself is vulnerable to AβO buildup.


Figures

FIGURE 1:
FIGURE 1:
Astrocytes prevent AβO-induced spine loss and reduce dendritic AβO accumulation. (A) Hippocampal neurons were grown on coverslips above astrocyte feeder layers using drops of paraffin wax as spacers. Coverslips were either maintained above feeder layers or moved to astrocyte-free dishes, and AβOs were added. Spine loss and AβO binding were measured by immunocytochemistry. (B) When neurons were isolated from their astrocyte feeder layer (−Ac), spinophilin levels (green) along neurites (TuJ, red) were reduced by 44 ± 4% after treatment with 500 nM AβOs for 24 h. When astrocytes were present (+Ac), spinophilin levels were unaffected by addition of AβOs. (C) Under similar conditions of AβO treatment, neurons separated from their astrocyte feeder layer had prominent AβO labeling (NU4, green) along their neurites (TuJ, red), but the presence of astrocytes reduced AβO accumulation by 57 ± 4%. *, p < 0.0001, Mann-Whitney. Scale bars: 10 μm.
FIGURE 2:
FIGURE 2:
Protection by astrocytes is not due to removal of AβOs from media. (A) Dot blots of astrocyte lysates showed readily detectable oligomer immunoreactivity when obtained from cultures incubated with 500 nM AβOs. (B) Uptake is time dependent and plateaus at ∼5 min. (C) AβO levels in media (500 nM) were unchanged by the presence of astrocyte feeder layers over a 30-min period (red bar; astrocyte-free control conditions, black bar). MEM culture media contained 500 nM AβOs. *, p < 0.05, Mann-Whitney; n.s., p = 0.30, unpaired t test. (D) Examples of dot immunoblot signals quantified in A–C.
FIGURE 3:
FIGURE 3:
Neuron-bound AβOs are released into the media due to the action of astrocyte-derived insulin and IGF1. (A) Primary hippocampal neurons were grown on coverslips and exposed to AβOs. Unbound AβOs were quickly removed by submerging coverslips in excess MEM. Coverslips were transferred to new dishes containing MEM supplemented with growth factors. (B) Dot blot analysis of the media showed ACM contained AβOs released from neurons (red bar). This effect was also observed when MEM was supplemented with 300 nM insulin (blue bar) or IGF1 (green bar) or 10 μM demethylasterriquinone B1 (DB1). Significant release was not observed after supplementation with 300 nM EGF, NGF, or BDNF. Treatment with AG 1024, an antagonist of insulin and IGF1 receptors, prevented ACM from stimulating AβO release. (C) IDE treatment of ACM reduced its ability to stimulate AβO liberation by 56 ± 5%. (D) Insulin and IGF1 mRNAs were detectable in cultured astrocytes by RT-PCR at 1:100 and 1:1000 dilutions. RT-PCRs without cDNA did not yield a detectable product. (E, F) The detection of AβOs in the media was accompanied by a reduction in AβO immunofluorescence (NU1, green) along neurites (TuJ, red). ACM and insulin reduced neuritic AβO burden by 40 ± 15% and 37 ± 10%, respectively. For clarity, the AβO signal is shown in black and white next to each condition. (G) Half-maximal AβO liberation occurred at 1.6 ± 0.7 min and 3.4 ± 2.2 min for insulin and ACM treatments, respectively. (H) Insulin stimulated the removal of neuron-bound AβOs with an EC50 of 270 nM. *, p < 0.05, Mann-Whitney; **, p < 0.01, Mann-Whitney; ***, p < 0.0005, Mann-Whitney.
FIGURE 4:
FIGURE 4:
Surface-bound AβOs are endocytosed before release. (A) Inhibition of proteolytic enzymes did not prevent insulin-dependent AβO release. Statistical comparisons are relative to insulin treatments unless otherwise noted; *, p < 0.05, Mann-Whitney; **, p < 0.005, Mann-Whitney; ***, p < 0.0005, Mann-Whitney. (B) Pharmacological inhibition of clathrin-mediated endocytosis using 100 μM dynasore or 75 μM chlorpromazin reduced insulin-mediated AβO release by 100% or 68 ± 7%, respectively. (C) Treatment with 2 mM NH4Cl or 2 μM concanamycin A (CMA) reduced insulin-dependent AβO release by 48 ± 9% or 68 ± 3%, respectively. Minimal oligomer liberation occurs at pH 5.5 and 3.5 in the absence of insulin.
FIGURE 5:
FIGURE 5:
SIM enables precise imaging of AβOs bound to spines. SIM was used to determine the binding of AβOs to primary hippocampal neurons, using the N-SIM superresolution microscope with a lateral resolution at 100× of ∼100 nm, compared with the more typical 400 nm of most microscopes. Primary hippocampal cells, cultured for 19 d, were treated with 100 nM AβOs for 1 h and immunolabeled with anti-TuJ (green) and NU4 (magenta).
FIGURE 6:
FIGURE 6:
Prolonged exposure shows a reduction of AβOs in spines. Hippocampal cells were pretreated with or without insulin for 1 h before addition of AβOs for 15 min or 4 h. Cells were then probed for the exosomal marker Rab11 (green) and AβOs (red). (A, B) Primary hippocampal neurons pretreated for 1 h without (A) or with (B) insulin before 15-min incubation with AβOs show a marked internalization of bound AβOs to the processes. (C, D) Pretreatment without (C) or with (D) insulin followed by a 4-h incubation with AβOs induces a reduction in AβO binding as well as an internalization AβOs. No significant colocalization of AβOs with the endosome marker Rab11 is seen.
FIGURE 7:
FIGURE 7:
AβOs are internalized in response to insulin pretreatment. Hippocampal cells were pretreated with insulin for 1 h before addition of AβOs for 15 min. (A) or 4 h (B) Cells were then probed for the exosomal marker Rab4 (green) and AβOs (red). (A) Cells receiving insulin and AβOs for 15 min. (B) Cells receiving insulin and AβOs for 4 h. (C) Inset reveals that AβOs appear to be segregated into endosome-like compartments in dendritic spines.
FIGURE 8:
FIGURE 8:
AβOs induce a release of exosomes and pTau 231 to the substrate after pretreatment with insulin. (A, B) Confocal microscopy shows that pretreatment of primary hippocampal cells for 1 h without (A) or with (B) insulin caused levels of culture substrate–bound AβOs (red) and Rab4 (green) to be elevated. No colocalization was observed. (C, D) Wide-field fluorescence microscopy of hippocampal neurons pretreated for 4 h without (C) or with (D) insulin before 24-h incubation with AβOs (red) and a sphingomyelinase inhibitor shows that insulin increases the AβO-induced release of pTau 231 (green).
FIGURE 9:
FIGURE 9:
AβOs become resistant to insulin-dependent removal mechanisms. (A) Immediately after AβO exposure, neurons were placed into basal MEM for 0, 2, 5, 10, and 15 min before addition of 1 μM insulin to stimulate release. At 2 min, AβO removal is reduced ∼50%. At times longer than 5 min, insulin fails to liberate AβOs. (B) AβOs were releasable when there was no delay between AβO binding and insulin treatment. (C) A 30-min delay following AβO binding resulted in AβOs that were not releasable by insulin treatment. (D) Despite the continued presence of nonreleasable AβOs, a second application of AβOs immediately before insulin treatment proved to be fully releasable compared with B.
FIGURE 10:
FIGURE 10:
AβOs reduce insulin and IGF1 expression in astrocytes and neurons. (A) Treatment of cultured astrocytes with AβOs (500 nM) reduced IGF1 expression more than twofold (geometric mean = 28.0%; 95% CI = 19.1–40.8%) compared with control (geometric mean = 100%; 95% CI = 60.2–166%). (B) Treatment of cultured neurons with AβOs reduced insulin expression in neurons approximately twofold (geometric mean = 49.9%; 95% CI = 28.2–88.3%) compared with control (geometric mean = 100%; 95% CI = 72.3–138%). (C) Treatment of cultured astrocytes reduced the protective efficacy of conditioned media (based on images below). While conditioned media from untreated astrocytes (ACM) reduced neuronal AβO accumulation ∼90% (red bar), accumulation was down only ∼45% using media from astrocytes previously exposed to AβOs (AβO-ACM*; red and black striped bar). Geometric means and 95% CIs are plotted in A and B. Arithmetic means and standard errors are plotted in C. *, p < 0.05, Mann-Whitney; **, p < 0.01, Mann-Whitney.
FIGURE 11:
FIGURE 11:
Proposed model for insulin/IGF1-stimulated AβO release. After AβO attachment to the neuronal surface, stimulation of insulin/IGF1 signaling leads to AβO internalization. AβOs are detached from their binding targets and shuttled back to the neuronal surface, where they are released to the extracellular space. When insulin/IGF1 signaling is deficient, AβOs are rapidly trapped at the neuronal surface and become resistant to insulin/IGF1-induced release.

References

    1. Allen NJ, Bennett ML, Foo LC, Wang GX, Chakraborty C, Smith SJ, Barres BA. Astrocyte glypicans 4 and 6 promote formation of excitatory synapses via GluA1 AMPA receptors. Nature. 2012;486:410–414. - PMC - PubMed
    1. Alzheimer’s Association. 2013 Alzheimer’s disease facts and figures. Alzheimers Dement. 2013;9:208–245. - PubMed
    1. Aniento F, Gu F, Parton RG, Gruenberg J. An endosomal beta COP is involved in the pH-dependent formation of transport vesicles destined for late endosomes. J Cell Biol. 1996;133:29–41. - PMC - PubMed
    1. Aoki N, Jin-no S, Nakagawa Y, Asai N, Arakawa E, Tamura N, Tamura T, Matsuda T. Identification and characterization of microvesicles secreted by 3T3-L1 adipocytes: redox- and hormone-dependent induction of milk fat globule-epidermal growth factor 8-associated microvesicles. Endocrinology. 2007;148:3850–3862. - PubMed
    1. Araque A, Parpura V, Sanzgiri RP, Haydon PG. Glutamate-dependent astrocyte modulation of synaptic transmission between cultured hippocampal neurons. Eur J Neurosci. 1998;10:2129–2142. - PubMed

LinkOut - more resources