. 2017 Sep 29;7(1):12401.
doi: 10.1038/s41598-017-10861-6.

Small ocean temperature increases elicit stage-dependent changes in DNA methylation and gene expression in a fish, the European sea bass

Affiliations

Small ocean temperature increases elicit stage-dependent changes in DNA methylation and gene expression in a fish, the European sea bass

Dafni Anastasiadi et al. Sci Rep. .

Abstract

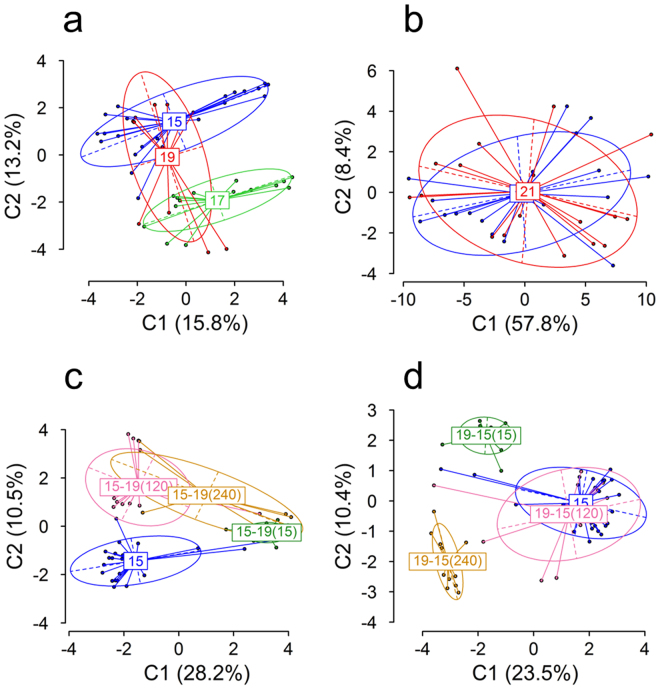
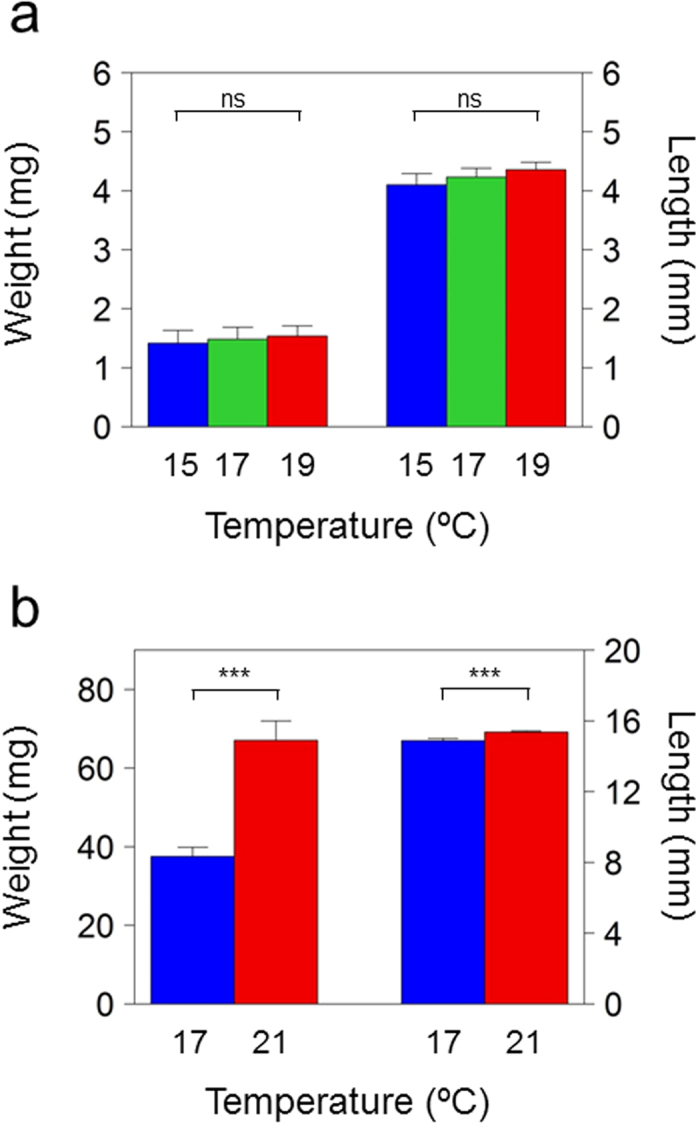
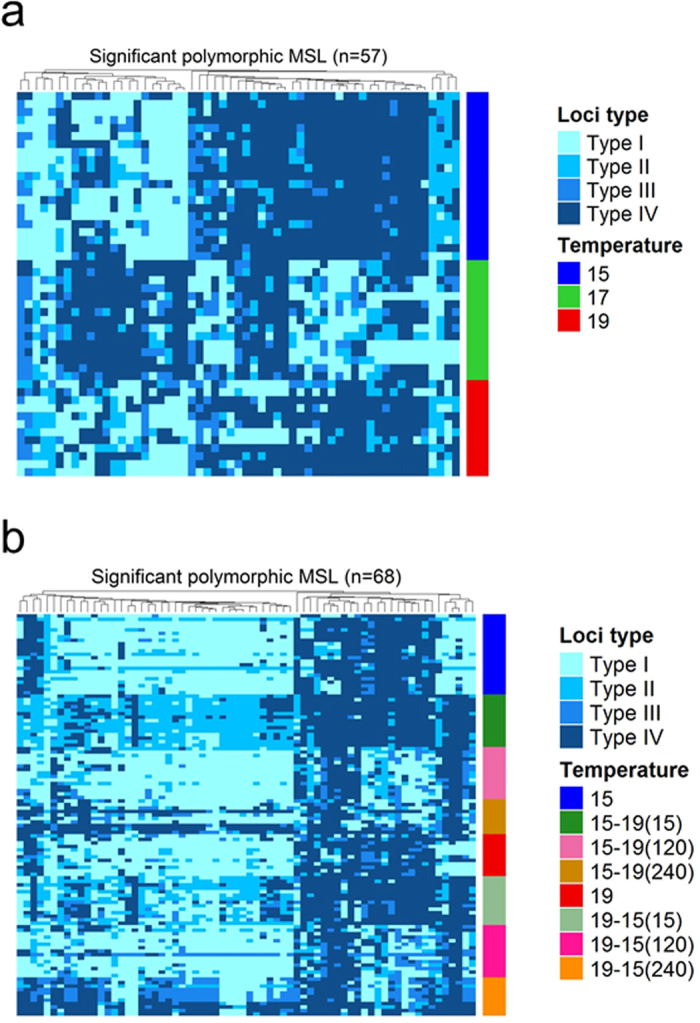
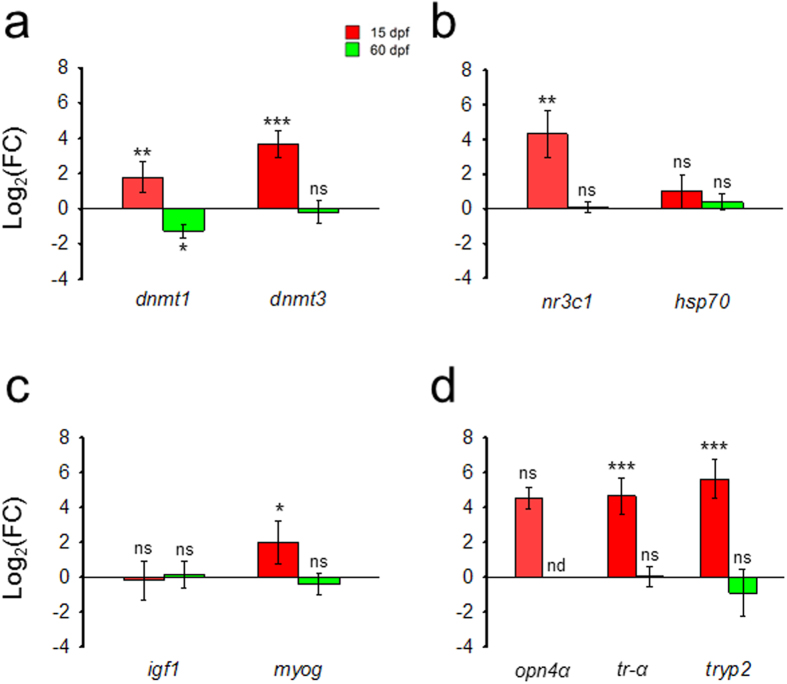
In natural fish populations, temperature increases can result in shifts in important phenotypic traits. DNA methylation is an epigenetic mechanism mediating phenotypic changes. However, whether temperature increases of the magnitude predicted by the latest global warming models can affect DNA methylation is unknown. Here, we exposed European sea bass to moderate temperature increases in different periods within the first two months of age. We show that increases of even 2 °C in larvae significantly changed global DNA methylation and the expression of ecologically-relevant genes related to DNA methylation, stress response, muscle and organ formation, while 4 °C had no effect on juveniles. Furthermore, DNA methylation changes were more marked in larvae previously acclimated to a different temperature. The expression of most genes was also affected by temperature in the larvae but not in juveniles. In conclusion, this work constitutes the first study of DNA methylation in fish showing that temperature increases of the magnitude predicted by the latest global warming models result in stage-dependent alterations in global DNA methylation and gene expression levels. This study, therefore, provides insights on the possible consequences of climate change in fish mediated by genome-wide epigenetic modifications.


Conflict of interest statement

The authors declare that they have no competing interests.

Figures

Figure 1
Figure 1
Global DNA methylation in European sea bass larvae (a, c, d) and juveniles (b) subjected to constant temperatures (a, b) or acclimated at different stages during development (c, d) and visualized by Principal Coordinates Analysis (PCoA). (a) Larvae reared at 15 °C [blue, n = 21], 17 °C [green, n = 15] or 19 °C [red, n = 12]. (b) Juveniles reared at 17 °C [blue, n = 18] or 21 °C [red, n = 18]. (c) Larvae switched to 19 °C at 15 [15–19(15), green, n = 15], 120 [15–1915–19(120), pink, n = 15] and 240 [15–19(240), yellow, n = 10] hours post fertilization. (d) Larvae switched to 15 °C at 15 [19-15(15), green, n = 14], 120 [19-15(120), pink, n = 15] and 240 [19-15(240), yellow, n = 11] hours post fertilization. The two first components of the PCoA are shown. Values in parenthesis indicate the percentage of the variance explained. Group labels indicate the centroid, the ellipses show the group dispersion, the dotted lines the direction of maximum and minimum dispersion (long and short axis of the ellipse, respectively) and the points represent individual samples from the different groups.
Figure 2
Figure 2
Weight and standard length of sea bass reared at constant temperatures during the thermosensitive period of development. (a) Larvae of 15 days post fertilization (dpf) reared at 15 °C (n = 10), 17 °C (n = 10) and 19 °C (n = 10). (b) Juveniles of 60 dpf reared at 17 °C (n = 20) or 21 °C (n = 20) from 20 to 60 dpf. Statistical differences were calculated by the Kruskal-Wallis rank sum test for the 0–15 dpf period and the Wilcoxon rank sum test for the 20–60 dpf period and are shown for each stage with the following equivalence: ***p ≤ 0.001, ns = not significant.
Figure 3
Figure 3
Significant polymorphic methylation susceptible loci (MSL) in larvae. (a) Significant loci between groups of larvae subjected at 15 °C, 17 °C or 19 °C from 0 to 15 days post fertilization plotted as a heatmap (n = 57 significant loci). (b) Significant loci between groups of larvae subjected to constant 15 °C or 19 °C, and larvae switched from 15 °C to 19 °C at 15 hours post fertilization (hpf; 15–19(15)), 120 hpf (15–19(120)) or 240 hpf (15–19(240)), or switched from 19 °C to 15 °C at 15 hpf (19-15(15)), 120 hpf (19-15(120)) or 240 hpf (19-15(240)). In this case, the n = 68 significant loci common to both types of temperature switches, (15 °C to 19 °C and 19 °C to 15 °C) were identified and used for the heatmap. Significant single loci were identified after applying multiple Fisher’s exact tests and adjusting the obtained p-values by the method of Benjamini and Hochberg. Only loci with an FDR < 0.05 were used in the analysis. A hierarchical clustering using the Unweighted Pair Group Method with Arithmetic Mean (UPGMA) based on pairwise Gower’s distances of categorical variables was applied for the loci. Four types of loci were used: Type I, unmethylated; Type II, inner cytosine methylation; Type III, hemi-methylation of the outer cytosine; Type IV, full methylation.
Figure 4
Figure 4
Gene expression changes in fish exposed to high vs. low temperature sampled when larvae at 15 days post fertilization (dpf) or when juveniles at 60 dpf. (a) Genes related to DNA methylation: DNA (cytosine-5-)-methyltransferase 1 (dnmt1) and DNA (cytosine-5-)-methyltransferase 3 (dnmt3); (b) Genes related to stress: glucocorticoid receptor (nr3c1) and heat shock cognate 70 protein (hsp70); (c) Genes related to muscle growth and differentiation: insulin-like growth factor 1 (igf1) and myogenin (myog). (d) Genes related to organ/tissue formation/function: long melanopsin (opn4α), related to visual system; thyroid hormone receptor alpha (tr-α), related to metamorphosis; and trypsinogen 2 (tryp2), related to the digestive system. Data are shown as log2-transformed fold change (log2FC) values and error bars indicate the confidence intervals. For each gene, log2FC values were calculated comparing the +4 °C group with respect to their corresponding low temperature at either 15 (19 °C vs 15 °C) or 60 dpf (21 °C vs 17 °C), which was always set at 0 in the log scale (n = 4). For each gene, statistical differences were calculated by pairwise Student’s two-tailed t-tests and corrected for multiple comparisons and are shown between each group and its corresponding control temperature group (asterisks), with the following equivalence: *q < 0.05, **q < 0.01, ***q < 0.001, ns = not significant, nd = not determined.

Similar articles

Cited by

References

    1. IPCC. Climate Change 2014: Synthesis Report. Contribution of Working Groups I, II and III to the Fifth Assessment Report of the Intergovernmental Panel on Climate Change (2014).
    1. Crozier LG, Hutchings JA. Plastic and evolutionary responses to climate change in fish. Evol. Appl. 2014;7:68–87. doi: 10.1111/eva.12135. - DOI - PMC - PubMed
    1. Sultan SE. Development in context: the timely emergence of eco-devo. Trends Ecol. Evol. 2007;22:575–582. doi: 10.1016/j.tree.2007.06.014. - DOI - PubMed
    1. Gilbert, S. F. & Epel, D. Ecological Developmental Biology: Integrating Epigenetics, Medicine, and Evolution. (Sinauer Associates, 2008).
    1. Turner BM. Defining an epigenetic code. Nat. Cell Biol. 2007;9:2–6. doi: 10.1038/ncb0107-2. - DOI - PubMed

Publication types